. 2022 Jun;27(6):2787-2802.
doi: 10.1038/s41380-022-01514-w. Epub 2022 Apr 1.

Dopamine-induced pruning in monocyte-derived-neuronal-like cells (MDNCs) from patients with schizophrenia

Affiliations

Dopamine-induced pruning in monocyte-derived-neuronal-like cells (MDNCs) from patients with schizophrenia

Alfredo Bellon et al. Mol Psychiatry. 2022 Jun.

Abstract

The long lapse between the presumptive origin of schizophrenia (SCZ) during early development and its diagnosis in late adolescence has hindered the study of crucial neurodevelopmental processes directly in living patients. Dopamine, a neurotransmitter consistently associated with the pathophysiology of SCZ, participates in several aspects of brain development including pruning of neuronal extensions. Excessive pruning is considered the cause of the most consistent finding in SCZ, namely decreased brain volume. It is therefore possible that patients with SCZ carry an increased susceptibility to dopamine's pruning effects and that this susceptibility would be more obvious in the early stages of neuronal development when dopamine pruning effects appear to be more prominent. Obtaining developing neurons from living patients is not feasible. Instead, we used Monocyte-Derived-Neuronal-like Cells (MDNCs) as these cells can be generated in only 20 days and deliver reproducible results. In this study, we expanded the number of individuals in whom we tested the reproducibility of MDNCs. We also deepened the characterization of MDNCs by comparing its neurostructure to that of human developing neurons. Moreover, we studied MDNCs from 12 controls and 13 patients with SCZ. Patients' cells differentiate more efficiently, extend longer secondary neurites and grow more primary neurites. In addition, MDNCs from medicated patients expresses less D1R and prune more primary neurites when exposed to dopamine. Haloperidol did not influence our results but the role of other antipsychotics was not examined and thus, needs to be considered as a confounder.


Conflict of interest statement

This protocol is patented in the USA (99932556 (B2)) and Europe (2862926 (A1 & B1)). This patent is held by AB, MOK, VF, TMJ and AH in collaboration with INSERM and SATT IDF-Innov. The authors report no other financial conflict of interest related to this manuscript.

Figures

Fig. 1
Fig. 1. Reproducibility of results with MDNCs and structural comparison with human developing neurons.
A Confidence interval plots in which dots represent means of differences between samples and error bars correspond to 95% confidence interval constructed using the Kolmogorov–Smirnov Test. The parameters presented are: differentiation percentage (subject 1, sample 1 (S1) n = 336 (cells), S2 n = 433; subject 2, S1 n = 284, S2 n = 523; subject 3, S1 n = 167, S2 n = 133, S3 n = 464; subject 4, S1 n = 556, S2 n = 434, S3 n = 255; subject 5, S1 n = 251, S2 n = 193; subject 6, S1 n = 797, S2 n = 413; subject 7, S1 n = 167, S2 n = 180; subject 8, S1 n = 1027, S2 n = 1531), number of differentiated cells (subject 1, S1 n = 27, S2 n = 45; subject 2, S1 n = 20, S2 n = 19; subject 3, S1 n = 16, S2 n = 23, S3 n = 38; subject 4, S1 n = 36, S2 n = 33, S3 n = 30; subject 5, S1 n = 25, S2 n = 25; subject 6, S1 n = 74, S2 n = 54; subject 7, S1 n = 28, S2 n = 28; subject 8, S1 n = 44, S2 n = 57), longest primary neurite (LPN) (subject 1, S1 n = 27, S2 n = 45; subject 2, S1 n = 20, S2 n = 19; subject 3, S1 n = 16, S2 n = 23, S3 n = 38; subject 4, S1 n = 36, S2 n = 33, S3 n = 30; subject 5, S1 n = 25, S2 n = 39; subject 6, S1 n = 74, S2 n = 54; subject 7, S1 n = 28, S2 n = 28; subject 8, S1 n = 44, S2 n = 57), longest secondary neurite (LSN) (subject 1, S1 n = 27, S2 n = 45; subject 2, S1 n = 20, S2 n = 19; subject 3, S1 n = 16, S2 n = 23, S3 n = 38; subject 4, S1 n = 35, S2 n = 33, S3 n = 30; subject 5, S1 n = 25, S2 n = 39; subject 6, S1 n = 67, S2 n = 54; subject 7, S1 n = 28, S2 n = 28; subject 8, S1 n = 42, S2 n = 56), number of primary neurites (subject 1, S1 n = 26, S2 n = 37; subject 2, S1 n = 12, S2 n = 13; subject 3, S1 n = 14, S2 n = 19, S3 n = 32; subject 4, S1 n = 22, S2 n = 25, S3 n = 23; subject 5, S1 n = 25, S2 n = 32; subject 6, S1 n = 51, S2 n = 45; subject 7, S1 n = 26, S2 n = 23; subject 8, S1 n = 38, S2 n = 48), number of secondary neurites and number of total neurites (same n for both) (subject 1, S1 n = 27, S2 n = 45; subject 2, S1 n = 20, S2 n = 19; subject 3, S1 n = 16, S2 n = 23, S3 n = 38; subject 4, S1 n = 36, S2 n = 33, S3 n = 30; subject 5, S1 n = 25, S2 n = 39; subject 6, S1 n = 74, S2 n = 54; subject 7, S1 n = 28, S2 n = 28; subject 8, S1 n = 44, S2 n = 57). *P = or < 0.05. B Light microscopy photographs of monocyte-derived-neuronal-like cells (MDNC) and human developing neurons (HDN) in culture for 5 days (20x original magnification). Scale bar = 20 µm. C Bar graphs showing the structural response to colchicine in HDNs and MDNCs. Data are expressed as ratios between the number of each structural parameter studied (LPN, LSN, number of primary and secondary neurites and total number of neurites) at baseline and after an hour of incubation either under control conditions or after treatment with colchicine 0.5 µM. Statistics are given as mean ± SEM. Differences were assessed using the Mann–Whitney test. Experiments for HDN come from 13 wells for each condition obtained from two different vials of human neurons. HDN for LPN, number of primary neurites and total number of neurites, control, n = 267 and colchicine, n = 261. For LSN control, n = 90 and colchicine, n = 125 and for number of secondary neurites control, n = 90 and colchicine, n = 123. Control MDNCs came from 8 donors and MDNCs treated with colchicine from 4 donors. MDNCs for LPN, number of primary neurites and total number of neurites, n = 656 control, n = 401 colchicine. MDNCs for LSN, n = 571 control, n = 267 colchicine. MDNCs for number of secondary neurites, n = 611 control, n = 357. *P = or < 0.05; **P = or < 0.008; ***P < 0.0001.
Fig. 2
Fig. 2. MDNCs from controls (CTL) versus patients with schizophrenia (SCZ).
A Representative light microscopy photographs of the four different morphologies characterized during transdifferentiation: rounded cells (RC), standard macrophages (SM), fibroblastic shape (FS) and uncharacterized (UC) (20x original magnification). Scale bar = 20 µm. B Bar graphs showing variations between controls and patients with schizophrenia in the percentage of each of the four cell morphologies on day 4, 7, 10 and 13 of transdifferentiation. Repeated ANOVAs based on the mixed model framework were performed to examine group differences for each day. Data are given as mean ± SEM. Cells from 12 CTL and 13 SCZ were characterized for day 4, 7 & 10 and 5 CTL and 11 SCZ for day 13. Cells characterized on day 4, CTL n = 8437, SCZ n = 8204; on day 7, CTL n = 7783, SCZ n = 7609; on day 10, CTL n = 7125, SCZ n = 6830; and on day 13, CTL n = 2475, SCZ n = 5342. *P = or < 0.05. C Bar graphs contrasting the percentage of differentiated cells between CTL, SCZ and only medicated patients (MED). CTL, 12.7 ± 1.3%; SCZ, 16.7 ± 1.3%; P = 0.04; MED, 17.4 ± 1.4%; P = 0.027. Differentiation was obtained via cell phenotype. To determine differences between groups, multilevel mixed models to account for correlations of repeated measures at subject level and sample level were used, followed by a two-sample t test. Data are given as mean ± SEM. Cells from 12 CTL and 13 SCZ (of which 11 are medicated “MED”) were included in the analysis. Characterized cells for CTL, n = 32791; SCZ n = 37281; and for MED n = 32986. *P = or < 0.05, **P < 0.03. D Dot plots contrasting relative fluorescence intensity (RFI) of CD14 in macrophages (MF) versus MDNCs from either CTL or SCZ. CD14 RFI was measured via flow cytometry. For CTL, MF, 140 ± 44; MDNCs, 49 ± 17; P = 0.03; for SCZ, MF, 154 ± 34.5; MDNCs, 110 ± 33.8; P = 0.25. Differences were assessed using the Mann–Whitney test. Data are given as mean ± SEM. Cells from 10 CTL and 11 SCZ were included in the analysis. *P = or < 0.05. E Dot plots contrasting the percentage of cells expressing high levels of nestin in MF versus MDNCs from either CTL or SCZ. Nestin expression was measured via flow cytometry. For CTL, MF, 5.6 ± 2%; MDNCs, 14.7 ± 5.3%; P = 0.4 and for SCZ, MF, 6.3 ± 2.6%; MDNCs, 19.2 ± 2.5%; P = 0.01. Differences were assessed using the Mann–Whitney test. Data are given as mean ± SEM. Cells from 2 CTL and 4 SCZ were included in the analysis. One CTL was tested twice by duplicate. *P = or < 0.05. F Bar graphs contrasting several structural parameters at baseline between CTL, SCZ and MED. Structural parameters include: Longest primary neurite (LPN) (CTL, 91 ± 2.6 µm; SCZ, 93.5 ± 2.4 µm; P = 0.49, MED, 94.5 ± 2.6 µm; P = 0.36); longest secondary neurite (LSN) (CTL, 15.8 ± 0.7 µm; SCZ, 18.4 ± 0.6 µm; P = 0.02, MED, 18.1 ± 0.7 µm; P = 0.04); number of primary neurites (CTL, 4.3 ± 0.09; SCZ, 4.6 ± 0.08; P = 0.04, MED, 4.6 ± 0.09; P = 0.01); number of secondary neurites (CTL, 5.1 ± 0.5; SCZ, 6.2 ± 0.4; P = 0.17, MED, 6.2 ± 0.5; P = 0.19) and total number of neurites (CTL, 8.8 ± 0.6; SCZ, 10.2 ± 0.6; P = 0.11, MED, 10.3 ± 0.6; P = 0.13). To determine differences between groups, multilevel mixed models to account for correlations of repeated measures at subject level and sample level were used, followed by a two-sample t test. Data are given as mean ± SEM. MDNCs from 12 CTL and 13 SCZ (of which 11 are medicated “MED”) were included in the analysis. MDNCs traced for CTL n = 3933; SCZ n = 6144; and MED n = 5601. *P = or < 0.05, **P < 0.03. G Bar graphs contrasting several structural parameters on day 20 versus day 21 from CTL, SCZ and MED. Structural parameters studied were; longest primary neurite (LPN), longest secondary neurite (LSN), number of primary neurites, number of secondary neurites and total number of neurites. Two-sample t-tests was used to determine differences between CTL vs. SCZ and CTL vs. MED after a mixed model analysis was performed to account for correlations of repeated measures within subjects. Data are given as mean ± SEM. MDNCs from 7 CTL and 11 SCZ (of which 10 are medicated “MED”) were included in the analysis. MDNCs traced for LSN for CTL, day 20 n = 1090 and day 21 n = 1091; for all other structural parameters; CTL, day 20 n = 1189 and day 21 n = 1213; for LSN for SCZ, day 20 n = 2062 and day 21 n = 2152; for all other structural parameters day 20 n = 2193 and day 21 n = 2254; for LSN for MED, day 20 n = 1985 and day 21 n = 2018; for all other structural parameters day 20 n = 2114 and day 21 n = 2118. *P = or < 0.05, **P < 0.03.
Fig. 3
Fig. 3. Structural responses to colchicine and dopamine in MDNCs from CTL versus SCZ.
A Bar graphs contrasting the amount of pruning evidenced in MDNCs after an hour of culture under control conditions in cells from CTL, SCZ and MED. Structural parameters studied were; longest primary neurite (LPN), longest secondary neurite (LSN), number of primary neurites, number of secondary neurites and total number of neurites. Two-sample t tests was used to determine differences between CTL vs. SCZ and CTL vs. MED after a mixed model analysis was performed to account for correlations of repeated measures within subjects. Data are given as mean ± SEM. MDNCs from 8 CTL and 10 SCZ (of which 8 are medicated “MED”) were included in the analysis. MDNCs traced for LSN for CTL, n = 571; SCZ, n = 854; and MED, n = 667; for all other structural parameters; CTL, n = 656; SCZ, n = 976; and MED, n = 769. B Bar graphs contrasting the amount of pruning evidenced in MDNCs after an hour of incubation with colchicine 0.4 µM in cells from CTL, SCZ and MED. The same structural parameters as in (A) were studied. We performed linear regression analysis adjusting for baseline retraction (response under control conditions), differentiation efficiency, and structure at baseline in the models as covariates based on subject-level averaged data. Data are given as mean ± SEM. MDNCs from 3 CTL and 7 SCZ (of which 6 are medicated “MED”) were included in the analysis. MDNCs traced for LSN for CTL, n = 117; SCZ, n = 341; and MED, n = 327; for all other structural parameters; CTL, n = 191; SCZ, n = 405; and MED, n = 388. C Bar graphs contrasting the amount of pruning evidenced in MDNCs after an hour of incubation with colchicine 0.5 µM in cells from CTL, SCZ and MED. The same structural parameters and the same statistical analysis as in (A) were used. Data are given as mean ± SEM. MDNCs from 4 CTL and 9 SCZ (of which 8 are medicated “MED”) were included in the analysis. MDNCs traced for LSN for CTL, n = 267; SCZ, n = 565; and MED, n = 534; for all other structural parameters; CTL, n = 401; SCZ, n = 662; and MED, n = 627. D Bar graphs contrasting the amount of pruning evidenced in MDNCs after an hour of incubation with colchicine 0.75 µM in cells from CTL, SCZ and MED. The same structural parameters and the same statistical analysis as in (A) were used. Data are given as mean ± SEM. MDNCs from 3 CTL and 7 SCZ (of which 6 are medicated “MED”) were included in the analysis. MDNCs traced for LSN for CTL, n = 221; SCZ, n = 490; and MED, n = 472; for all other structural parameters; CTL, n = 297; SCZ, n = 621; and MED, n = 593. E Bar graphs contrasting the amount of pruning evidenced in MDNCs after an hour of incubation with dopamine 4mM in cells from CTL, SCZ and MED. The same structural parameters and the same statistical analysis as in (A) were used. Data are given as mean ± SEM. MDNCs from 6 CTL and 9 SCZ (of which 7 are medicated “MED”) were included in the analysis. MDNCs traced for LSN for CTL, n = 354; SCZ, n = 455; and MED, n = 414; for all other structural parameters; CTL, n = 477; SCZ, n = 622; and MED, n = 486. F Bar graphs contrasting the amount of pruning evidenced in MDNCs after an hour of incubation with dopamine 5 mM in cells from CTL, SCZ and MED. The same structural parameters and the same statistical analysis as in (A) were used. Data are given as mean ± SEM. MDNCs from 5 CTL and 7 SCZ (of which 6 are medicated “MED”) were included in the analysis. MDNCs traced for LSN for CTL, n = 228; SCZ, n = 316; and MED, n = 291; for all other structural parameters; CTL, n = 344; SCZ, n = 388; and MED, n = 352. *P = or < 0.05.
Fig. 4
Fig. 4. Dopamine 1 receptors in MDNCs from CTL and SCZ.
A Flow cytometric diagram showing expression of dopamine 1 receptors (D1R) in monocytes. Gray histograms represent control isotypic labeling. White histograms represent specific labeling. B Flow cytometric diagrams showing expression of D1R in MDNCs from a healthy control and a patient with SCZ. Gray histograms represent control isotypic labeling. White histograms represent specific labeling. C Dot plots contrasting expression of D1R in MDNCs from CTL vs. SCZ (CTL, 46.4 ± 6.7; SCZ, 31.3 ± 5.2; P = 0.15) and CTL vs. MED (CTL, 46.4 ± 6.7; MED, 24.2 ± 3.4; P = 0.03). D1R expression was measured via flow cytometry. Non-parametric Mann–Whitney test was used to make pairwise comparisons between groups. Data are given as mean ± SEM. Cells from 7 CTL, 7 SCZ and 5 MED were included in the analysis. *P = or < 0.05. D Bar graphs showing the effects of SCH-23390, a D1R antagonist, in dopamine-elicited pruning in MDNCs. Dopamine was used at 4 mM. For LPN, dopamine, 63.5 ± 2.2%; SCH, 54.7 ± 2.8%; P = 0.0093; LSN, dopamine, 78.9 ± 4.0%; SCH, 87.3 ± 2.3%; P = 0.93; number of secondary neurites, dopamine, 3.6 ± 0.21; SCH, 2.8 ± 0.21; P = 0.08 and total number of neurites, dopamine, 4.0 ± 0.24; SCH, 3.1 ± 0.22; P = 0.08. The non-parametric Mann–Whitney test was used to make pairwise comparisons between groups. Data are given as mean ± SEM. MDNCs from three individuals were included in the analysis. One individual was an unmedicated patient and one healthy subject was tested by duplicate. MDNCs traced for LSN treated with dopamine n = 200; and with SCH-23390 + dopamine, n = 117; for all other structural parameters; treated with dopamine n = 221; and with SCH-23390 + dopamine, n = 125. **P = 0.009.
Fig. 5
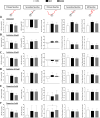
Fig. 5. Haloperidol effects on the structure and D1R expression of MDNCs.
A Bar graphs contrasting the differentiation percentage between cells treated with haloperidol (HAL), vehicle (VEH) or under control conditions (CTL). For CTL, 6.2 ± 0.58%; VEH, 7.5 ± 0.93%; HAL, 6.8 ± 0.65%; P = 0.69. The Kruskal–Wallis Test was used to make comparisons between groups. Data are given as mean ± SEM. Cells from 5 healthy subjects were included in the analysis. Cells characterized for CTL, n = 8048; VEH, n = 7152; HAL, n = 9300. B Bar graphs contrasting the structure of MDNCs at baseline after treatment from day 4 to 7 of the transdifferentiation process with haloperidol, vehicle or cells under control conditions. Structural parameters studied were: longest primary neurite (LPN), longest secondary neurite (LSN), number of primary neurites, number of secondary neurites and total number of neurites. The Kruskal–Wallis Test was used to make comparisons between groups. Data are given as mean ± SEM. Cells from 4 healthy subjects were included in the analysis. MDNCs traced for LSN for CTL, n = 247; VEH, n = 278; HAL, n = 305; for all other structural parameters; CTL, n = 339; VEH, n = 382; HAL, n = 431. C Bar graphs contrasting the amount of pruning evidenced in MDNCs after an hour of incubation on cells treated from day 4 to 7 of the transdifferentiation process with haloperidol, vehicle or cells under control conditions. The same structural parameter as in (B) were assessed. The Kruskal-Wallis Test was used to make comparisons between groups. Data are given as mean ± SEM. Cells from 3 healthy subjects were included in the analysis. MDNCs traced for LSN for CTL, n = 64; VEH, n = 85; HAL, n = 124; for all other structural parameters; CTL, n = 98; VEH, n = 113; HAL, n = 189. D Bar graphs contrasting the amount of pruning evidenced in MDNCs after an hour of incubation with dopamine 5 mM in cells treated from day 4 to 7 of the transdifferentiation process with haloperidol, vehicle or cells under control conditions. The same structural parameter as in (B) were assessed. The Kruskal–Wallis Test was used to make comparisons between groups. Data are given as mean ± SEM. Cells from 2 healthy subjects were included in the analysis. MDNCs traced for LSN for CTL, n = 28; VEH, n = 23; HAL, n = 37; for all other structural parameters; CTL, n = 57; VEH, n = 68; HAL, n = 81. E Dot plots contrasting expression of D1R in MDNCs after treatment from day 4 to 7 of the transdifferentiation process with HAL, VEH or cells under CTL conditions. For CTL, 25 ± 10.3%; VEH, 27.2 ± 9.8%; HAL, 27.9 ± 8.8%; P = 0.87. D1R expression was measured via flow cytometry. The Kruskal–Wallis Test was used to make comparisons between groups. Data are given as mean ± SEM. Cells from 5 healthy subjects were included in the analysis.

Similar articles

Cited by

References

    1. Insel TR. Rethinking schizophrenia. Nature. 2010;468:187–93. doi: 10.1038/nature09552. - DOI - PubMed
    1. Wright IC, Rabe-Hesketh S, Woodruff PW, David AS, Murray RM, Bullmore ET. Meta-analysis of regional brain volumes in schizophrenia. Am J Psychiatry. 2000;157:16–25. doi: 10.1176/ajp.157.1.16. - DOI - PubMed
    1. Rimol LM, Hartberg CB, Nesvåg R, Fennema-Notestine C, Hagler DJ, Pung CJ, et al. Cortical thickness and subcortical volumes in schizophrenia and bipolar disorder. Biol Psychiatry. 2010;68:41–50. doi: 10.1016/j.biopsych.2010.03.036. - DOI - PubMed
    1. Selemon LD, Goldman-Rakic PS. The reduced neuropil hypothesis: a circuit based model of schizophrenia. Biol Psychiatry. 1999;45:17–25. doi: 10.1016/S0006-3223(98)00281-9. - DOI - PubMed
    1. Selemon LD, Rajkowska G. Cellular pathology in the dorsolateral prefrontal cortex distinguishes schizophrenia from bipolar disorder. Curr Mol Med. 2003;3:427–36. doi: 10.2174/1566524033479663. - DOI - PubMed

Publication types