

Types and functions of heterogeneity in mycobacteria
- PMID: 35365812
- PMCID: PMC9681535
- DOI: 10.1038/s41579-022-00721-0
Types and functions of heterogeneity in mycobacteria
Abstract
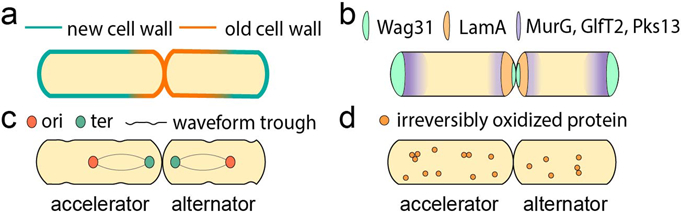
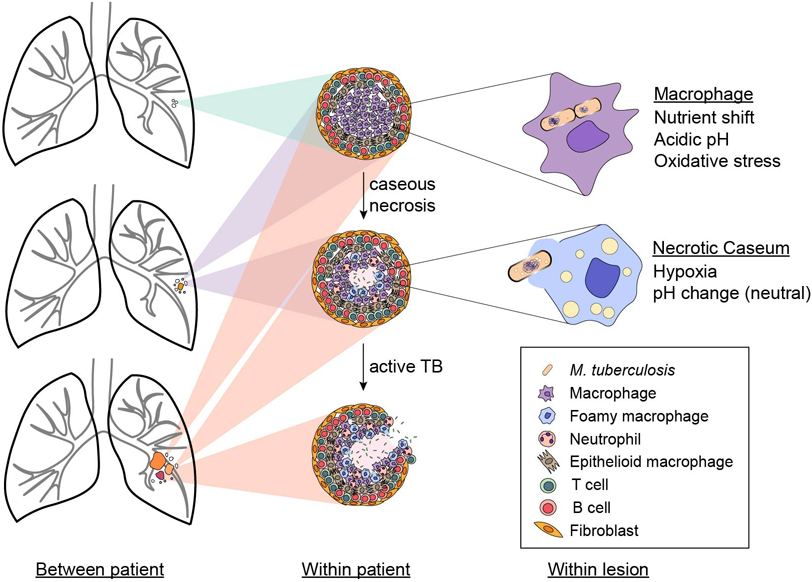
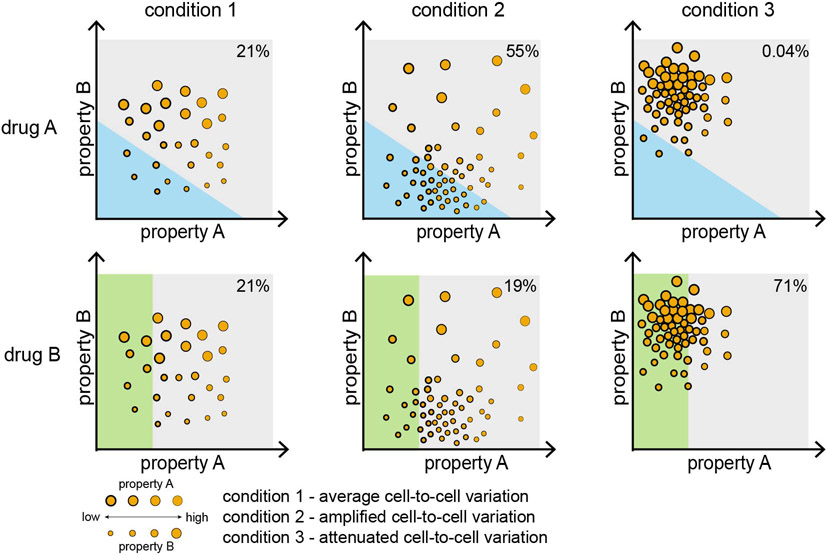
The remarkable ability of Mycobacterium tuberculosis to survive attacks from the host immune response and drug treatment is due to the resilience of a few bacilli rather than a result of survival of the entire population. Maintenance of mycobacterial subpopulations with distinct phenotypic characteristics is key for survival in the face of dynamic and variable stressors encountered during infection. Mycobacterial populations develop a wide range of phenotypes through an innate asymmetric growth pattern and adaptation to fluctuating microenvironments during infection that point to heterogeneity being a vital survival strategy. In this Review, we describe different types of mycobacterial heterogeneity and discuss how heterogeneity is generated and regulated in response to environmental cues. We discuss how this heterogeneity may have a key role in recording memory of their environment at both the single-cell level and the population level to give mycobacterial populations plasticity to withstand complex stressors.
© 2022. Springer Nature Limited.
Figures
Similar articles
-
[Frontier of mycobacterium research--host vs. mycobacterium].Kekkaku. 2005 Sep;80(9):613-29. Kekkaku. 2005. PMID: 16245793 Japanese.
-
Phenotypic Heterogeneity in Mycobacterium tuberculosis.Microbiol Spectr. 2016 Nov;4(6). doi: 10.1128/microbiolspec.TBTB2-0021-2016. Microbiol Spectr. 2016. PMID: 27837741 Review.
-
Macrophage heterogeneity and plasticity in tuberculosis.J Leukoc Biol. 2019 Aug;106(2):275-282. doi: 10.1002/JLB.MR0318-095RR. Epub 2019 Apr 2. J Leukoc Biol. 2019. PMID: 30938876 Review.
-
Bioenergetic Heterogeneity in Mycobacterium tuberculosis Residing in Different Subcellular Niches.mBio. 2021 Jun 29;12(3):e0108821. doi: 10.1128/mBio.01088-21. Epub 2021 Jun 1. mBio. 2021. PMID: 34060333 Free PMC article.
-
Deletion of a mycobacterial divisome factor collapses single-cell phenotypic heterogeneity.Nature. 2017 Jun 1;546(7656):153-157. doi: 10.1038/nature22361. Epub 2017 May 31. Nature. 2017. PMID: 28569798 Free PMC article.
Cited by
-
Spatial segregation and aging of metabolic processes underlie phenotypic heterogeneity in mycobacteria.bioRxiv [Preprint]. 2023 Dec 2:2023.12.01.569614. doi: 10.1101/2023.12.01.569614. bioRxiv. 2023. PMID: 38076906 Free PMC article. Preprint.
-
PET imaging of mycobacterial infection: transforming the pipeline for tuberculosis drug development.Npj Imaging. 2025 May 28;3(1):22. doi: 10.1038/s44303-025-00082-2. Npj Imaging. 2025. PMID: 40604239 Review.
-
Assessing the propensity of TB clinical isolates to form viable but non-replicating subpopulations.Sci Rep. 2024 Nov 12;14(1):27686. doi: 10.1038/s41598-024-79389-w. Sci Rep. 2024. PMID: 39532967 Free PMC article.
-
Bigger problems from smaller colonies: emergence of antibiotic-tolerant small colony variants of Mycobacterium avium complex in MAC-pulmonary disease patients.Ann Clin Microbiol Antimicrob. 2024 Mar 18;23(1):25. doi: 10.1186/s12941-024-00683-6. Ann Clin Microbiol Antimicrob. 2024. PMID: 38500139 Free PMC article.
-
Proteomic characterization of Mycobacterium tuberculosis subjected to carbon starvation.mSystems. 2025 May 20;10(5):e0153024. doi: 10.1128/msystems.01530-24. Epub 2025 Apr 15. mSystems. 2025. PMID: 40231840 Free PMC article.
References
-
- WHO. Global Tuberculosis Report. vol. 148 (2020).
-
-
Aldridge BB et al. Asymmetry and aging of mycobacterial cells lead to variable growth and antibiotic susceptibility. Science 529, 100–104 (2012).
This study shows a asymmetric mycobacterial growth and division and finds that sister cells show differential drug susceptibility.
-
-
-
Singh B et al. Asymmetric growth and division in Mycobacterium spp.: Compensatory mechanisms for non-medial septa. Mol. Microbiol (2013) doi:10.1111/mmi.12169.
This study presents that Mycobacterium marinum and Mycobacteirum smegmatis cells often form division sites at off-centre, which may be compensated by post-septal DNA transport and unequal polar growth.
-
Publication types
MeSH terms
Grants and funding
LinkOut - more resources
Full Text Sources
