. 2021 May 17;28(2):224-237.
doi: 10.3390/pathophysiology28020015.

Chitosan from Crabs (Scylla serrata) Represses Hyperlipidemia-Induced Hepato-Renal Dysfunctions in Rats: Modulation of CD43 and p53 Expression

Affiliations

Chitosan from Crabs (Scylla serrata) Represses Hyperlipidemia-Induced Hepato-Renal Dysfunctions in Rats: Modulation of CD43 and p53 Expression

Regina Ngozi Ugbaja et al. Pathophysiology. .

Abstract

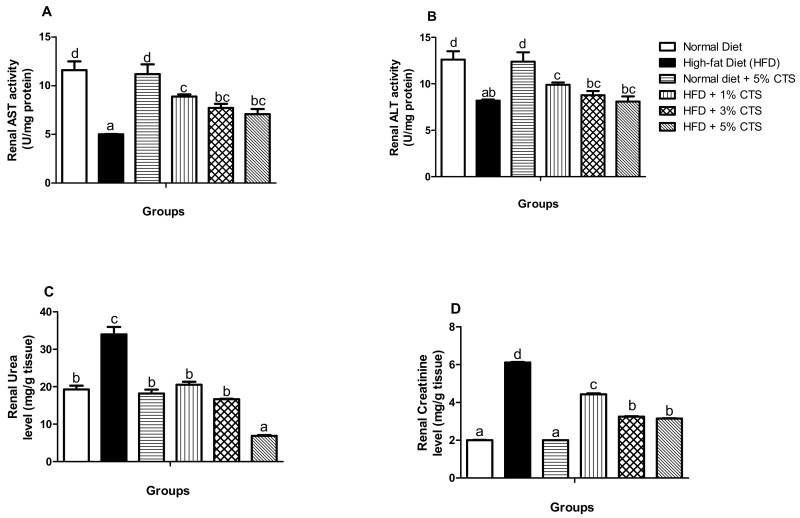
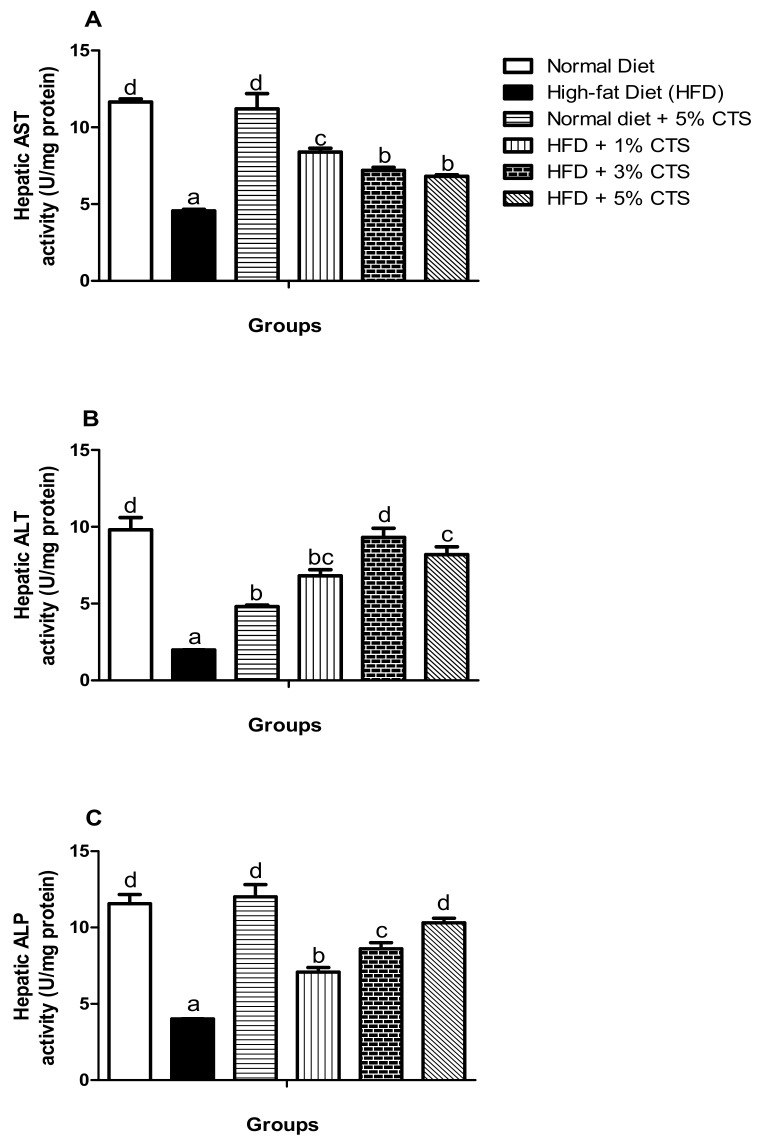
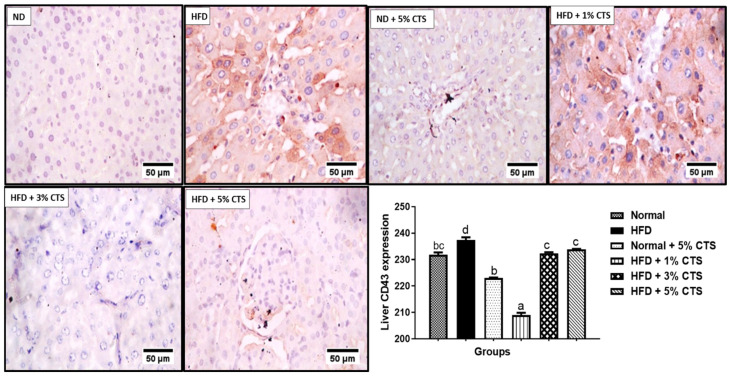
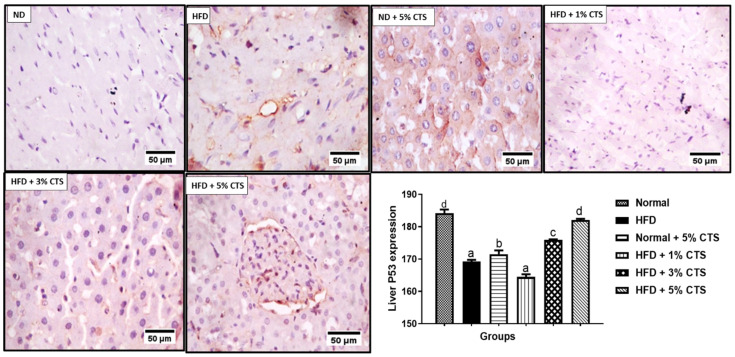
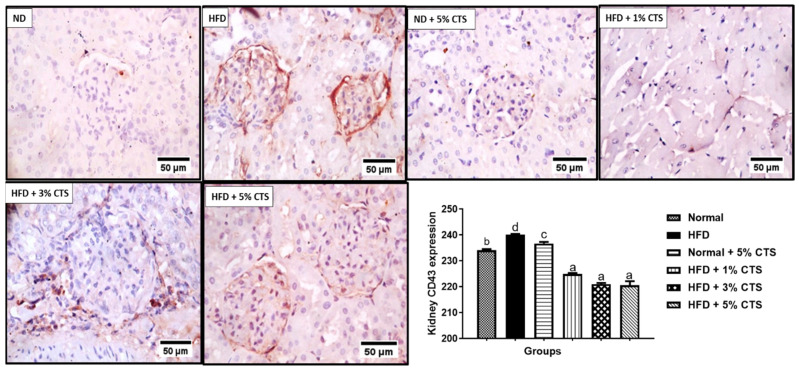
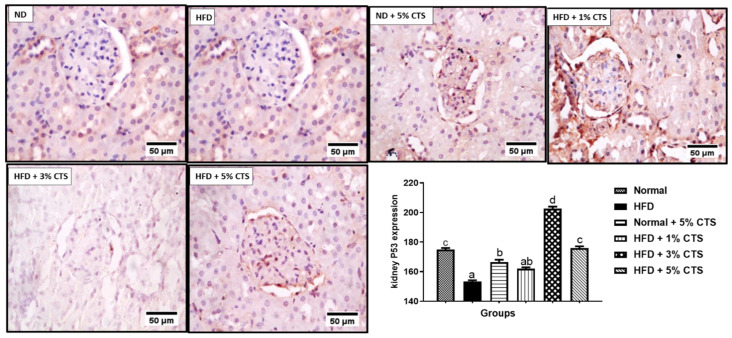
Hepato-renal dysfunctions associated with hyperlipidemia necessitates a continuous search for natural remedies. This study thus evaluated the effect of dietary chitosan on diet-induced hyperlipidemia in rats. A total of 30 male Wistar rats (90 ± 10) g were randomly allotted into six (6) groups (n = 5): Normal diet, High-fat diet (HFD), and Normal diet + 5% chitosan. The three other groups received HFD, supplemented with 1%, 3%, and 5% of chitosan. The feeding lasted for 6 weeks, after which the rats were sacrificed. The liver and kidneys were harvested for analyses. Hepatic alanine aminotransferase (ALT), aspartate aminotransferase (AST), alkaline phosphatase (ALP) activity, and renal biomarkers (ALT, AST, urea, and creatinine) were assayed spectrophotometrically. Additionally, expression of hepatic and renal CD43 and p53 was estimated immunohistochemically. The HFD group had elevated bodyweight compared to normal which was reversed in the chitosan-supplemented groups. Hyperlipidemia caused a significant (p < 0.05) decrease in the hepatic (AST, ALT, and ALP) and renal (AST and ALT) activities, while renal urea and creatinine increased. Furthermore, the HFD group showed an elevated level of hepatic and renal CD43 while p53 expression decreased. However, groups supplemented with chitosan showed improved hepatic and renal biomarkers, as well as corrected the aberrations in the expressions of p53 and CD43. Conclusively, dietary chitosan inclusion in the diet (between 3% and 5%) could effectively improve kidney and liver functionality via abatement of inflammatory responses.

Keywords: chitosan; functional indices; high-fat diet; hyperlipidemia; p53 and CD43 genes.


Conflict of interest statement

The authors declare no conflict of interest.

Figures

Figure 1
Figure 1
Effects of chitosan supplementation on renal biomarkers of High-fat diet (HFD)-fed rats. Values are expressed as mean ± SEM (n = 5). Bars with distinct letters are statistically (p < 0.05) different. a–renal AST activity; b–renal ALT activity; c–enal urea level; d–renal creatinine. AST–Aspartate aminotransferase; ALT–Alanine aminotransferase; CTS–chitosan.
Figure 2
Figure 2
Effects of chitosan supplementation on hepatic biomarkers of High-fat diet (HFD)-fed rats. Values are expressed as mean ± SEM (n = 5). Bars with distinct letters are statistically (p < 0.05) different. a–Hepatic AST activity; b–Hepatic ALT activity; c–Hepatic ALP. AST–Aspartate aminotransferase; ALT–Alanine aminotransferase; ALP–alkaline phosphatase; CTS–chitosan.
Figure 3
Figure 3
Photomicrograph of immunohistochemical expression of hepatic CD43. Values are expressed as mean ± SEM (n = 3). Bars with distinct letters are statistically (p < 0.05) different. ND–normal diet; HFD–high-fat diet; CTS–chitosan.
Figure 4
Figure 4
Photomicrograph of immunohistochemical expression of hepatic p53. Values are expressed as mean ± SEM (n = 3). Bars with distinct letters are statistically (p < 0.05) different. ND–normal diet; HFD–high-fat diet; CTS–chitosan.
Figure 5
Figure 5
Photomicrograph of immune-histochemical expression of renal CD43. Values are expressed as mean ± SEM (n = 3). Bars with distinct letters are statistically (p < 0.05) different. ND–normal diet; HFD–high-fat diet; CTS–chitosan.
Figure 6
Figure 6
Photomicrograph of immune-histochemical expression of renal p53. Values are expressed as mean ± SEM (n = 3). Bars with distinct letters are statistically (p < 0.05) different. ND- normal diet; HFD- high-fat diet; CTS- chitosan.

Similar articles

Cited by

References

    1. Ahmad S., Beg Z.H. Hypolipidemic and antioxidant activities of thymoquinone and limonene in atherogenic suspension fed rats. Food Chem. 2013;138:1116–1124. doi: 10.1016/j.foodchem.2012.11.109. - DOI - PubMed
    1. Navar-Boggan A.M., Peterson E.D., D’Agostino S.R.B., Neely B., Sniderman A.D., Pencina M.J. Hyperlipidemia in Early Adulthood Increases Long-Term Risk of Coronary Heart Disease. Circulation. 2015;131:451–458. doi: 10.1161/CIRCULATIONAHA.114.012477. - DOI - PMC - PubMed
    1. Ugbaja R.N., Akinloye D.I., James A.S., Ugwor E.I., Kareem S.E., David G., Abolade S.O., Oyebade O.E. Crab derived dietary chitosan mollifies hyperlipidemia- induced oxidative stress and histopathological Derangements in male albino rats. Obes. Med. 2020;20:100300. doi: 10.1016/j.obmed.2020.100300. - DOI
    1. Vaziri N.D. Dyslipidemia of chronic renal failure: The nature, mechanisms, and potential consequences. Am. J. Physiol. Physiol. 2006;290:F262–F272. doi: 10.1152/ajprenal.00099.2005. - DOI - PubMed
    1. Kaysen G.A. Hyperlipidemia of Chronic Renal Failure. Blood Purif. 1994;12:60–67. doi: 10.1159/000170146. - DOI - PubMed