. 2021 Mar 7;28(1):116-154.
doi: 10.3390/pathophysiology28010010.

Mathematical Modeling of Ion Quantum Tunneling Reveals Novel Properties of Voltage-Gated Channels and Quantum Aspects of Their Pathophysiology in Excitability-Related Disorders

Affiliations

Mathematical Modeling of Ion Quantum Tunneling Reveals Novel Properties of Voltage-Gated Channels and Quantum Aspects of Their Pathophysiology in Excitability-Related Disorders

Abdallah Barjas Qaswal et al. Pathophysiology. .

Abstract

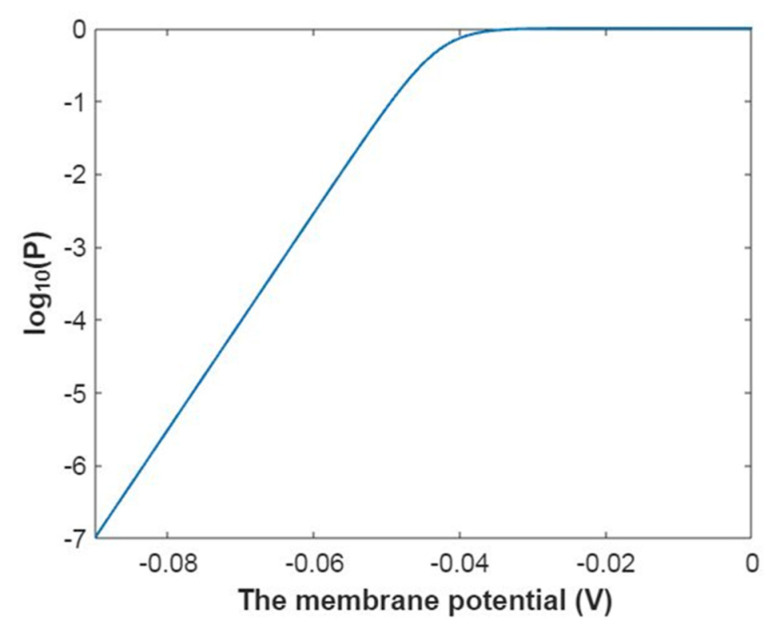
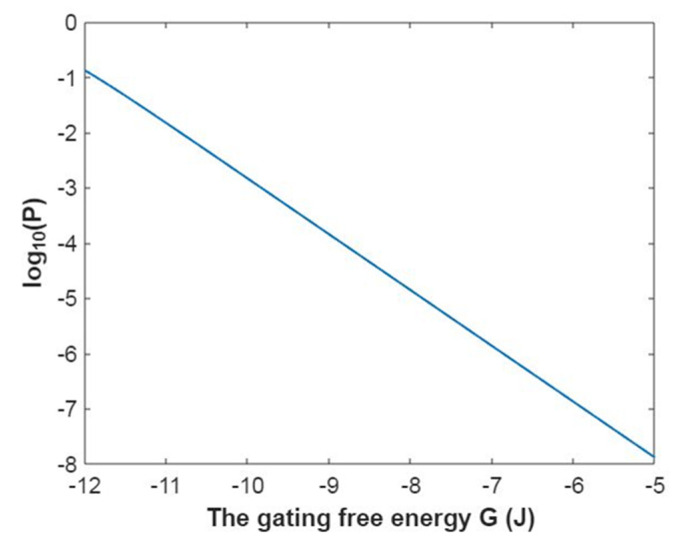
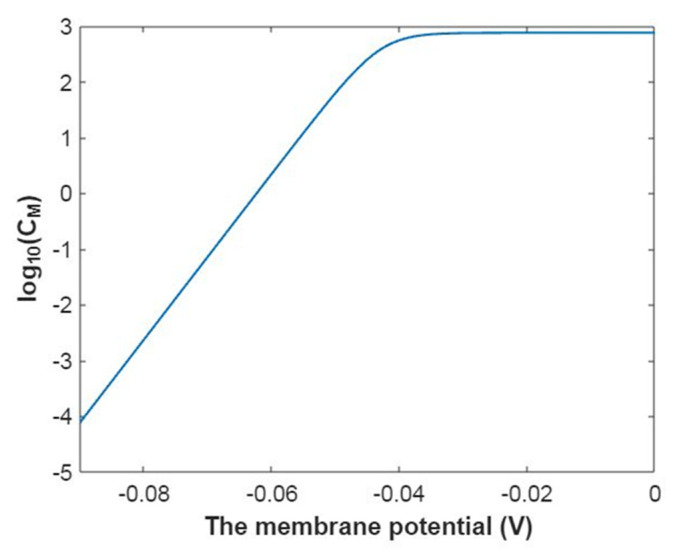
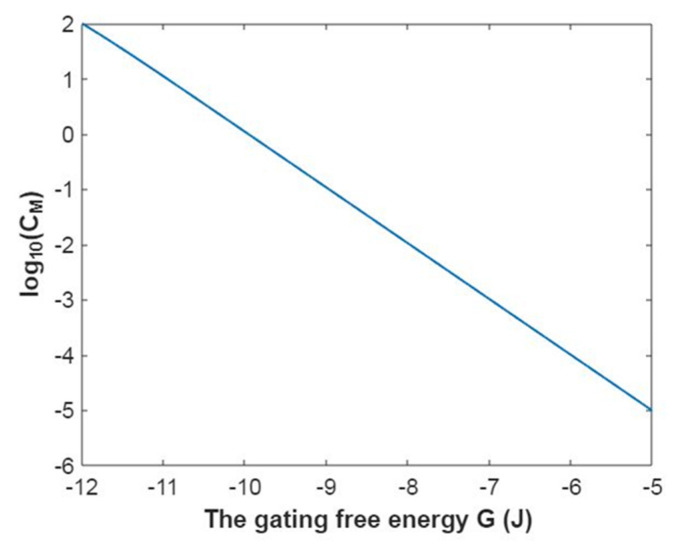
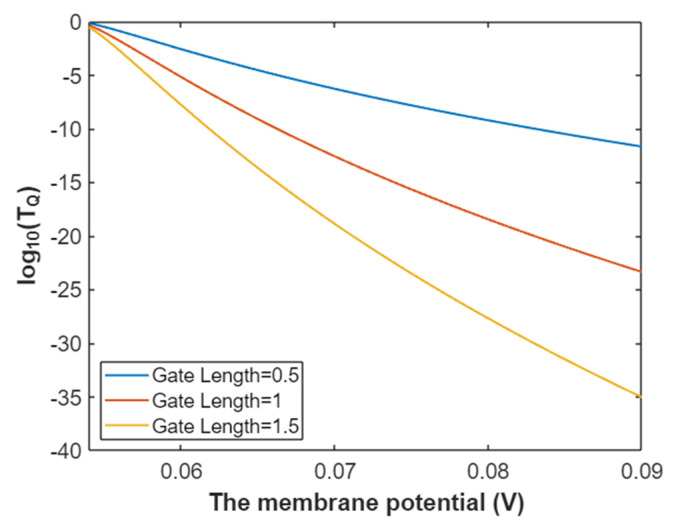
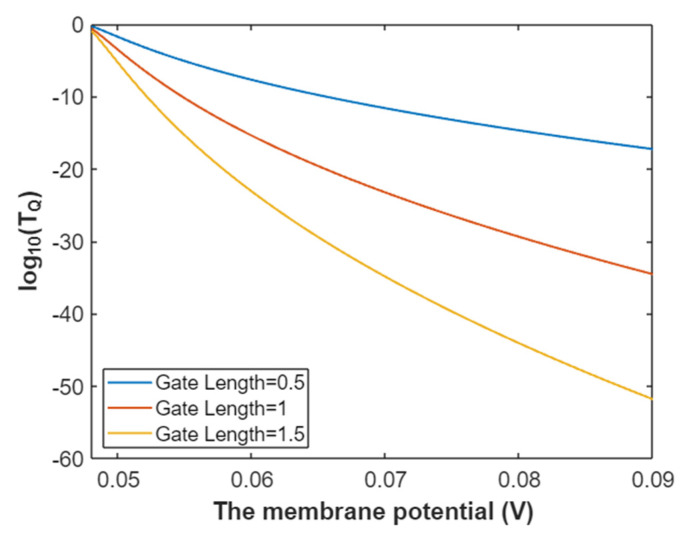
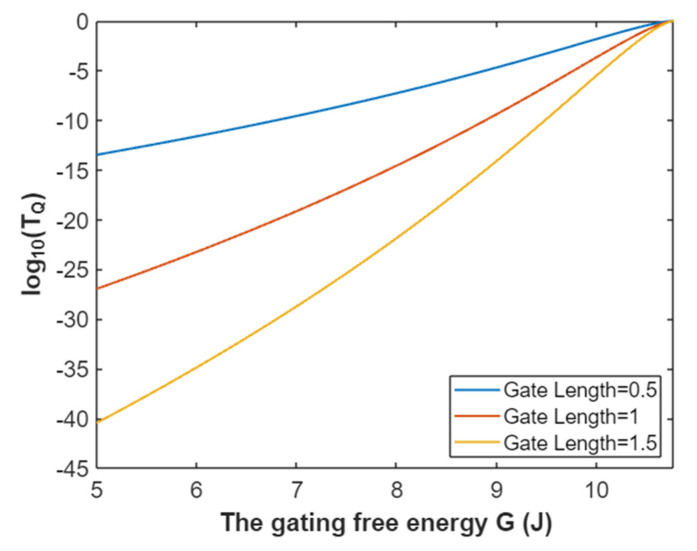
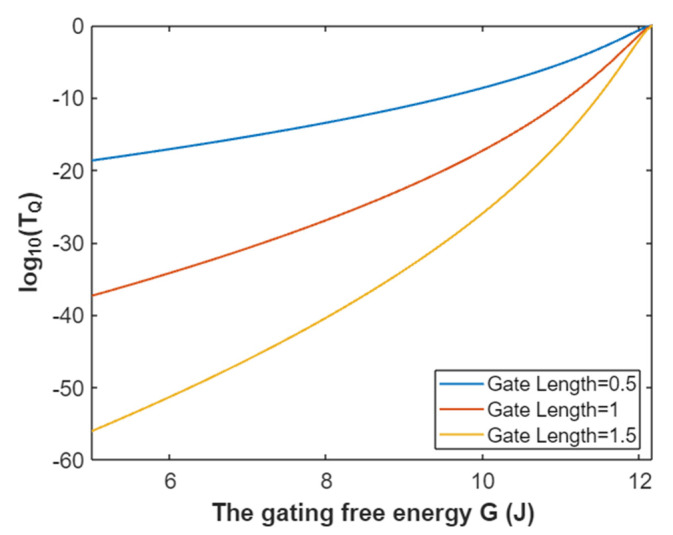
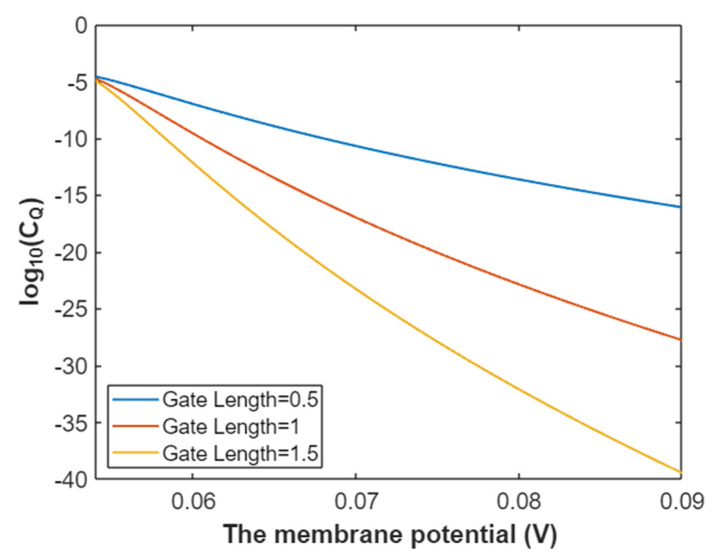
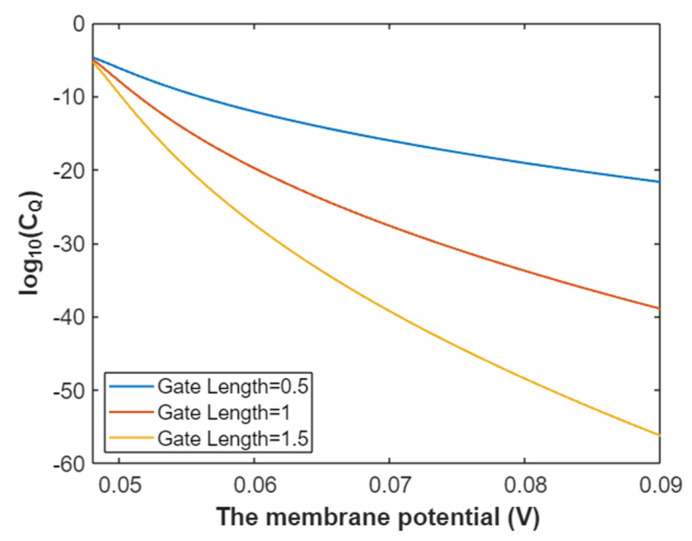
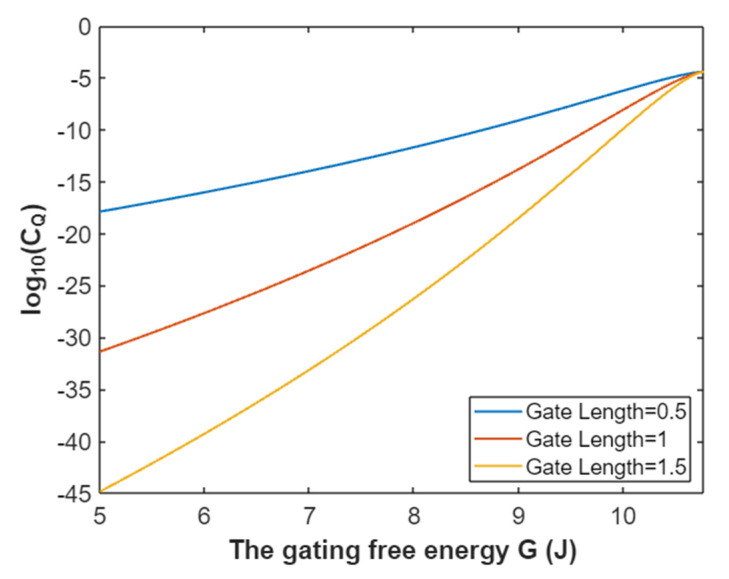
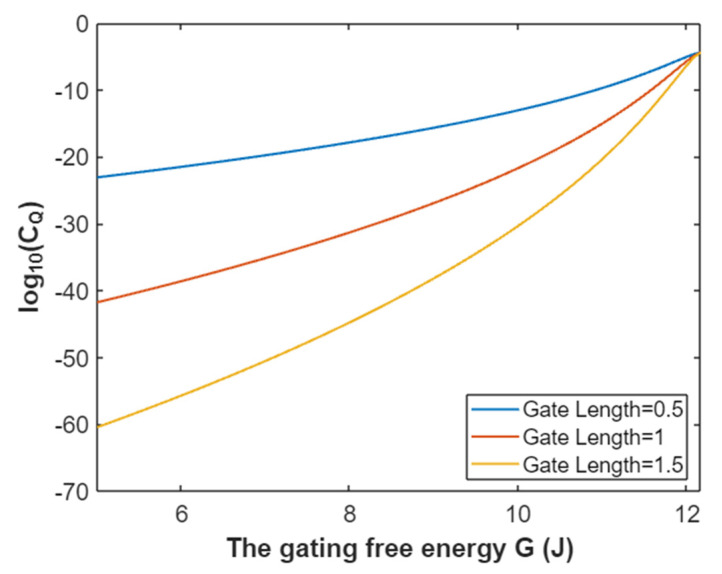
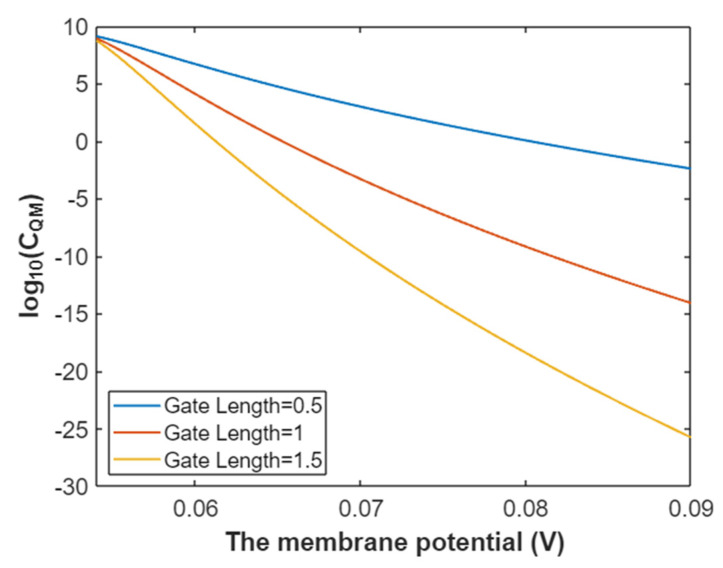
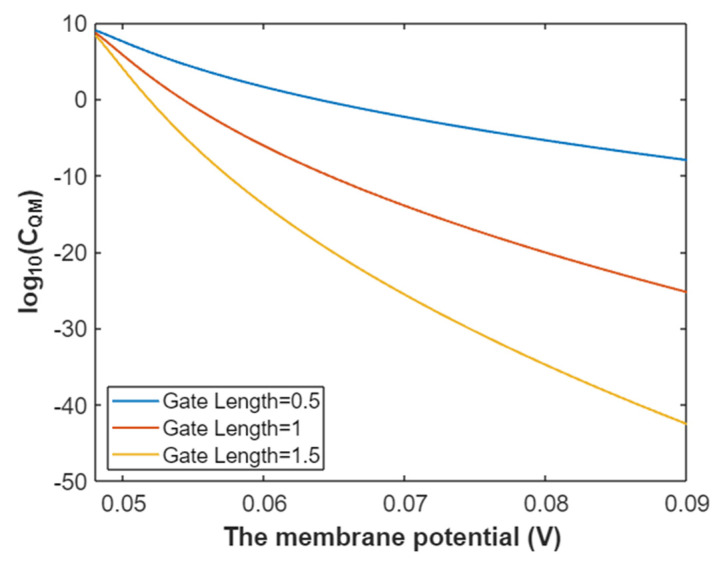
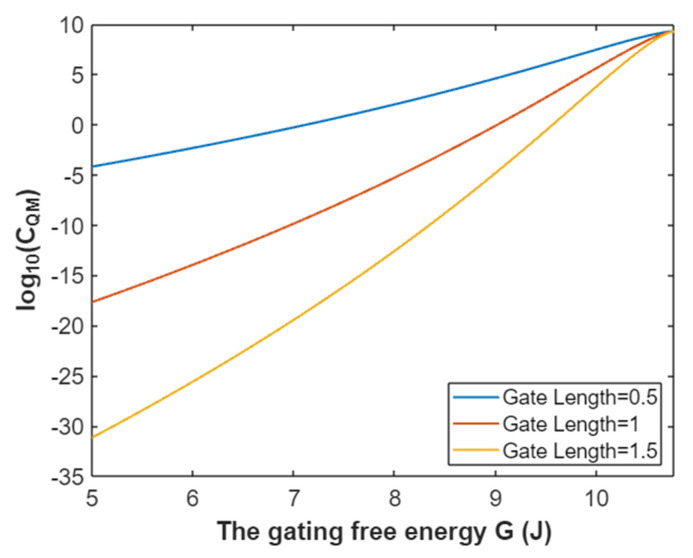
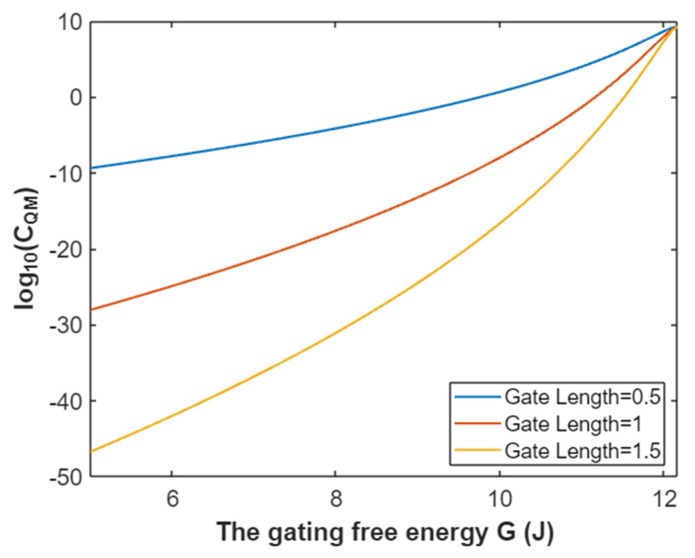
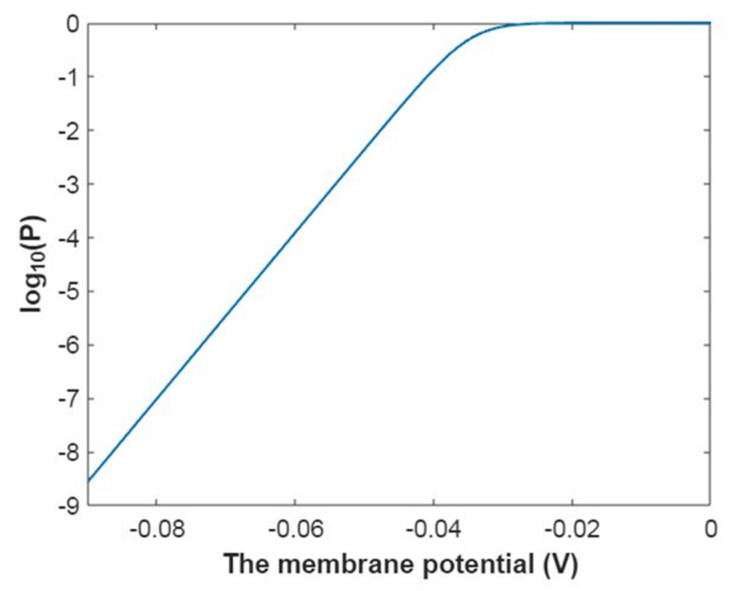
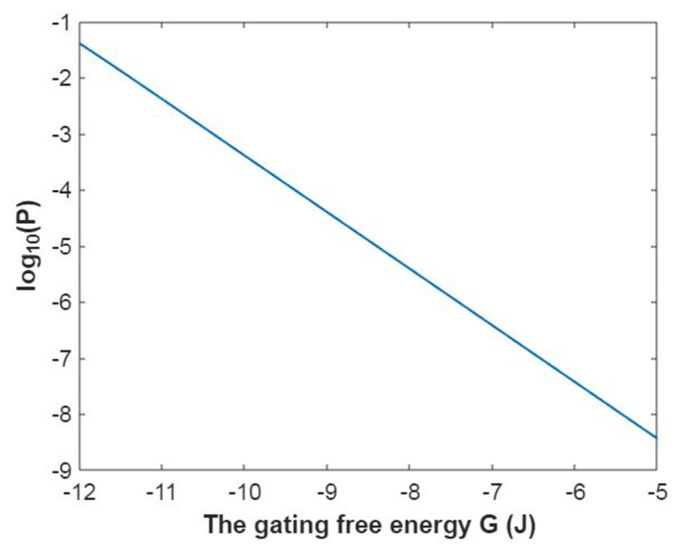
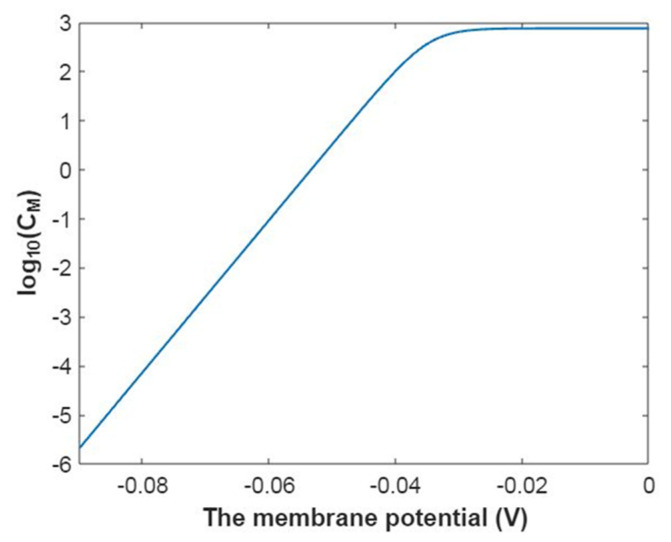
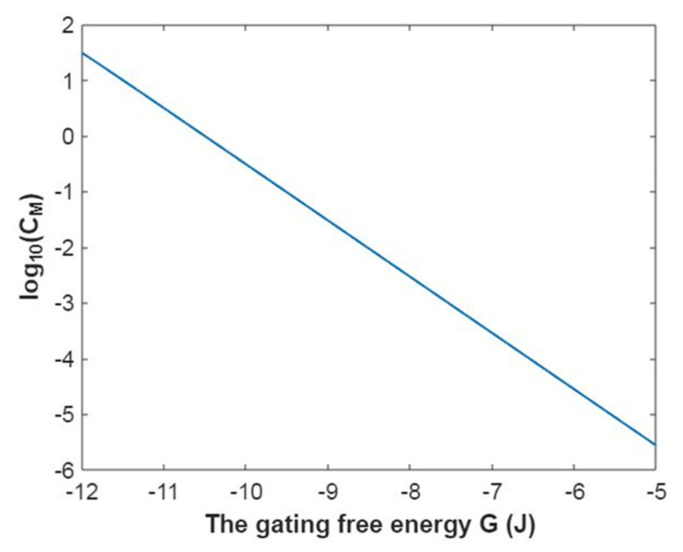
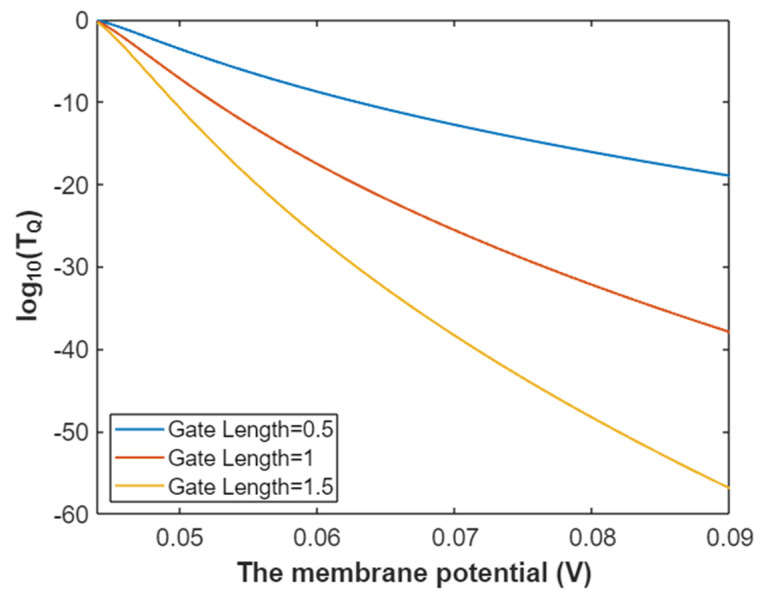
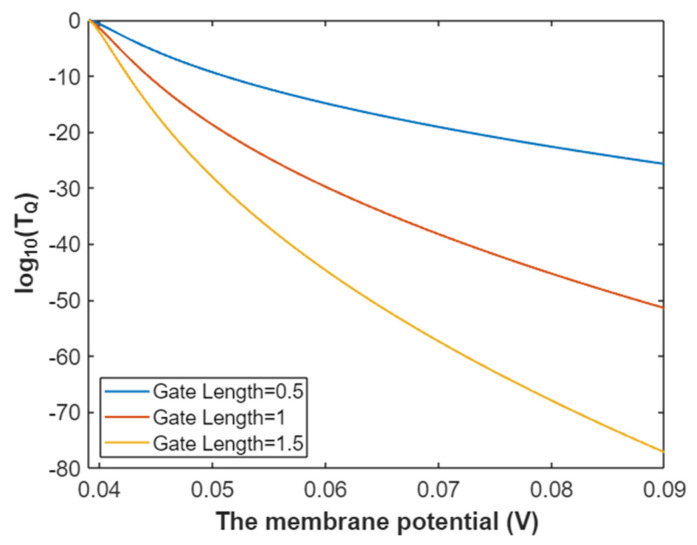
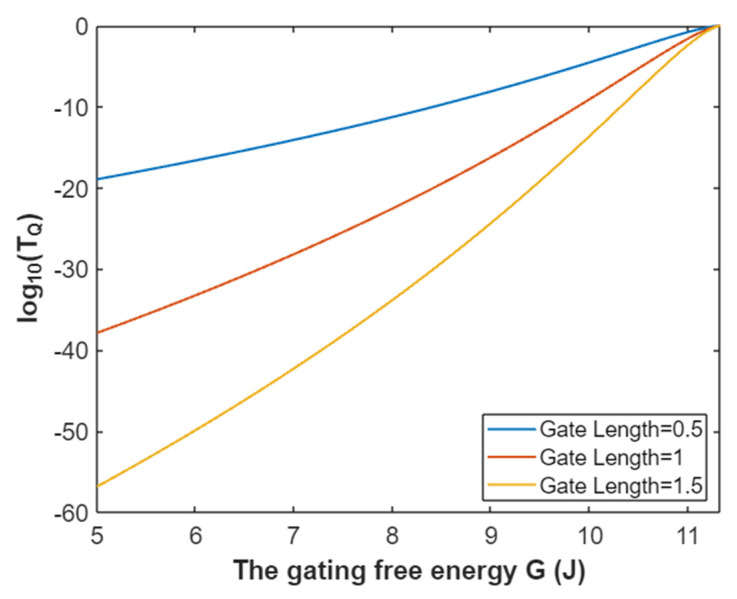
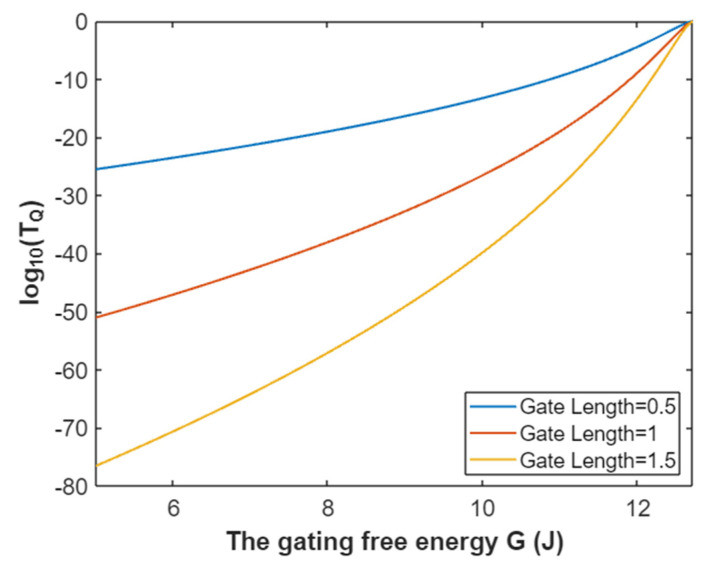
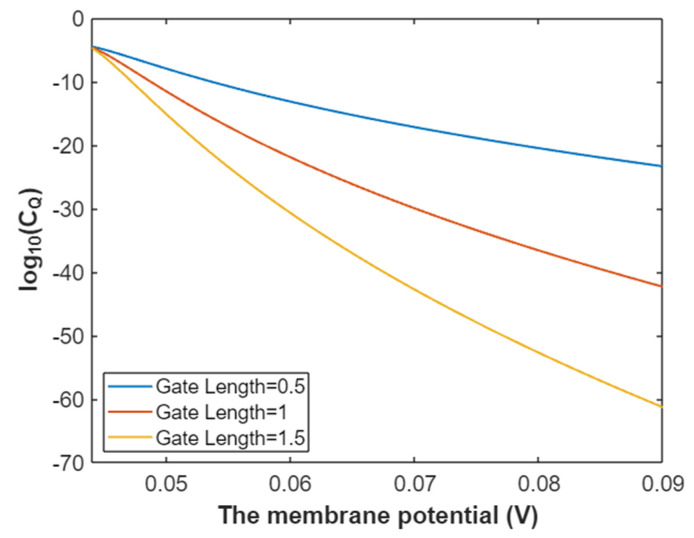
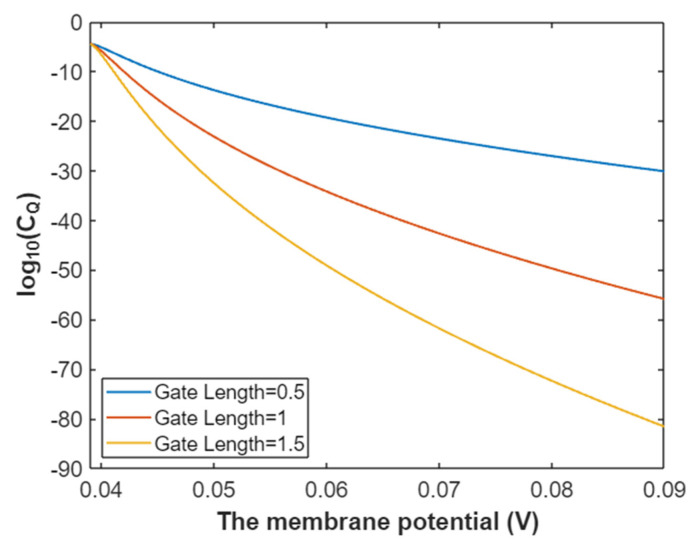
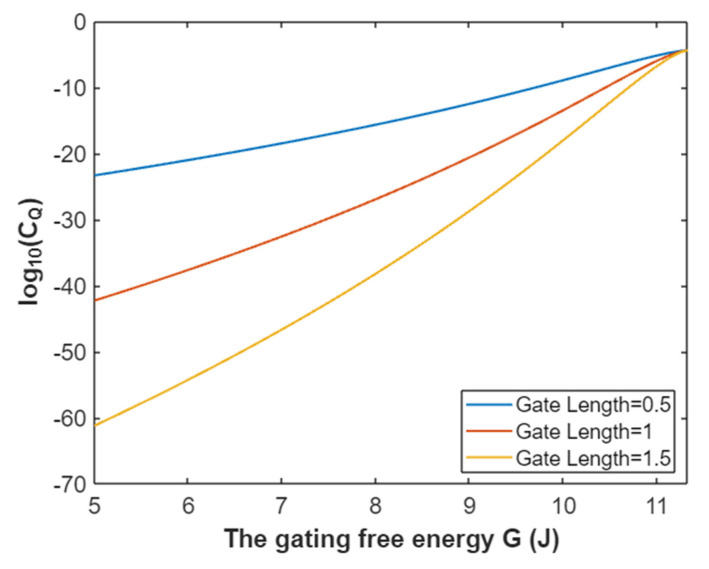
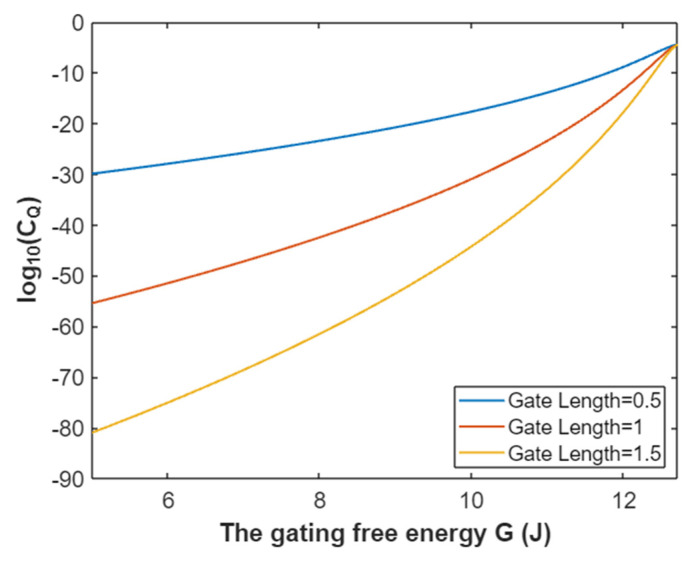
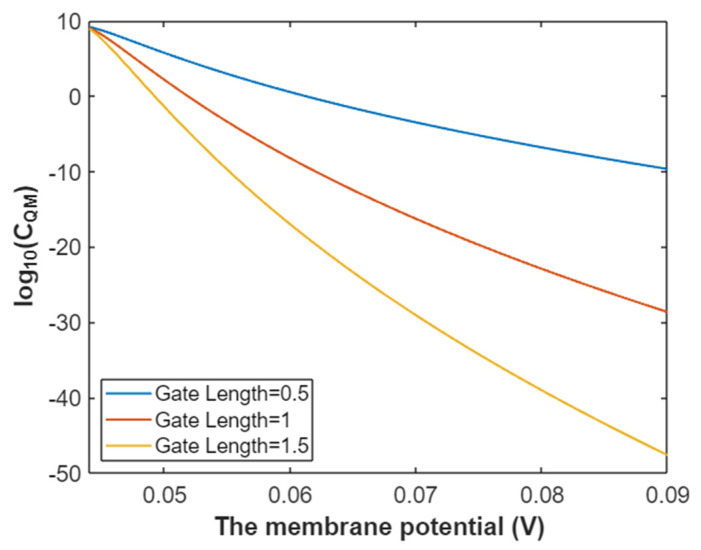
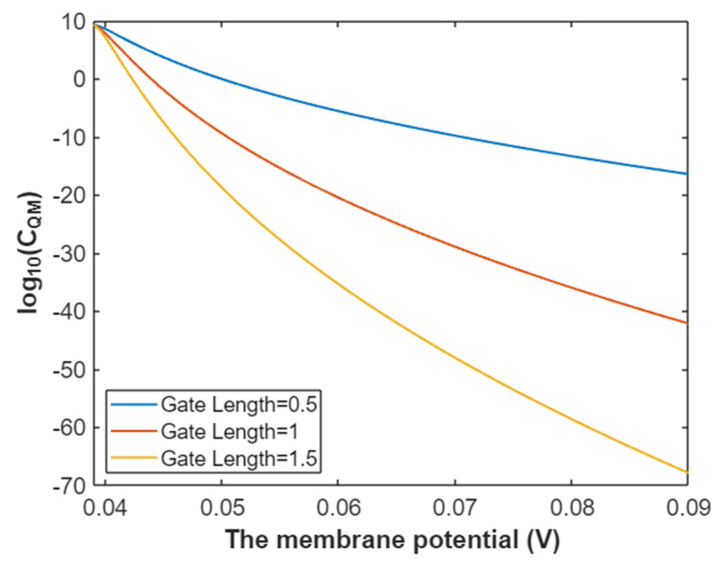
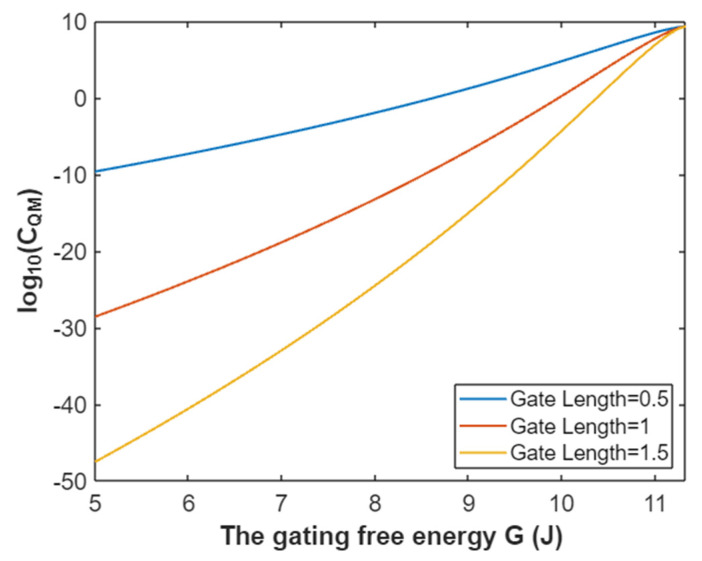
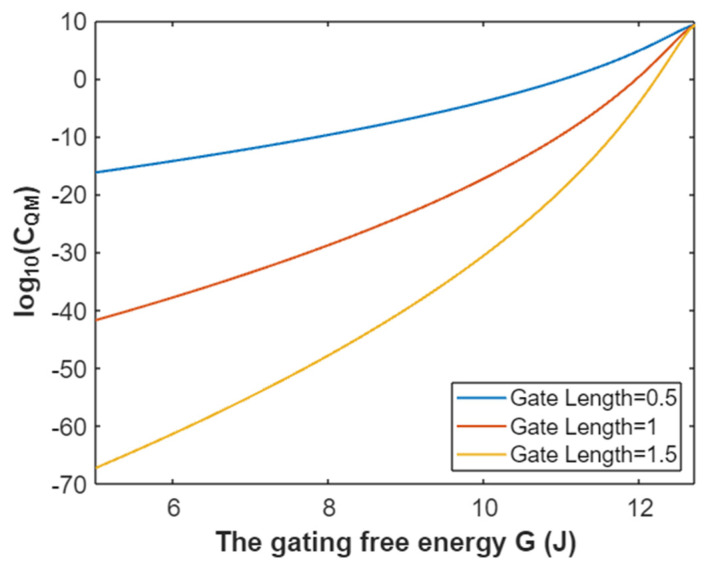
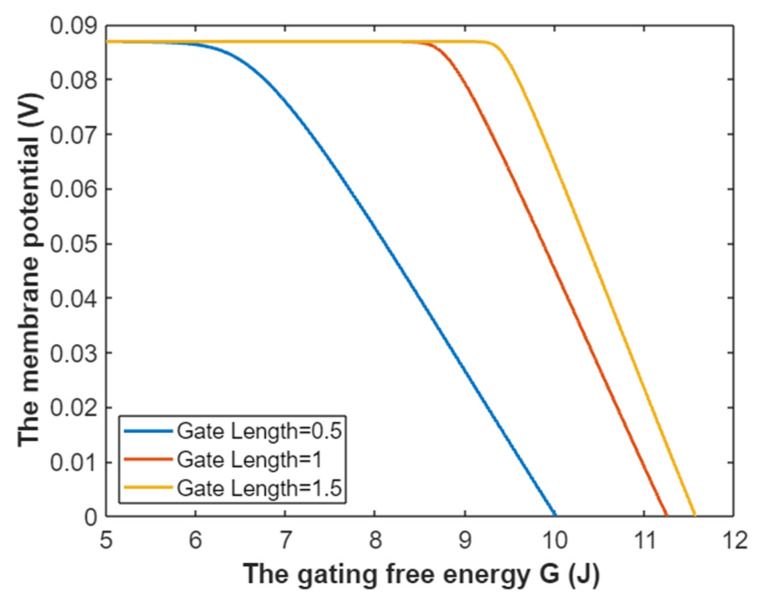
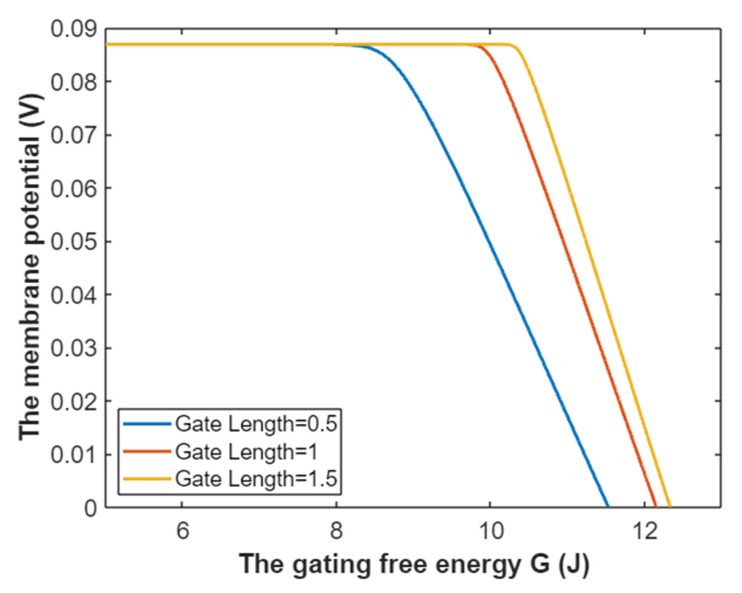
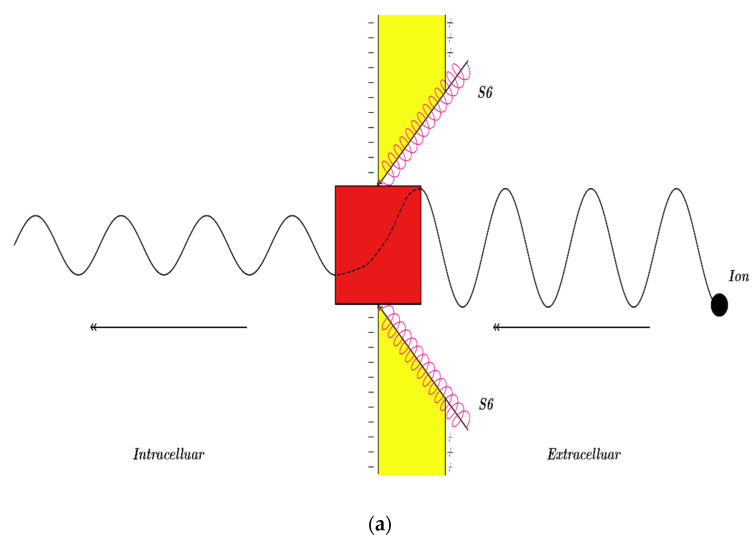
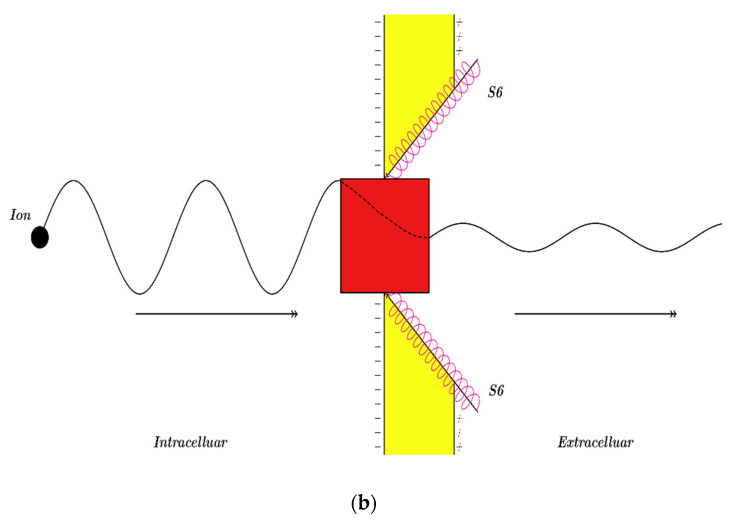
Voltage-gated channels are crucial in action potential initiation and propagation and there are many diseases and disorders related to them. Additionally, the classical mechanics are the main mechanics used to describe the function of the voltage-gated channels and their related abnormalities. However, the quantum mechanics should be considered to unravel new aspects in the voltage-gated channels and resolve the problems and challenges that classical mechanics cannot solve. In the present study, the aim is to mathematically show that quantum mechanics can exhibit a powerful tendency to unveil novel electrical features in voltage-gated channels and be used as a promising tool to solve the problems and challenges in the pathophysiology of excitability-related diseases. The model of quantum tunneling of ions through the intracellular hydrophobic gate is used to evaluate the influence of membrane potential and gating free energy on the tunneling probability, single channel conductance, and quantum membrane conductance. This evaluation is mainly based on graphing the mathematical relationships between these variables. The obtained mathematical graphs showed that ions can achieve significant quantum membrane conductance, which can affect the resting membrane potential and the excitability of cells. In the present work, quantum mechanics reveals original electrical properties associated with voltage-gated channels and introduces new insights and implications into the pathophysiology of excitability- related disorders. In addition, the present work sets a mathematical and theoretical framework that can be utilized to conduct experimental studies in order to explore the quantum aspects of voltage-gated channels and the quantum bioelectrical property of biological membranes.

Keywords: arrhythmias; epilepsy; pain; potassium ions; quantum biology; quantum biophysics; quantum tunneling; sodium ions; voltage-gated channel.


Conflict of interest statement

The author declares no conflict of interest.

Figures

Figure 1
Figure 1
The relationship between the membrane potential and the common logarithm of the open probability of sodium channels at G = −6.33 J and over membrane potential range from −0.09 V to 0 V.
Figure 2
Figure 2
The relationship between gating free energy and the common logarithm of the open probability of the sodium channels at membrane potential −0.087 V and over gating free energy range from −12 J to −5 J.
Figure 3
Figure 3
The relationship between membrane potential and the common logarithm of the membrane conductance of sodium ions according to the Boltzmann distribution at G = −6.33 J and over membrane potential range from −0.09 V to 0 V.
Figure 4
Figure 4
The relationship between gating free energy and the common logarithm of the membrane conductance of sodium ions according to the Boltzmann distribution at membrane potential −0.087 V and over gating free energy range from −12 J to −5 J.
Figure 5
Figure 5
The relationship between the membrane potential and the common logarithm of tunneling probability of extracellular sodium ions at G = 6.33 J and over a membrane potential range from 0.054 V to 0.09 V.
Figure 6
Figure 6
The relationship between membrane potential and the common logarithm of tunneling probability of intracellular sodium ions at G = 6.33 J and over a membrane potential range from 0.048 V to 0.09 V.
Figure 7
Figure 7
The relationship between gating free energy and the common logarithm of tunneling probability of extracellular sodium ions at membrane potential of 0.087 V and over a gating free energy range from 5 J to 10.77 J.
Figure 8
Figure 8
The relationship between gating free energy and the common logarithm of tunneling probability of intracellular sodium ions at membrane potential of 0.087 V and over a gating free energy range from 5 J to 12.17 J.
Figure 9
Figure 9
The relationship between membrane potential and the common logarithm of quantum conductance of a single sodium channel for extracellular sodium ions at G = 6.33 J and over a membrane potential range from 0.054 V to 0.09 V.
Figure 10
Figure 10
The relationship between membrane potential and the common logarithm of quantum conductance of a single sodium channel for the intracellular sodium ions at G = 6.33 J and over a membrane potential range from 0.048 V to 0.09 V.
Figure 11
Figure 11
The relationship between gating free energy and the common logarithm of quantum conductance of a single sodium channel for the extracellular sodium ions at membrane potential 0.087 V and over a gating free energy range from 5 J to 10.77 J.
Figure 12
Figure 12
The relationship between gating free energy and the common logarithm of quantum conductance of a single channel for intracellular sodium ions at membrane potential 0.087 V and over a gating free energy range from 5 J to 12.17 J.
Figure 13
Figure 13
The relationship between membrane potential and the common logarithm of quantum membrane conductance of extracellular sodium ions at G = 6.33 J and over a membrane potential range from 0.054 V to 0.09 V.
Figure 14
Figure 14
The relationship between membrane potential and the common logarithm of quantum membrane conductance of intracellular sodium ions at G = 6.33 J and over a membrane potential range from 0.048 V to 0.09 V.
Figure 15
Figure 15
The relationship between gating free energy and the common logarithm of quantum membrane conductance of extracellular sodium ions at membrane potential of 0.087 V and over a gating free energy range from 5 J to 10.77 J.
Figure 16
Figure 16
The relationship between gating free energy and the common logarithm of quantum membrane conductance of intracellular sodium ions at membrane potential of 0.087 V and over a gating free energy range from 5 J to 12.17 J.
Figure 17
Figure 17
The relationship between the membrane potential and the common logarithm of the open probability of potassium channels at G = −5.35 J and over a membrane potential range from −0.09 V to 0 V.
Figure 18
Figure 18
The relationship between gating free energy and the common logarithm of the open probability of potassium channels at membrane potential −0.087 V and over a gating free energy range from −12 J to −5 J.
Figure 19
Figure 19
The relationship between membrane potential and the common logarithm of the membrane conductance of potassium ions according to the Boltzmann distribution at G = −5.35 J and over a membrane potential range from −0.09 V to 0 V.
Figure 20
Figure 20
The relationship between gating free energy and the common logarithm of the membrane conductance of potassium ions according to the Boltzmann distribution at membrane potential of −0.087 V and over a gating free energy range from −12 J to −5 J.
Figure 21
Figure 21
The relationship between membrane potential and the common logarithm of tunneling probability of extracellular potassium ions at G = 5.35 J and over a membrane potential range from 0.044 V to 0.09 V.
Figure 22
Figure 22
The relationship between membrane potential and the common logarithm of tunneling probability of intracellular potassium at G = 5.35 J and over a membrane potential range from 0.039 V to 0.09 V.
Figure 23
Figure 23
The relationship between gating free energy and the common logarithm of tunneling probability of extracellular potassium ions at membrane potential of 0.087 V and over a gating free energy range from 5 J to 11.33 J.
Figure 24
Figure 24
The relationship between gating free energy and the common logarithm of tunneling probability of intracellular potassium ions at membrane potential of 0.087 V and over a gating free energy range from 5 J to 12.72 J.
Figure 25
Figure 25
The relationship between membrane potential and the common logarithm of quantum conductance of a single potassium channel for extracellular potassium ions at G = 5.35 J and over a membrane potential range from 0.044 V to 0.09 V.
Figure 26
Figure 26
The relationship between membrane potential and the common logarithm of quantum conductance of a single potassium channel for intracellular potassium ions at G = 5.35 and over a membrane potential range from 0.039 V to 0.09 V.
Figure 27
Figure 27
The relationship between gating free energy and the common logarithm of quantum conductance of a single potassium channel for extracellular potassium ions at membrane potential of 0.087 V and over a gating free energy range from 5 J to 11.33 J.
Figure 28
Figure 28
The relationship between gating free energy and the common logarithm of quantum conductance of a single potassium channel for intracellular potassium ions at membrane potential of 0.087 V and over a gating free energy range from 5 J to 12.72 J.
Figure 29
Figure 29
The relationship between membrane potential and the common logarithm of the quantum membrane conductance of extracellular potassium ions at G = 5.35 J and over a membrane potential range from 0.044 V to 0.09 V.
Figure 30
Figure 30
The relationship between membrane potential and the common logarithm of the quantum membrane conductance of intracellular potassium ions at G = 5.35 J and over a membrane potential range from 0.039 V to 0.09 V.
Figure 31
Figure 31
The relationship between gating free energy and the common logarithm of the quantum membrane conductance of extracellular potassium at membrane potential of 0.087 V and over a gating free energy range from 5 J to 11.33 J.
Figure 32
Figure 32
The relationship between gating free energy and the common logarithm of the quantum membrane conductance of intracellular potassium ions at membrane potential of 0.087 V and over a gating free energy range from 5 J and 12.72 J.
Figure 33
Figure 33
The relationship between gating free energy and the resting membrane potential under the influence of quantum tunneling of sodium ions.
Figure 34
Figure 34
The relationship between gating free energy and the resting membrane potential under the influence of quantum tunneling of potassium ions.
Figure 35
Figure 35
A schematic diagram represents the quantum wave behavior of an ion and the quantum tunneling through the intracellular gate (shown in red) indicated by the dashed line in the gate, which is formed by the crossing of the four S6 segments near the intracellular side (two of them are shown for simplicity). Figure (a) represents quantum tunneling of an ion moving from the extracellular side to the intracellular side. Figure (b) represents quantum tunneling of an ion moving from the intracellular side to the extracellular side. Notice that the extracellular ion, as in Figure (a), has shorter wavelength (the distance from peak to peak) when it is compared with that of the intracellular ion, as in Figure (b). This indicates that extracellular ions have higher kinetic energy since it is inversely correlated with the wavelength. Additionally, the wave amplitude of the extracellular ion passing after the gate, as in Figure (a), is higher than that of the intracellular ion, as in Figure (b). This indicates that extracellular ions have higher tunneling probability since it is proportional to the wave amplitude.
Figure 35
Figure 35
A schematic diagram represents the quantum wave behavior of an ion and the quantum tunneling through the intracellular gate (shown in red) indicated by the dashed line in the gate, which is formed by the crossing of the four S6 segments near the intracellular side (two of them are shown for simplicity). Figure (a) represents quantum tunneling of an ion moving from the extracellular side to the intracellular side. Figure (b) represents quantum tunneling of an ion moving from the intracellular side to the extracellular side. Notice that the extracellular ion, as in Figure (a), has shorter wavelength (the distance from peak to peak) when it is compared with that of the intracellular ion, as in Figure (b). This indicates that extracellular ions have higher kinetic energy since it is inversely correlated with the wavelength. Additionally, the wave amplitude of the extracellular ion passing after the gate, as in Figure (a), is higher than that of the intracellular ion, as in Figure (b). This indicates that extracellular ions have higher tunneling probability since it is proportional to the wave amplitude.

Similar articles

Cited by

References

    1. Bertil H. Ion Channels of Excitable Membranes. 3rd ed. Sinauer Associates; Sunderland, MA, USA: 2001.
    1. Lerche H., Shah M., Beck H., Noebels J., Johnston D., Vincent A. Ion channels in genetic and acquired forms of epilepsy. J. Physiol. 2013;591:753–764. doi: 10.1113/jphysiol.2012.240606. - DOI - PMC - PubMed
    1. Dib-Hajj S.D., Geha P., Waxman S.G. Sodium channels in pain disorders: Pathophysiology and prospects for treatment. Pain. 2017;158:S97–S107. doi: 10.1097/j.pain.0000000000000854. - DOI - PMC - PubMed
    1. Dehghani-Samani A., Madreseh-Ghahfarokhi S., Dehghani-Samani A. Mutations of voltage-gated ionic channels and risk of severe cardiac arrhythmias. Acta Cardiol. Sin. 2019;35:99–110. - PMC - PubMed
    1. Tejada J., Costa K.M., Bertti P., Garcia-Cairasco N. The epilepsies: Complex challenges needing complex solutions. Epilepsy Behav. 2013;26:212–228. doi: 10.1016/j.yebeh.2012.09.029. - DOI - PubMed

LinkOut - more resources