. 2021 Sep 3;28(3):400-436.
doi: 10.3390/pathophysiology28030027.

Proton Quantum Tunneling: Influence and Relevance to Acidosis-Induced Cardiac Arrhythmias/Cardiac Arrest

Affiliations

Proton Quantum Tunneling: Influence and Relevance to Acidosis-Induced Cardiac Arrhythmias/Cardiac Arrest

Omar Ababneh et al. Pathophysiology. .

Abstract

Acidosis and its associated pathologies predispose patients to develop cardiac arrhythmias and even cardiac arrest. These arrhythmias are assumed to be the result of membrane depolarization, however, the exact mechanism of depolarization during acidosis is not well defined. In our study, the model of quantum tunneling of protons is used to explain the membrane depolarization that occurs during acidosis. It is found that protons can tunnel through closed activation and inactivation gates of voltage-gated sodium channels Nav1.5 that are present in the membrane of cardiac cells. The quantum tunneling of protons results in quantum conductance, which is evaluated to assess its effect on membrane potential. The quantum conductance of extracellular protons is higher than that of intracellular protons. This predicts an inward quantum current of protons through the closed sodium channels. Additionally, the values of quantum conductance are influential and can depolarize the membrane potential according to the quantum version of the GHK equation. The quantum mechanism of depolarization is distinct from other mechanisms because the quantum model suggests that protons can directly depolarize the membrane potential, and not only through indirect effects as proposed by other mechanisms in the literature. Understanding the pathophysiology of arrhythmias mediated by depolarization during acidosis is crucial to treat and control them and to improve the overall clinical outcomes of patients.

Keywords: acidosis; arrhythmias; proton; quantum biology; quantum conductance; quantum tunneling; voltage-gated channels.


Conflict of interest statement

The authors declare no conflict of interest.

Figures

Figure 1
Figure 1
Represents the different locations of the gate through which quantum tunneling of ions occur. n = 1 is where the ion will pass through the entire membrane potential, n = 2 is where the ion will pass the half of membrane potential, and n = 4 is where the ion will pass the quarter of membrane potential.
Figure 2
Figure 2
(ac): represents the mathematical graph of common logarithm of tunneling probability for extracellular protons log10(TQ)HE over gate’s energy range from 2.5 to 7 J according to gate length, membrane potential, and gate location, respectively; (d): represents the mathematical graph of common logarithm of tunneling probability for intracellular protons log10(TQ)HI over gate’s energy range from 1 to 7 J according to gate length.
Figure 3
Figure 3
(ac): represents the mathematical graph of common logarithm of tunneling probability for extracellular sodium ions log10(TQ)NaE over gate’s energy range from 2.5 to 7 J according to gate length, membrane potential, and gate location, respectively; (d): represents the mathematical graph of common logarithm of tunneling probability for intracellular sodium ions log10(TQ)NaI over gate’s energy range from 1 to 7 J according to gate length.
Figure 4
Figure 4
(ac): represents the mathematical graph of common logarithm of quantum conductance of single channel for extracellular protons log10(CQ)HE over gate’s energy range from 2.5 to 7 J according to gate length, membrane potential, and gate location, respectively; (d): represents the mathematical graph of common logarithm of quantum conductance of single channel for intracellular protons log10(CQ)HI over gate’s energy range from 1 to 7 J according to gate length.
Figure 5
Figure 5
(ac): represents the mathematical graph of common logarithm of quantum conductance of single channel for extracellular sodium ions log10(CQ)NaE over gate’s energy range from 2.5 to 7 J according to gate length, membrane potential, and gate location, respectively; (d): represents the mathematical graph of common logarithm of quantum conductance of single channel for intracellular sodium ions log10(CQ)NaI over gate’s energy range from 1 to 7 J according to gate length.
Figure 6
Figure 6
(ad): represents the mathematical graph of common logarithm of quantum membrane conductance for extracellular protons log10(MCQ)HE over gate’s energy range from 2.5 to 7 J according to gate length, membrane potential, gate location, and channels density, respectively; (e,f): represents the mathematical graph of common logarithm of quantum membrane conductance for intracellular protons log10(MCQ)HI over gate’s energy range from 1 to 7 J according to gate length, and channels density, respectively.
Figure 7
Figure 7
(ad): represents the mathematical graph of common logarithm of quantum membrane conductance for extracellular sodium ions log10(MCQ)NaE over gate’s energy range from 2.5 to 7 J according to gate length, membrane potential, gate location, and channels density, respectively; (e,f): represents the mathematical graph of common logarithm of quantum membrane conductance for intracellular sodium ions log10(MCQ)NaI over gate’s energy range from 1 to 7 J according to gate length and channels density, respectively.
Figure 8
Figure 8
The relationship between the resting membrane potential and the energy of gate under the influence of quantum tunneling of protons according to external pH, gate length, channels density, and gate location.
Figure 9
Figure 9
The relationship between the resting membrane potential and the energy of gate under the influence of quantum tunneling of sodium ions according to gate length, channel density, and gate location.
Figure 10
Figure 10
The relationship between the resting membrane potential and a range of external pH from 5 to 7.4 under the influence of classical transport of protons through open voltage-gated sodium channels and at different channels densities.
Figure 11
Figure 11
A schematic diagram that represents the quantum tunneling of the wave-function of a proton through different levels of gate energy E3 > E2 > E1. The lower is the gate energy; the higher is the tunneling probability, which is represented by higher amplitude of wave-function after tunneling through the gate (shown in red).
Figure 12
Figure 12
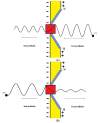
A schematic diagram that represents the quantum tunneling of the wavefunction of extracellular and intracellular ions through the gate (red in color). (a): extracellular ion has higher kinetic energy manifested as shorter wavelength, and higher tunneling probability manifested as higher amplitude after passing the gate; (b): intracellular ion has lower kinetic energy manifested as longer wavelength and lower tunneling probability manifested as lower amplitude after passing the gate.
Figure 13
Figure 13
A schematic diagram that represents the quantum tunneling of extracellular proton and sodium ion. (a): proton has longer wavelength (due to small mass) and higher tunneling probability manifested as higher amplitude after passing the gate; (b): sodium ion has shorter wavelength (due to larger mass) and lower tunneling probability manifested as lower amplitude after passing the gate.
Figure 14
Figure 14
(a): represents normal heart with normal polarization (negative inside with regard to outside); (b): represents inward quantum tunneling of protons, which is indicated by inward arrows. This inward tunneling is responsible for membrane depolarization during acidosis according to the quantum model; (c): represents the state of membrane depolarization (positive inside with regard to outside), which is the outcome of protons tunneling that increases the tendency of arrhythmias and cardiac arrest.

Similar articles

References

    1. Greenberg A. Primer on Kidney Diseases E-Book. Elsevier Health Sciences; Amsterdam, The Netherlands: 2009.
    1. Hall J.E., Hall M.E. Guyton and Hall Textbook of Medical Physiology E-Book. Elsevier Health Sciences; Amsterdam, The Netherlands: 2020.
    1. Gerst P.H., Fleming W.H., Malm J.R. Increased susceptibility of the heart to ventricular fibrillation during metabolic acidosis. Circ. Res. 1966;19:63–70. doi: 10.1161/01.RES.19.1.63. - DOI
    1. Orchard C.H., Cingolani H.E. Acidosis and arrhythmias in cardiac muscle. Cardiovasc. Res. 1994;28:1312–1319. doi: 10.1093/cvr/28.9.1312. - DOI - PubMed
    1. Nisbet A.M., Burton F.L., Walker N.L., Craig M.A., Cheng H., Hancox J.C., Orchard C.H., Smith G.L. Acidosis slows electrical conduction through the atrio-ventricular node. Front. Physiol. 2014;5:233. doi: 10.3389/fphys.2014.00233. - DOI - PMC - PubMed

LinkOut - more resources