. 2022 May;21(5):e13601.
doi: 10.1111/acel.13601. Epub 2022 Apr 2.

Improved cognitive impairments by silencing DMP1 via enhancing the proliferation of neural progenitor cell in Alzheimer-like mice

Affiliations

Improved cognitive impairments by silencing DMP1 via enhancing the proliferation of neural progenitor cell in Alzheimer-like mice

Huimin Zhao et al. Aging Cell. 2022 May.

Abstract

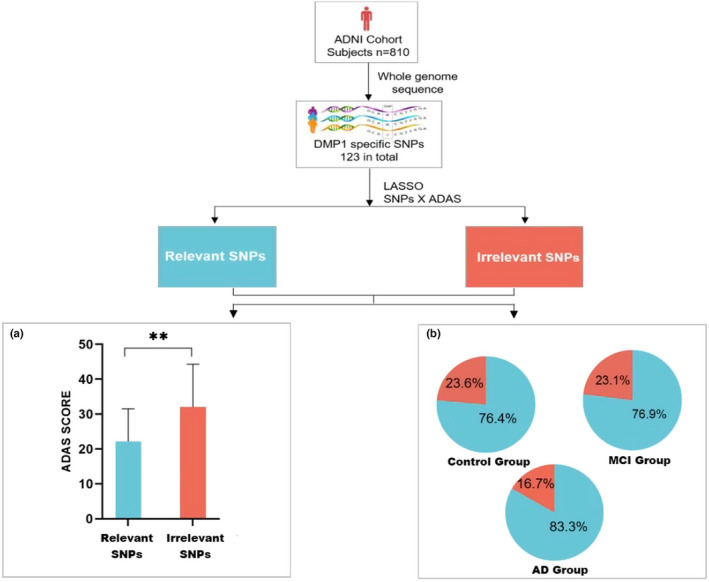
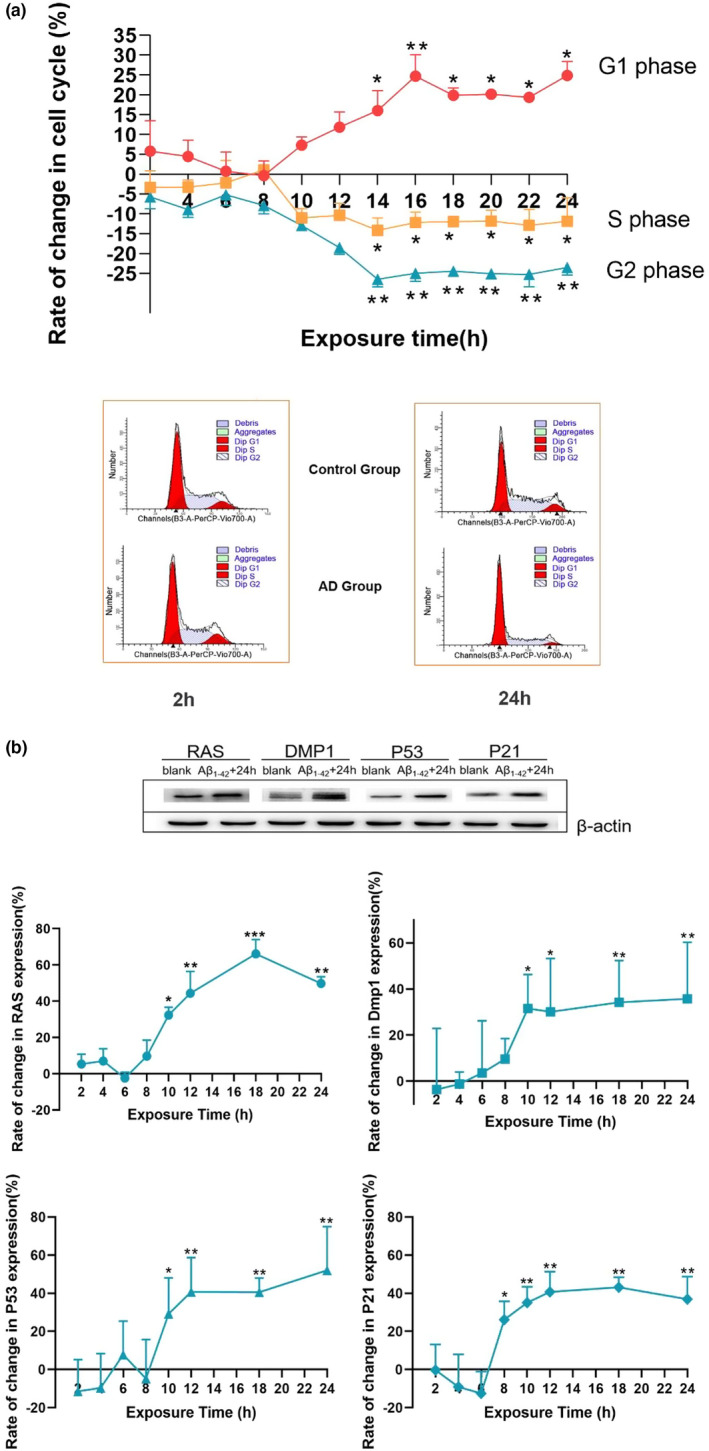
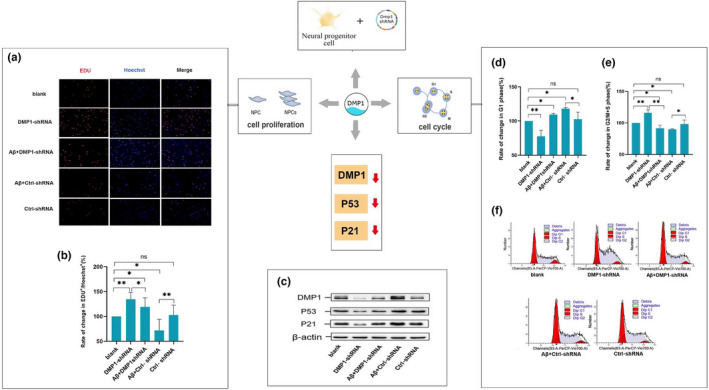
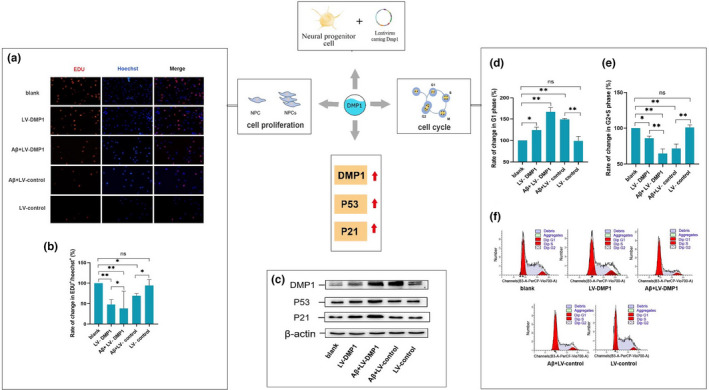
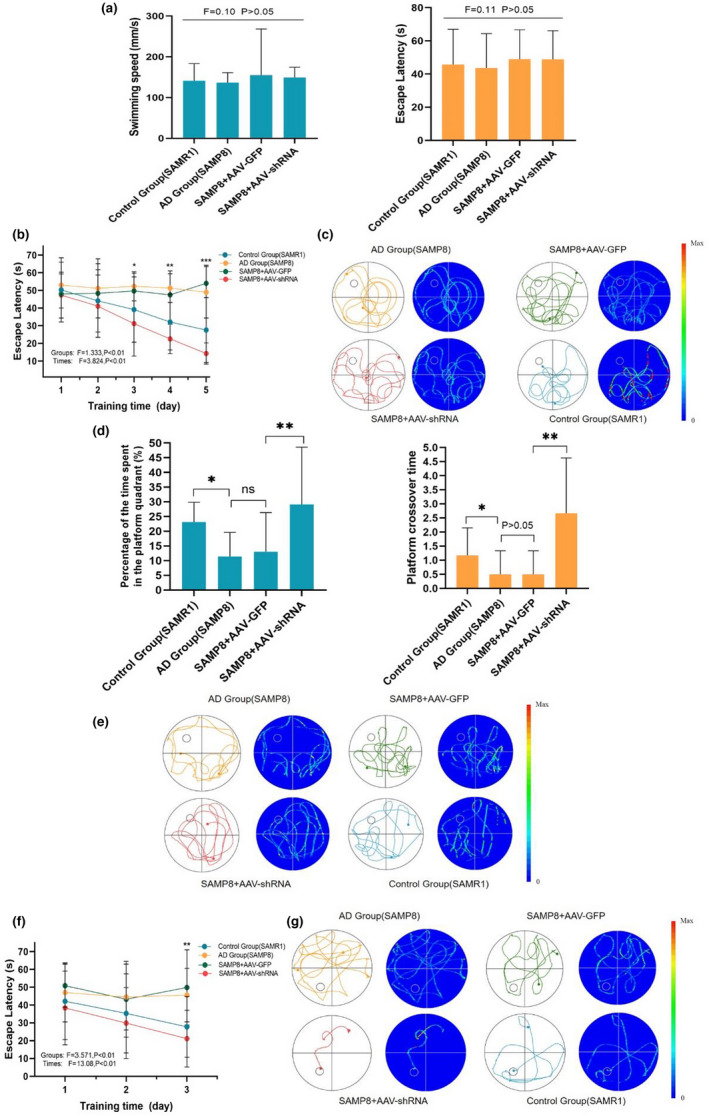
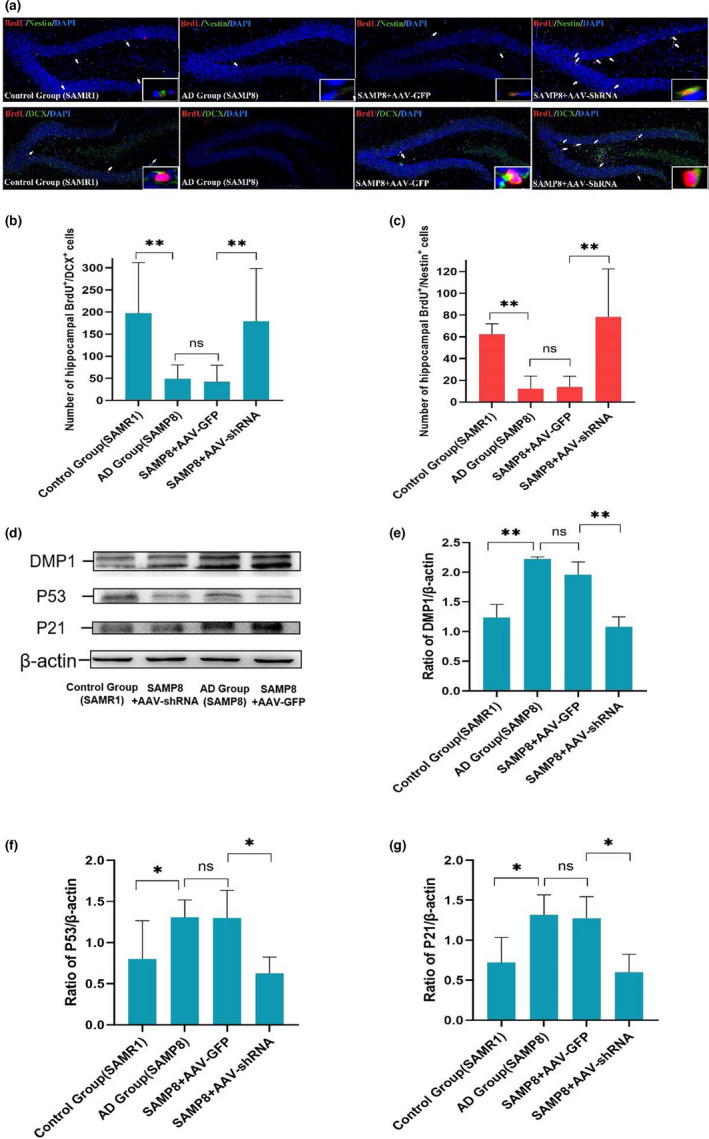
Alzheimer's disease (AD) is age-related progressive neurological dysfunction. Limited clinical benefits for current treatments indicate an urgent need for novel therapeutic strategies. Previous transcriptomic analysis showed that DMP1 expression level was increased in AD model animals whereas it can induce cell-cycle arrest in several cell lines. However, whether the cell-cycle arrest of neural progenitor cell induced by DMP1 affects cognitive function in Alzheimer-like mice still remains unknown. The objective of our study is to explore the issue. We found that DMP1 is correlated with cognitive function based on the clinical genomic analysis of ADNI database. The negative role of DMP1 on neural progenitor cell (NPC) proliferation was revealed by silencing and overexpressing DMP1 in vitro. Furthermore, silencing DMP1 could increase the number of NPCs and improve cognitive function in Alzheimer-like mice, through decreasing P53 and P21 levels, which suggested that DMP1-induced cell-cycle arrest could influence cognitive function.

Keywords: Alzheimer's disease; DMP1; neural progenitor cell; proliferation.


Figures

FIGURE 1
FIGURE 1
Exploration of the correlation between DMP1 specific SNPs and cognitive function. (a) The comparison of ADAS levels between the relevant SNPs cluster and the irrelevant SNPs cluster (p < 0.01). (b) The distribution of the relevant SNPs cluster and the irrelevant SNPs cluster among the control group, the MCI group and the AD group
FIGURE 2
FIGURE 2
1–42 exposure leads to the cell‐cycle arrest of C17.2 NPCs and the increased expression of DMP1. (a) Rate of change in cell cycle of C17.2 NPCs. At the indicated time point, DNA content of the cells were determined to analyze the distribution of cell‐cycle phase. The mathematical model MODFIT was used to calculate the proportions of cells at each cell‐cycle phase. (b) Rate of change in RAS, DMP1, P53 and P21 expression at different time point. Data information: Mean ± SEM, n = 3 for each group, *p < 0.05, **p < 0.01, ***p < 0.001 the Aβ1–42 group vs the control group
FIGURE 3
FIGURE 3
Effect of DMP1 knockdown on the proliferation of C17.2 neural progenitor cells. (a) Immunofluorescence photos of C17.2 cells. (b) Rate in change in EDU+/Hoechst+C17.2 cells. (c) The representative results of DMP1, P53, P21 and β‐actin expressed in the C17.2 cells in Western blot. (d) Rate of change in G1 phase in C17.2 neural progenitor cells. (e) Rate of change in G2/M+S phase in C17.2 neural progenitor cells. (f) At the indicated time point, DNA content of the cells were determined to analyze the distribution of cell‐cycle phase. The mathematical model MODFIT was used to calculate the proportions of cells at each cell‐cycle phase. Data information: The data were expressed as Mean ± SEM, n = 3 for each group, *p < 0.05, **p < 0.01, ***p < 0.001
FIGURE 4
FIGURE 4
Effect of overexpressing DMP1 on the proliferation of C17.2 neural progenitor cells. (a) Immunofluorescence photos of C17.2 cells. (b) Rate in change in EDU+/Hoechst+C17.2 cells. (c) The representative results of DMP1, P53, P21 and β‐actin expressed in the C17.2 cells in Western blot. (d) Rate of change in G1 phase in C17.2 neural progenitor cell. (e) Rate of change in G2/M+S phase in C17.2 neural progenitor cells. (f) At the indicated time point, DNA content of the cells were determined to analyze the distribution of cell‐cycle phase. The mathematical model MODFIT was used to calculate the proportions of cells at each cell‐cycle phase. Data information: The data were expressed as Mean ± SEM, n = 3 for each group, *p < 0.05, **p < 0.01, ***p < 0.001
FIGURE 5
FIGURE 5
Silencing DMP1 in SAMP8 animals restores cognitive deficits. Morris water maze test was used to evaluate the learning and memory function of the mice. Escape latency in the formal experiments of the water maze task. (a) During the visible platform trail, there is no difference between the four groups in swimming speed and escape latency. (b) The escape latency of four groups in the hidden platform trail. (c) The heat maps of pooled animals manifest the results of the hidden platform trail. (d) Percentage of time spent in the platform quadrant and platform crossover time in the probe trail. (e) The heat maps of pooled animals manifest the results of the probe trail. (f) The escape latency of four groups in the reference trail. (g) The heat maps of pooled animals manifest the results of the probe trail. Data information: The data were expressed as Mean ± SEM, n = 5 for each group, *p < 0.05, **p < 0.01, ***p < 0.001
FIGURE 6
FIGURE 6
Silencing DMP1 promoted the number of hippocampal newborn NPCs and neurons through P53/P21 signaling in 6 months SAMP8 mice. Newborn NPCs in the hippocampus were detected by immunofluorescent staining with antibody against BrdU and Nestin, newborn neurons in the hippocampus were detected by immunofluorescent staining with antibody against BrdU and DCX. (a)–(c) Quantitative analysis of the number of BrdU+/Nestin+ and BrdU+/DCX+ cells. (d) The protein levels of DMP1, P53, and P21 were analyzed by western blot. (e)–(g) Quantitative analysis of proteins expression. Data information: The data were expressed as Mean ± SEM, n = 3 for each group, *p < 0.05, **p < 0.01, ***p < 0.001

Similar articles

Cited by

References

    1. Abbott, L. C. , & Nigussie, F. (2020). Adult neurogenesis in the mammalian dentate gyrus. Anatomia Histologia and Embryologia, 49(1), 3–16. 10.1111/ahe.12496 - DOI - PubMed
    1. Adamsky, A. , Kol, A. , Kreisel, T. , Doron, A. , Ozeri‐Engelhard, N. , Melcer, T. , Refaeli, R. , Horn, H. , Regev, L. , Groysman, M. , London, M. , & Goshen, I. (2018). Astrocytic activation generates de novo neuronal potentiation and memory enhancement. Cell, 174(1), 59–71.e14. 10.1016/j.cell.2018.05.002 - DOI - PubMed
    1. Anacker, C. , & Hen, R. (2017). Adult hippocampal neurogenesis and cognitive flexibility—linking memory and mood. Nature Reviews: Neuroscience, 18(6), 335–346. 10.1038/nrn.2017.45 - DOI - PMC - PubMed
    1. Armstrong, R. A. , & Cairns, N. J. (2015). Comparative quantitative study of ‘signature’ pathological lesions in the hippocampus and adjacent gyri of 12 neurodegenerative disorders. Journal of Neural Transmission, 122(10), 1355–1367. 10.1007/s00702-015-1402-8 - DOI - PubMed
    1. Bekinschtein, P. , Katche, C. , Slipczuk, L. , Gonzalez, C. , Dorman, G. , Cammarota, M. , Izquierdo, I. , & Medina, J. H. (2010). Persistence of long‐term memory storage: new insights into its molecular signatures in the hippocampus and related structures. Neurotoxicity Research, 18(3–4), 377–385. 10.1007/s12640-010-9155-5 - DOI - PubMed

Substances