Exploring autophagy-related prognostic genes of Alzheimer's disease based on pathway crosstalk analysis
- PMID: 35366391
- PMCID: PMC9519154
- DOI: 10.17305/bjbms.2021.7019
Exploring autophagy-related prognostic genes of Alzheimer's disease based on pathway crosstalk analysis
Abstract
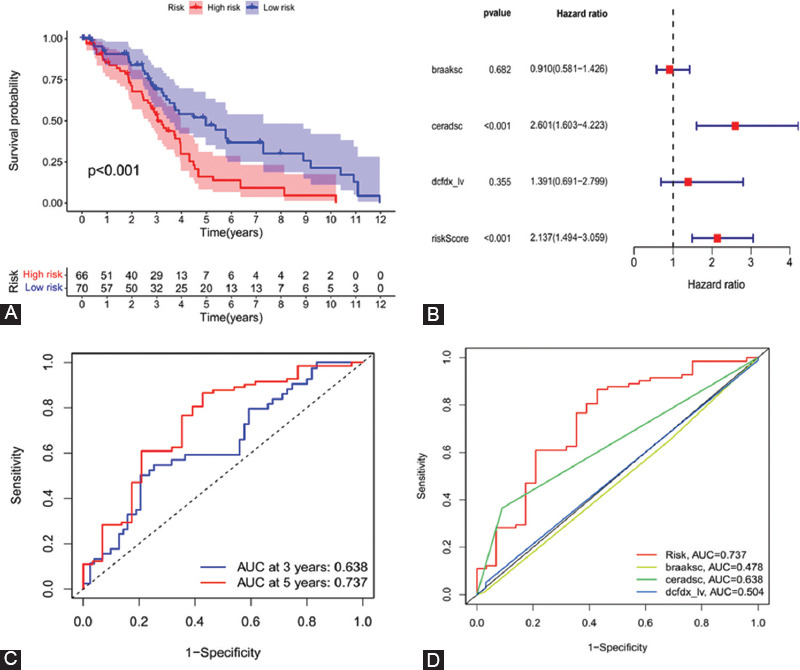
Recent studies have shown that different signaling pathways are involved in the pathogenesis of Alzheimer's disease (AD), with complex molecular connections existing between these pathways. Autophagy is crucial for the degradation and production of pathogenic proteins in AD, and it shows link with other AD-related pathways. However, current methods for identifying potential therapeutic targets for AD are primarily based on single-gene analysis or a single signal pathway, both of which are somewhat limited. Finding other methods is necessary for providing novel underlying AD therapeutic targets. Therefore, given the central role of autophagy in AD and its interplay with its pathways, we aimed to identify prognostic genes related to autophagy within and between these pathways based on pathway crosstalk analysis. The method of pathway analysis based on global influence (PAGI) was applied to find the feature mRNAs involved in the crosstalk between autophagy and other AD-related pathways. Subsequently, the weighted gene co-expression network analysis (WGCNA) was used to construct a co-expression module of feature mRNAs and differential lncRNAs. Finally, based on 2 autophagy-related crosstalk genes (CD40 and SMAD7), we constructed a prognosis model by multivariate Cox regression, which could predict the overall survival of AD patients with medium-to-high accuracy. In conclusion, we provided an effective method for extracting autophagy-related significant genes based on pathway crosstalk in AD. We found the biomarkers valuable to the AD prognosis, which may also play an essential role in the development and treatment of AD.
Conflict of interest statement
Conflicts of interest: The authors declare no conflicts of interest.
Figures


Similar articles
-
Analyzing the genes related to Alzheimer's disease via a network and pathway-based approach.Alzheimers Res Ther. 2017 Apr 27;9(1):29. doi: 10.1186/s13195-017-0252-z. Alzheimers Res Ther. 2017. PMID: 28446202 Free PMC article.
-
A new method for excavating feature lncRNA in lung adenocarcinoma based on pathway crosstalk analysis.J Cell Biochem. 2019 Jun;120(6):9034-9046. doi: 10.1002/jcb.28177. Epub 2018 Dec 23. J Cell Biochem. 2019. PMID: 30582215
-
Establishment and Analysis of a Prognostic Model of Autophagy-Related lncRNAs in ESCA.Biomed Res Int. 2022 Jul 26;2022:9265088. doi: 10.1155/2022/9265088. eCollection 2022. Biomed Res Int. 2022. PMID: 35928921 Free PMC article.
-
A multitude of signaling pathways associated with Alzheimer's disease and their roles in AD pathogenesis and therapy.Med Res Rev. 2021 Sep;41(5):2689-2745. doi: 10.1002/med.21719. Epub 2020 Aug 11. Med Res Rev. 2021. PMID: 32783388 Free PMC article. Review.
-
Autophagic dysfunction in Alzheimer's disease: Cellular and molecular mechanistic approaches to halt Alzheimer's pathogenesis.J Cell Physiol. 2019 Jun;234(6):8094-8112. doi: 10.1002/jcp.27588. Epub 2018 Oct 26. J Cell Physiol. 2019. PMID: 30362531 Review.
Cited by
-
Identification of Blood Biomarkers Related to Energy Metabolism and Construction of Diagnostic Prediction Model Based on Three Independent Alzheimer's Disease Cohorts.J Alzheimers Dis. 2024;100(4):1261-1287. doi: 10.3233/JAD-240301. J Alzheimers Dis. 2024. PMID: 39093073 Free PMC article.
-
Biomarker Genes Discovery of Alzheimer's Disease by Multi-Omics-Based Gene Regulatory Network Construction of Microglia.Brain Sci. 2022 Sep 5;12(9):1196. doi: 10.3390/brainsci12091196. Brain Sci. 2022. PMID: 36138932 Free PMC article.
References
-
- Rabbito A, Dulewicz M, Kulczyńska-Przybik A, Mroczko B. Biochemical markers in Alzheimer's disease. Int J Mol Sci. 2020;21(6):1989. https://doi.org/10.3390/ijms21061989. - PMC - PubMed
-
- Gadhave K, Kumar D, Uversky VN, Giri R. A multitude of signaling pathways associated with Alzheimer's disease and their roles in AD pathogenesis and therapy. Med Res Rev. 2020;41(5):2689–2745. https://doi.org/10.1002/med.21719. - PMC - PubMed
-
- Uddin MS, Stachowiak A, Mamun AA, Tzvetkov NT, Takeda S, Atanasov AG, et al. Autophagy and Alzheimer's disease:From molecular mechanisms to therapeutic implications. Front Aging Neurosci. 2018;10:4. https://doi.org/10.3389/fnagi.2018.00004. - PMC - PubMed
-
- Caccamo A, Majumder S, Richardson A, Strong R, Oddo S. Molecular interplay between mammalian target of rapamycin (mTOR), amyloid-beta, and Tau:Effects on cognitive impairments. J Biol Chem. 2010;285(17):13107–20. https://doi.org/10.1074/jbc.M110.100420. - PMC - PubMed
-
- Nilsson P, Loganathan K, Sekiguchi M, Matsuba Y, Hui K, Tsubuki S, et al. Aβ secretion and plaque formation depend on autophagy. Cell Rep. 2013;5(1):61–9. https://doi.org/10.1016/j.celrep.2013.08.042. - PubMed
MeSH terms
Substances
LinkOut - more resources
Full Text Sources
Medical
Research Materials