

Comparison of test-retest reliability of BOLD and pCASL fMRI in a two-center study
- PMID: 35366813
- PMCID: PMC8977011
- DOI: 10.1186/s12880-022-00791-9
Comparison of test-retest reliability of BOLD and pCASL fMRI in a two-center study
Abstract
Background: The establishment of test-retest reliability and reproducibility (TRR) is an important part of validating any research tool, including functional magnetic resonance imaging (fMRI). The primary objective of this study is to investigate the reliability of pseudo-Continuous Arterial Spin Labeling (pCASL) and Blood Oxygen Level Dependent (BOLD) fMRI data acquired across two different scanners in a sample of healthy adults. While single site/single scanner studies have shown acceptable repeatability, TRR of both in a practical multisite study occurring in two facilities spread out across the country with weeks to months between scans is critically needed.
Methods: Ten subjects were imaged with similar 3 T MRI scanners at the University of Pittsburgh and Massachusetts General Hospital. Finger-tapping and Resting-state data were acquired for both techniques. Analysis of the resting state data for functional connectivity was performed with the Functional Connectivity Toolbox, while analysis of the finger tapping data was accomplished with FSL. pCASL Blood flow data was generated using AST Toolbox. Activated areas and networks were identified via pre-defined atlases and dual-regression techniques. Analysis for TRR was conducted by comparing pCASL and BOLD images in terms of Intraclass correlation coefficients, Dice Similarity Coefficients, and repeated measures ANOVA.
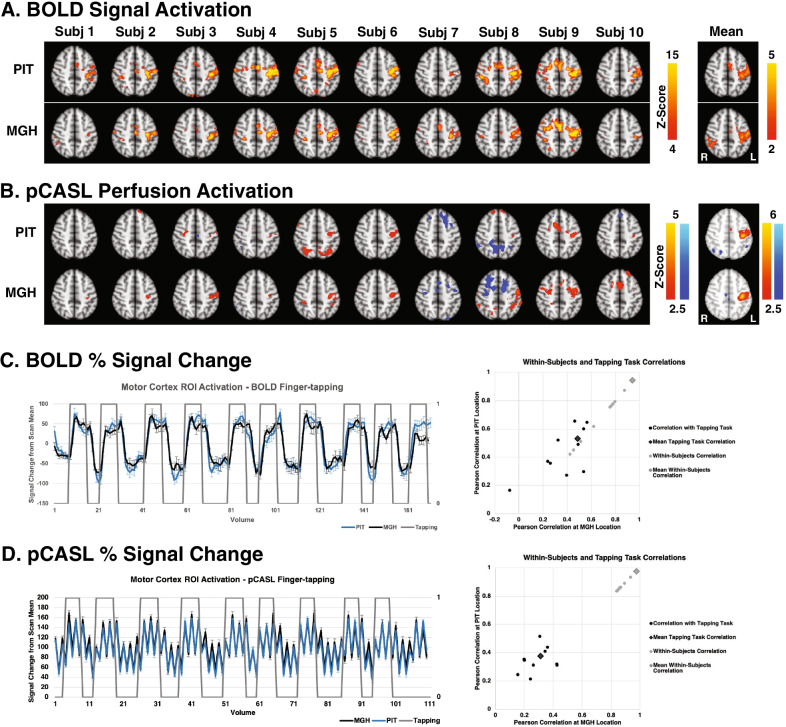
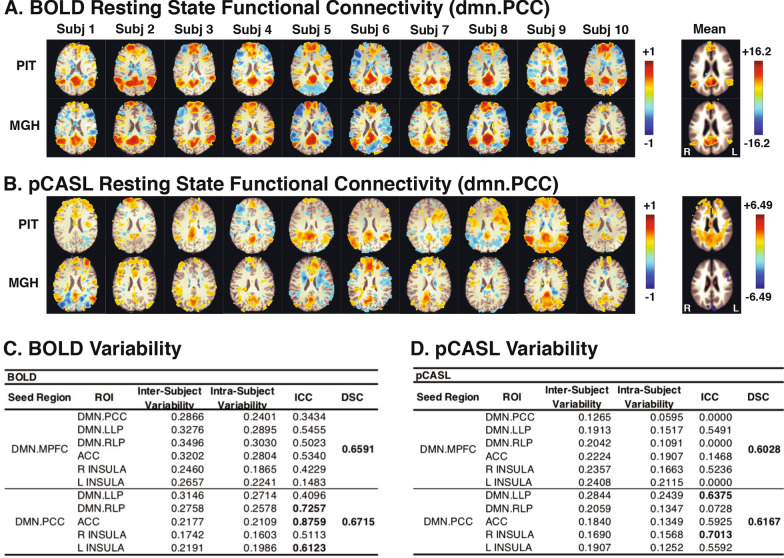
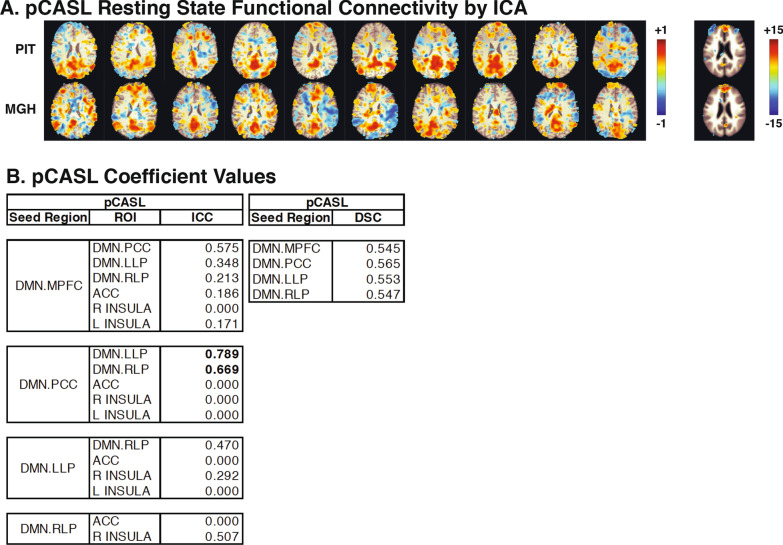
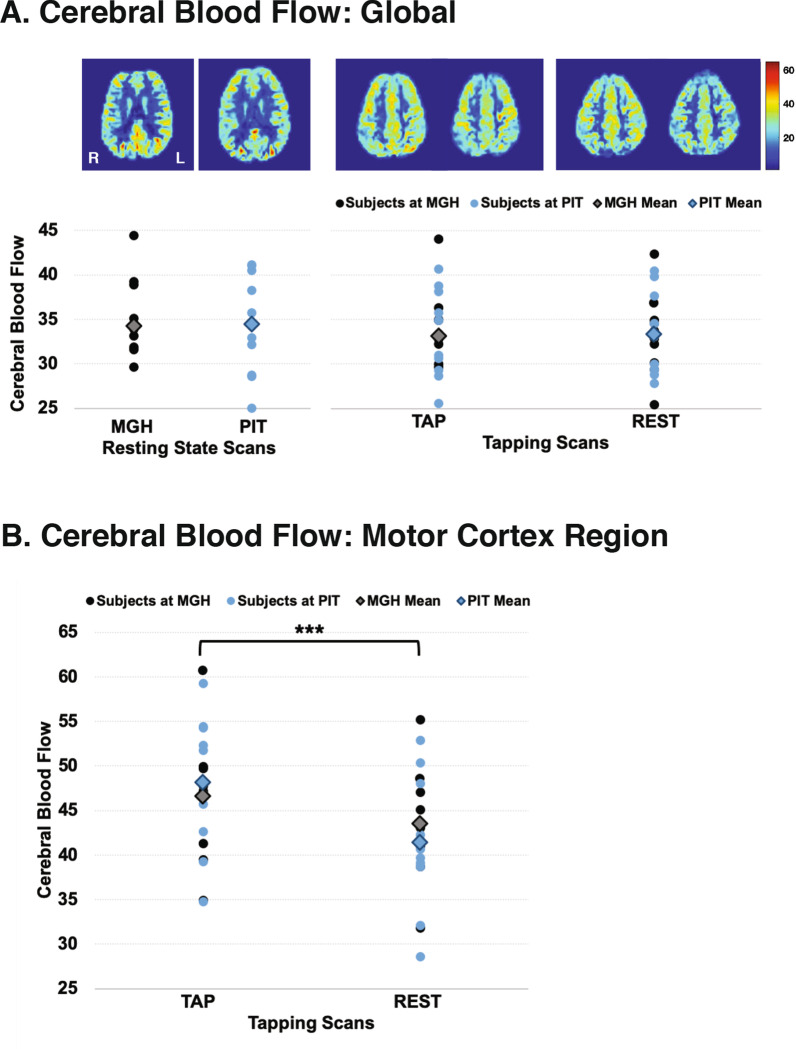
Results: Both BOLD and pCASL scans showed strong activation and correlation between the two locations for the finger tapping tasks. Functional connectivity analyses identified elements of the default mode network in all resting scans at both locations. Multivariate repeated measures ANOVA showed significant variability between subjects, but no significant variability for location. Global CBF was very similar between the two scanning locations, and repeated measures ANOVA showed no significant differences between the two scanning locations.
Conclusions: The results of this study show that when similar scanner hardware and software is coupled with identical data analysis protocols, consistent and reproducible functional brain images can be acquired across sites. The variability seen in the activation maps is greater for pCASL versus BOLD images, as expected, however groups maps are remarkably similar despite the low number of subjects. This demonstrates that multi-site fMRI studies of task-based and resting state brain activity is feasible.
Keywords: Blood oxygen level dependent; Finger tapping; Functional magnetic resonance imaging; Pseudo-continuous arterial spin labeling; Resting state functional connectivity; Test–retest reliability.
© 2022. The Author(s).
Conflict of interest statement
The authors certify that they have no financial or nonfinancial competing interests.
Figures
References
-
- Forster BB, MacKay AL, Whittall KP, Kiehl KA, Smith AM, Hare RD, Liddle PF. Functional magnetic resonance imaging: the basics of blood-oxygen-level dependent (BOLD) imaging. Can Assoc Radiol J. 1998;49(5):320–329. - PubMed
-
- Schwarz AJ, Becerra L, Upadhyay J, Anderson J, Baumgartner R, Coimbra A, Evelhoch J, Hargreaves R, Robertson B, Iyengar S, Tauscher J, Bleakman D, Borsook D. A procedural framework for good imaging practice in pharmacological fMRI studies applied to drug development #1: processes and requirements. Drug Discov Today. 2011;16(13–14):583–593. doi: 10.1016/j.drudis.2011.05.006. - DOI - PubMed
Publication types
MeSH terms
Substances
LinkOut - more resources
Full Text Sources
Medical
