. 2022 Apr 2;20(1):178.
doi: 10.1186/s12951-022-01373-1.

Bacteria-driven hypoxia targeting delivery of chemotherapeutic drug proving outcome of breast cancer

Affiliations

Bacteria-driven hypoxia targeting delivery of chemotherapeutic drug proving outcome of breast cancer

Susu Xiao et al. J Nanobiotechnology. .

Abstract

Local hypoxia is a common feature of many solid tumors and may lead to unsatisfactory chemotherapy outcomes. Anaerobic bacteria that have an affinity to hypoxic areas can be used to achieve targeted drug delivery in tumor tissues. In this study, we developed a biocompatible bacteria/nanoparticles biohybrid (Bif@DOX-NPs) platform that employs the anaerobic Bifidobacterium infantis (Bif) to deliver adriamycin-loaded bovine serum albumin nanoparticles (DOX-NPs) into breast tumors. The Bif@DOX-NPs retained the targeting ability of B. infantis to hypoxic regions, as well as the cytotoxicity of DOX. The biohybrids were able to actively colonize the hypoxic tumors and significantly increased drug accumulation at the tumor site. The DOX concentration in the tumor masses colonized by Bif@DOX-NPs was 4 times higher than that in the free DOX-treated tumors, which significantly prolonged the median survival of the tumor-bearing mice to 69 days and reduced the toxic side-effects of DOX. Thus, anaerobic bacteria-based biohybrids are a highly promising tool for the targeted treatment of solid tumors with inaccessible hypoxic regions.

Keywords: Albumin nanoparticles; Bifidobacterium infantis; Biohybrid; Breast cancer; Tumor hypoxia.


Conflict of interest statement

The authors declare that they have no known competing financial interests or personal relationships that could have appeared to influence the work reported in this paper.

Figures

Scheme 1
Scheme 1
Schematic diagram on the synthesis of bacterial nanohybrids and their treatment of tumors
Fig. 1
Fig. 1
Characterization of DOX-NPs and Bif@DOX-NPs. A Morphological features of BSA-NPs (uncoated albumin nanoparticles) and DOX-NPs (albumin nanoparticles encapsulated with adriamycin) captured by TEM. Scale bar, 100 nm. a: BSA-NPs; b: DOX-NPs. Average particle size of BSA-NPs and DOX-NPs (n = 3). C Particle size stability of DOX-NPs in DMEM, NS and DW. DMEM Dulbecco's modified eagle medium, NS sanitary saline, DW double-distilled water. D SEM images of naked Bif (a) and Bif@DOX-NPs (b). Scale bar, 1 μm. E Fluorescence spectroscopy analysis of Bif, DOX-NPs and Bif@DOX-NPs. F SDS-PAGE protein analysis of Bif, BSA-NPs and Bif@BSA-NPs, samples were stained with Coomassie Brilliant. G Flow cytometry analysis of Bif and Bif@DOX-NPs. H The relative mean fluorescence intensity (MFI) measured by flow cytometry analysis (n = 3). Asterisks indicate significant differences (****P < 0.0001)
Fig. 2
Fig. 2
Characterization of Bif@DOX-NPs (Bifidobacterium infantis and adriamycin nanoparticle-bound hybrids). A CLSM image analysis of the linkage of FITC-labelled Bif and adriamycin nanoparticles prepared from three different nanomaterials (BSA, human serum albumin and keratin). The adriamycin nanoparticles synthesized from the three materials are indicated by BSA-NPs, HSA-NPs, and KER-NPs respectively. The rightmost graph shows the fluorescence co-localization analysis of the three bacterial nanohybrids (Bif@BSA-NPs, Bif@HSA-NPs, Bif@KER-NPs). B In vitro release profile of DOX, DOX-NPs in PBS at pH 7.4 and Bif@DOX-NPs at pH 5.0, 6.0 and 7.4 (n = 3, mean ± SD). C Anaerobic incubation of Bif and Bif@DOX-NPs for 24 h and counting the number of bacteria in (D). Data are presented as mean ± SD (n = 3). (ns: no statistical significance)
Fig. 3
Fig. 3
Cellular uptake and cytotoxicity. A The fluorescence microscopy microscopic images of DOX and DOX-NPs uptake by 4T1 cells. B Flow cytometry analysis of DOX and DOX-NPs uptake by 4T1 cells and C The relative mean fluorescence intensity (MFI) corresponding to flow cytometry analysis. Data are presented as mean ± SD (n = 3, ***P < 0.001). D The cytotoxicity of BSA-NPs on 4T1 cells (n = 6). E The cytotoxicity of DOX, DOX-NPs and Bif@DOX-NPs on 4T1 cells. Data are presented as mean ± SD (n = 3, *P < 0.05, **P < 0.01, ***P < 0.001, ****P < 0.0001). F Flow cytometry analysis of apoptosis rates of liver cells (LO2) and lung cells (BEAS-2B) induced by Bif. Data are presented as mean ± SD (n = 3, ns no statistical significance)
Fig. 4
Fig. 4
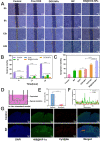
In vitro invasiveness and cytotoxicity of various treatments on 4T1 cells. A Wound healing. B The healing rate of Control, DOX, DOX-NPs, Bif and Bif@DOX-NPs at 6, 12 and 24 h. C Flow cytometry analysis of apoptosis rates of 4T1 cells induced by different preparation groups. D Schematic illustration of the hypoxia simulation model using a Transwell system to evaluate the chemotaxis of Bif@DOX-NPs. E Number of bacteria migrating to the bottom chamber. F Bif@DOX-NPs and hypoxic zone co-localization in vivo. Hypoxic zone was stained green with 488@HIF-1α (Anaerobic induction factors labelled with Alexa Fluor 488), and Bif was stained red with Cy3@Ab (Bifidobacterium infantis antibodies labelled with Cy3). (G) Fluorescence co-localization analysis of Bif@DOX-NPs and hypoxic zone. Results are expressed as mean ± SD (n = 3, ns no statistical significance, *P < 0.05, ***P < 0.001, ****P < 0.0001)
Fig. 5
Fig. 5
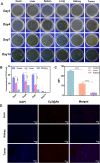
In vivo biodistribution of Bif@DOX-NPs. A Homogenates of tumor tissues and the five organs were cultured on agar plates under an anaerobic environment at 37 ℃. B Bacterial growth was measured on days 1, 4, 7, and 14. C The relative mean fluorescence intensity (MFI) of Cy3@Ab in tumor, liver and lung. D Indirect observation of bifidobacterial localization in tumors, liver and lungs with Cy3@Ab. Data are presented as mean ± SD (n = 3, ****P < 0.0001)
Fig. 6
Fig. 6
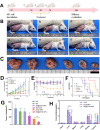
Anti-tumor activity of Bif@DOX-NPs against 4T1 tumors in mice. Tumor growth curves (D), body weight curves (E) and survival curves (F) of mice receiving different therapeutic regimens as shown in panel A (n = 6, **P < 0.01, ****P < 0.0001). B Representative photos of 4T1 tumor-bearing mice on the 14th day after various treatments. a: Control, b: Bif, c: Bif@BSA-NPs, d: DOX + Bif, e: DOX-NPs, f: Bif@DOX-NPs. C Representative photographs of isolated tumors. a to f means the same group as above. G The tumor volume of mice during different treatments at 14 d. H In vivo drug concentration distribution. Results are expressed as mean ± SD (n = 3, ***P < 0.001, ****P < 0.0001)
Fig. 7
Fig. 7
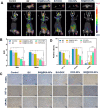
Micro-PET/CT imaging and immunohistochemical analysis of tumor tissues after various treatments. A The images of 18F-FDG PET/CT scanning in mice on the 14th day after various treatments. B SUVmax and SUVmean values for various groups. C Representative micrographs of tumor tissue stained by TUNEL and immunohistochemistry to detect cleaved HIF-1α and SPARC in tumors. Scale bar, 50 μm. D The positive expression rates of TUNEL, HIF-1α and SPARC in tumor. Results are expressed as mean ± SD (n = 3). Asterisks indicate significant differences (ns: no statistical significance, *P < 0.05, ***P < 0.001, ****P < 0.0001)
Fig. 8
Fig. 8
In vivo biocompatibility evaluation. A Hematoxylin and eosin staining of tumor tissues and major organs (including heart, liver, spleen, lung and kidney) after treatment as indicated. Scale bar, 50 μm. B Masson staining of heart after treatment as indicated. Scale bar, 50 μm

Similar articles

Cited by

References

    1. Brown J, Wilson W. Exploiting tumour hypoxia in cancer treatment. Nat Rev Cancer. 2004;4:437–447. - PubMed
    1. Han K, Wang S, Lei Q, Zhu J, Zhang X. Ratiometric biosensor for aggregation-induced emission-guided precise photodynamic therapy. ACS Nano. 2015;9:10268–10277. - PubMed
    1. Liu S, Minton N, Giaccia A, Brown J. Anticancer efficacy of systemically delivered anaerobic bacteria as gene therapy vectors targeting tumor hypoxia/necrosis. Gene Ther. 2002;9:291–296. - PubMed
    1. Yu Y, Shabahang S, Timiryasova T, Zhang Q, Beltz R, Gentschev I, Goebel W, Szalay A. Visualization of tumors and metastases in live animals with bacteria and vaccinia virus encoding light-emitting proteins. Nat Biotechnol. 2004;22:313–320. - PubMed
    1. Broadway K, Suh S, Behkam B, Scharf B. Optimizing the restored chemotactic behavior of anticancer agent Salmonella enterica serovar Typhimurium VNP20009. J Biotechnol. 2017;251:76–83. - PubMed