. 2022 Apr 15:471:153173.
doi: 10.1016/j.tox.2022.153173. Epub 2022 Mar 31.

The Nrf1 transcription factor is induced by patulin and protects against patulin cytotoxicity

Affiliations

The Nrf1 transcription factor is induced by patulin and protects against patulin cytotoxicity

John J W Han et al. Toxicology. .

Abstract

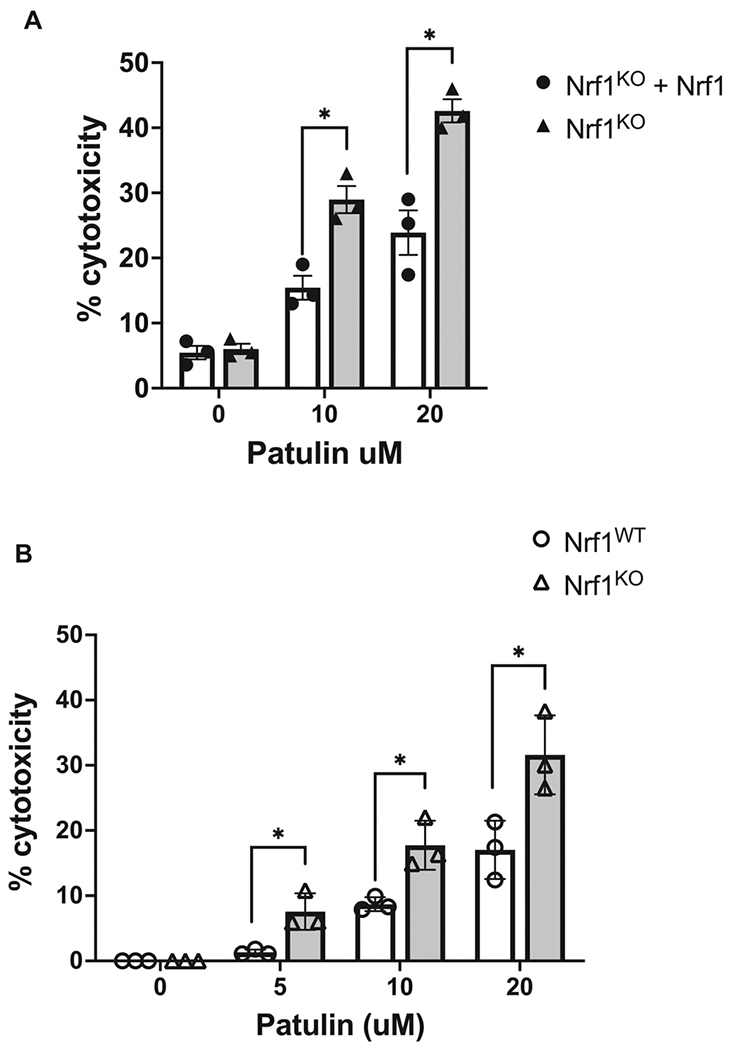
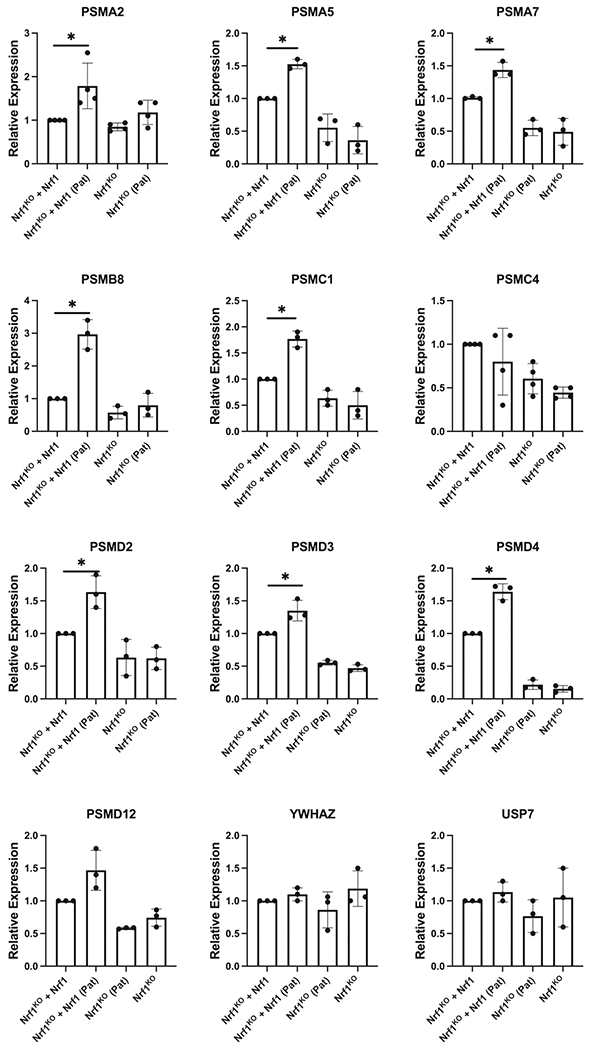
Patulin is a mycotoxin produced by a variety of molds that is found in various food products. The adverse health effects associated with exposure to patulin has led to many investigations into the biological basis driving the toxicity of patulin. Nevertheless, the mechanisms through which mammalian cells resists patulin-mediated toxicity is poorly understood. Here, we show that loss of the Nrf1 transcription factor renders cells sensitive to the acute cytotoxic effects of patulin. Nrf1 deficiency leads to accumulation of ubiquitinated proteins and protein aggregates in response to patulin exposure. Nrf1 expression is induced by patulin, and activation of proteasome genes by patulin is Nrf1-dependent. These findings suggest the Nrf1 transcription factor plays a crucial role in modulating cellular stress response against patulin cytotoxicity.

Keywords: Cellular stress; Mycotoxin; Nrf1; Protein homeostasis; Transcription factor.


Conflict of interest statement

Declaration of Competing Interest

The authors declare that they have no known competing financial interests or personal relationships that could have appeared to influence the work reported in this paper.

Figures

Fig. 1.
Fig. 1.
Nrf1 knockout cells show enhanced sensitivity to patulin-induced cytotoxicity. (A) Nrf1−/− and Nrf1−/− MEF cells complemented with Nrf1a cDNA were cultured with the indicated concentration of patulin. After 24 h, trypan blue dye exclusion assays were done. Percent dead cells was calculated as (dead cells/dead cells + live cells) x 100%. Data represents means ± SD for 3 independent experiments. Statistical analysis was done using Student’s t-test (*) represents p < 0.05. (B) Nrf1 wild type and Nrf1 knockout HEK293 cells were treated with the indicated concentration of patulin. After 24 h, LDH-WST assays were done. Percent cytotoxicity was calculated as (sample – negative control/positive control - negative control) x 100%. Data represents means ± SD for 3 independent experiments each containing 8 replicates. Statistical analysis was done using Student’s t-test (*) represents p < 0.05.
Fig. 2.
Fig. 2.
Patulin induces accumulation of ubiquitinated proteins and aggresomes in Nrf1 deficient cells. (A) Representative western blot showing total ubiquitin-bound proteins in Nrf1 knockout MEF cells and knockout cells rescued with Nrf1a, at basal conditions and following treatment with 4 μM or 8uM patulin for 24 h. Whole-cell lysates were subjected to western blotting using anti-TCF11 antibody (top panel), anti-ubiquitin (middle panel) and anti-alpha-tubulin (bottom panel). The anti-TCF11 antibody recognizes the long isoforms of Nrf1 (TCF11 and Nrf1a). The band migrating above 130 kDa corresponds to membrane localized proteins (open arrowhead), while the band migrating below 130 kDa corresponds to membrane-free Nrf1 (filled arrowhead). Western blot against alpha-tubulin was used for protein loading control. (B) Bar graph shows densitometric analysis of ubiquitin immunoblots normalized to alpha-tubulin. Values are expressed in arbitrary units, and presented as mean ± SD. Data were analyzed using Student’s t-test, (*P < 0.05). (C) Western blot showing ubiquitin-bound proteins in wild type and Nrf1 knockout HEK293 cells, at basal conditions and following treatment with 4 μM or 8uM patulin for 24 h. Whole-cell lysates were subjected to western blotting using anti-TCF11 antibody (top panel), anti-ubiquitin (middle panel) and anti-alpha-tubulin (bottom panel). (D) Cells were incubated for 24 h with 4 μM patulin or vehicle control, fixed and then stained with ProteoStat dye. The nuclei were stained with DAPI (blue). Representative images are shown. (E) Box plots of ProteoStat staining in cells. Data are mean ± SD of 2 independent experiments. Corrected total cell fluorescence (CTCF) calculations were done using images from 3 to 4 different high-power fields each containing at least 10 cells/condition. Data were analyzed using Student’s t-test, (*P < 0.05).
Fig. 3.
Fig. 3.
Patulin activates Nrf1 expression. (A) HEK293 cells were treated for 2 h with vehicle or with the indicated concentration of patulin. Cell lysates were then prepared and immunoblotted for Nrf1 using anti-TCF11 antibody which recognizes the TCF11 and Nrf1a isoforms. Membrane form (open arrowhead) of TCF11/Nrf1a are seen as multiple bands migrating above 130 kDa and membrane-free forms (filled arrowhead) are seen as bands migrating below 130 kDa. Western blotting against alpha-tubulin was used for protein loading control. (B) HEK293 cells were treated with 4 μM patulin, and cell lysates were prepared at the indicated time points for western blotting with anti-TCF11 and alpha-tubulin antibodies. Histograms showing the quantification of TCF11/Nrf1a relative to total α-tubulin in HEK203 cells. Density values are expressed in arbitrary units (AUs), and data are mean ± SD (n = 3 replicates), one-way ANOVA, *P < 0.05. Dose response of patulin-induced TCF11/Nrf1a protein expression in (C) HCT116 and (D) MEF cells after 2 h of culture.
Fig. 4.
Fig. 4.
Patulin upregulates the proteasome pathway through Nrf1. Nrf1−/− MEF cells, or Nrf1−/− expressing Nrf1a were cultured with vehicle control or 2uM patulin. After 16 h, RNA was extracted and analyzed for expression of known Nrf1 target genes. Dot-plots depict relative expression of indicated genes. P values were calculated by Student’s t-test (n = 3), (*) indicates p < 0.05.

References

    1. Baird L, Yamamoto M, 2020. The molecular mechanisms regulating the KEAP1-NRF2 pathway. Mol. Cell Biol 40 (13) 10.1128/MCB.00099-20. - DOI - PMC - PubMed
    1. Biswas M, Kwong EK, Park E, Nagra P, Chan JY, 2013. Glycogen synthase kinase 3 regulates expression of nuclear factor-erythroid-2 related transcription factor-1 (Nrf1) and inhibits pro-survival function of Nrf1. Exp. Cell Res 319 (13), 1922–1931. 10.1016/j.yexcr.2013.04.013. - DOI - PMC - PubMed
    1. Boussabbeh M, Ben Salem I, Prola A, Guilbert A, Bacha H, Abid-Essefi S, Lemaire C, 2015. Patulin induces apoptosis through ROS-mediated endoplasmic reticulum stress pathway. Toxicol. Sci 144 (2), 328–337. 10.1093/toxsci/kfu319. - DOI - PubMed
    1. Ciechanover A, Kwon YT, 2015. Degradation of misfolded proteins in neurodegenerative diseases: therapeutic targets and strategies. Exp. Mol. Med 47, e147 10.1038/emm.2014.117. - DOI - PMC - PubMed
    1. Dantuma NP, Lindsten K, 2010. Stressing the ubiquitin-proteasome system. Cardiovasc. Res 85 (2), 263–271. 10.1093/cvr/cvp255. - DOI - PubMed