. 2022 Jun:60:101483.
doi: 10.1016/j.molmet.2022.101483. Epub 2022 Mar 31.

Fibroblast growth factor 19 stimulates water intake

Affiliations

Fibroblast growth factor 19 stimulates water intake

José Ursic-Bedoya et al. Mol Metab. 2022 Jun.

Abstract

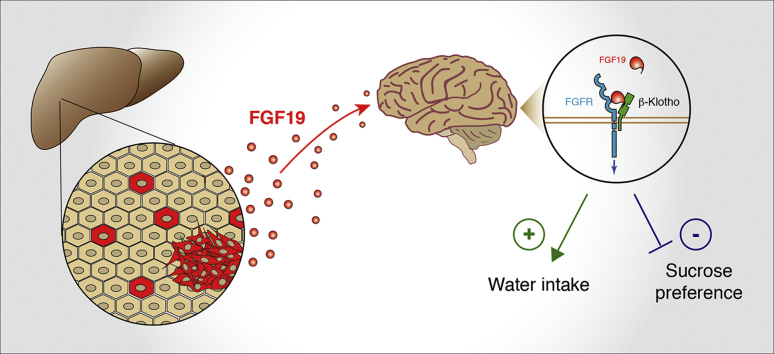
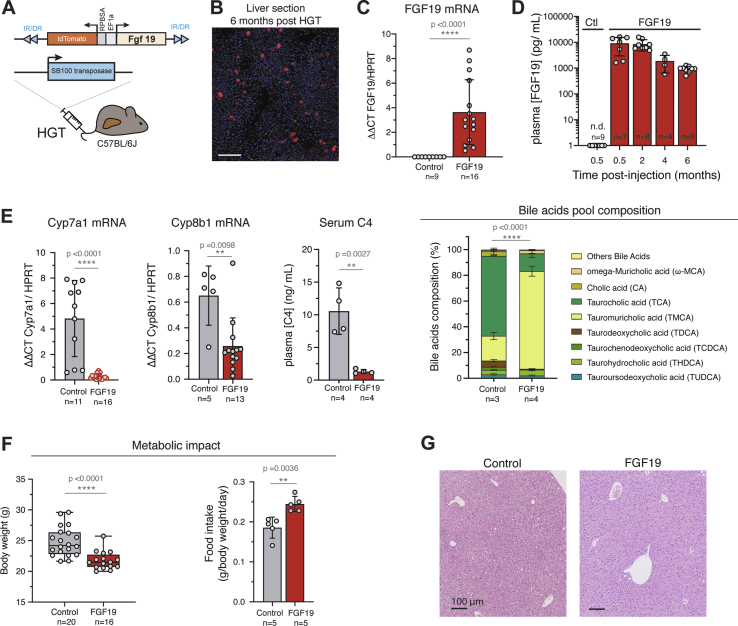
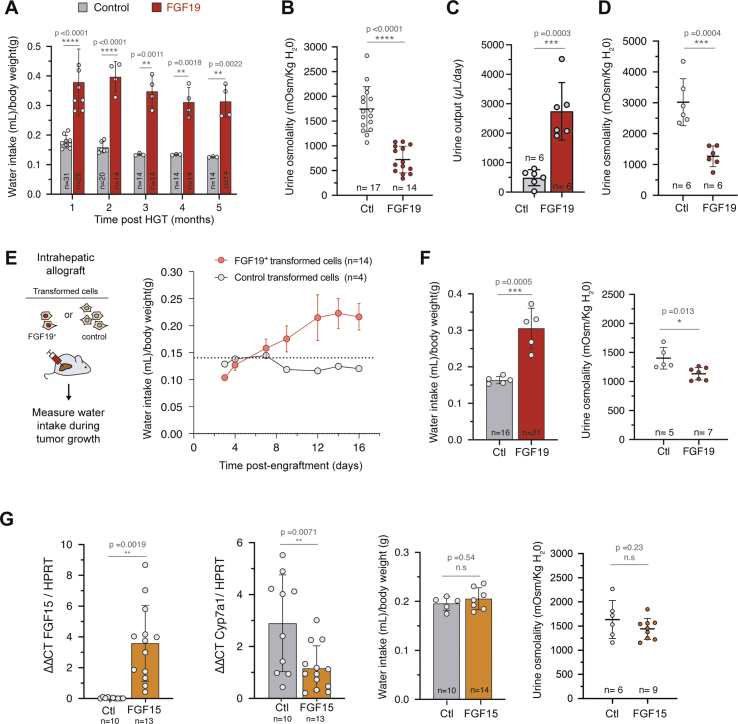
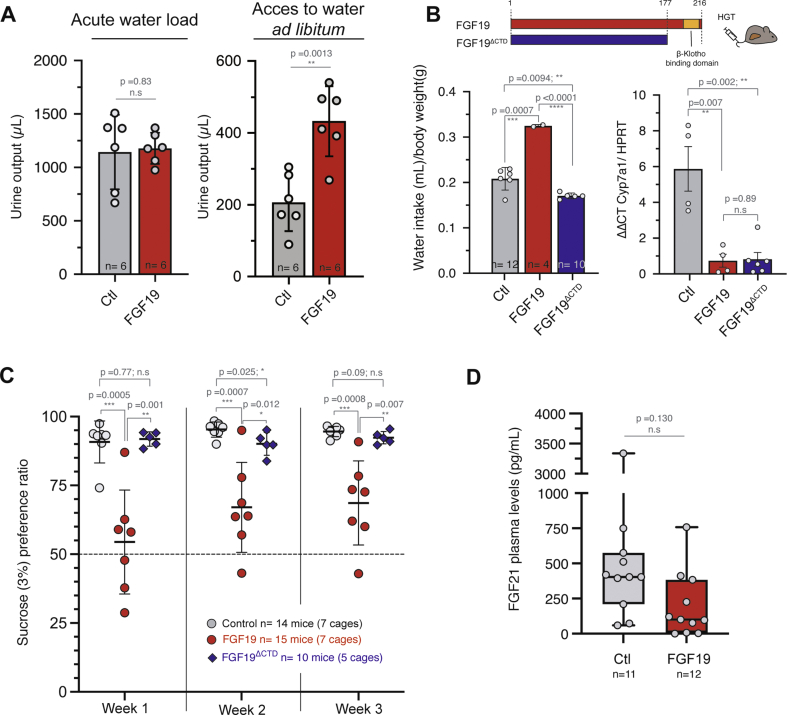
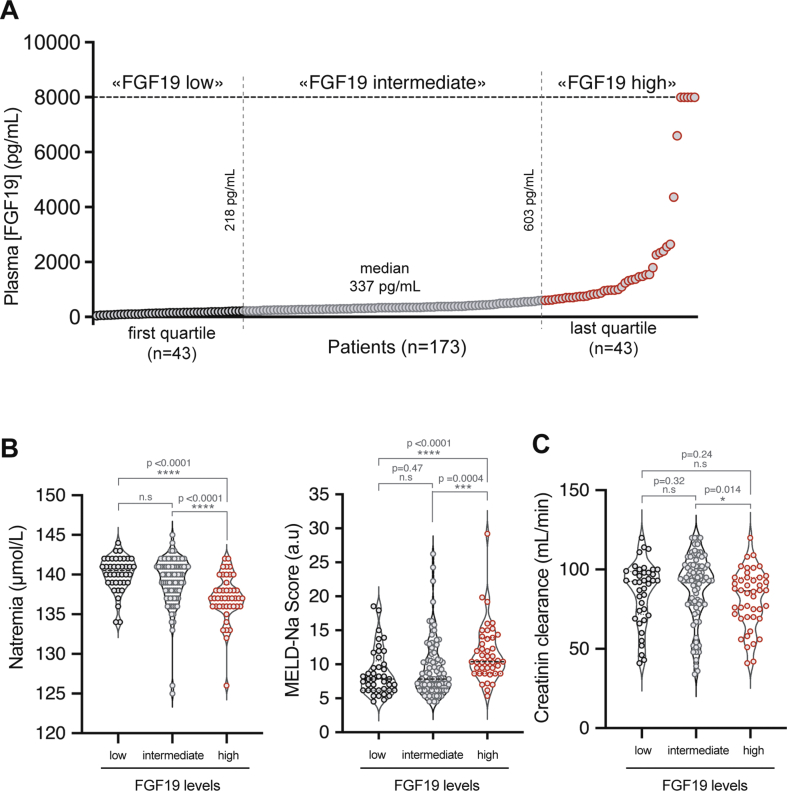
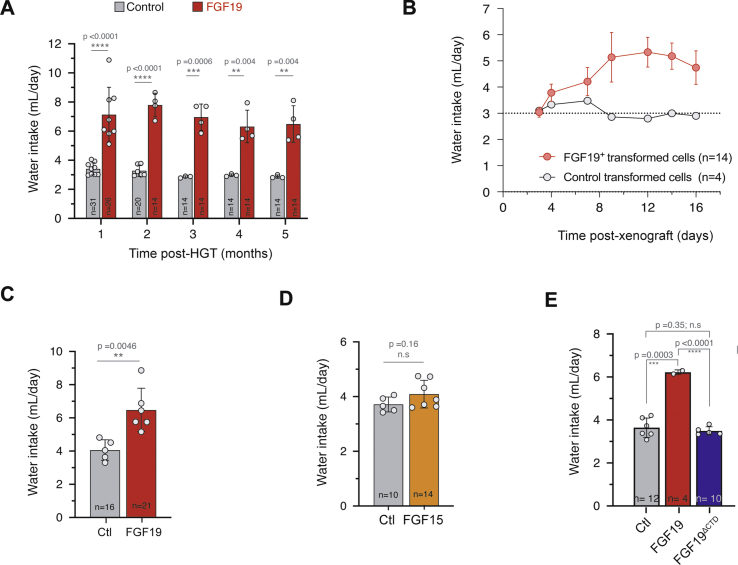
Fibroblast growth factor 19 (FGF19) is a hormone with pleiotropic metabolic functions, leading to ongoing development of analogues for treatment of metabolic disorders. On the other hand, FGF19 is overexpressed in a sub-group of hepatocellular carcinoma (HCC) patients and has oncogenic properties. It is therefore crucial to precisely define FGF19 effects, notably in the context of chronic exposure to elevated concentrations of the hormone. Here, we used hydrodynamic gene transfer to generate a transgenic mouse model with long-term FGF19 hepatic overexpression. We describe a novel effect of FGF19, namely the stimulation of water intake. This phenotype, lasting at least over a 6-month period, depends on signaling in the central nervous system and is independent of FGF21, although it mimics some of its features. We further show that HCC patients with high levels of circulating FGF19 have a reduced natremia, indicating dipsogenic features. The present study provides evidence of a new activity of FGF19, which could be clinically relevant in the context of FGF19 overexpressing cancers and in the course of treatment of metabolic disorders by FGF19 analogues.

Keywords: Endocrine; FGFR4; Hepatocellular carcinoma; Hydrodynamic gene transfer; Liver.


Figures

Image 1
Graphical abstract
Figure 1
Figure 1
In vivo stable transfection of hepatocytes with FGF19 leads to long term secretion of biologically active FGF19. A. Mouse model strategy based on hydrodynamic gene transfer (HGT). Empty vector expressing only dTomato («Control») are used as control. B. Cryosection of liver 6 months after HGT, showing stably transfected hepatocytes that express dTomato. Scale bar: 100 μm. C. qPCR quantification of FGF19 mRNA in control and FGF19 transfected livers 6 months post injection. Plasmids combined with transposase used for HGT are indicated: control-dTomato («Ctl») and FGF19-dTomato («FGF19»). Data are presented as mean ± SD. Mann-Whitney test p-values are shown. D. Plasma levels of FGF19 detected by ELISA. The number of mice analyzed for each time point is indicated. Data are presented as mean ± SD, with statistical significance of Mann-Whitney test shown. E. qPCR quantification of mRNA expression of Cyp7a1 and Cyp8b1, target genes of FGF19/FGFR4 pathway; Serum 7 α-hydroxy-4-cholesten-3-one (C4) levels, serum biomarker of bile acid synthesis and biliary bile acids pool composition. All data are presented as mean ± SD. Unpaired Student's t-test p-values and significance are shown unless for bile acids composition, for which two-way ANOVA test significance is shown. F. Body weight of control and FGF19 HGT mice at 6 months (left panel). Food intake of control and FGF19 HGT mice first month following HGT (right panel). Data are presented as mean ± SD. Unpaired Student's t-test p-values and significance are shown. G. HES staining of liver sections of control and FGF19 HGT mice after 6 months, showing no visible alteration on liver morphology. ∗p ≤ 0.05, ∗∗p < 0.01, ∗∗∗p < 0.001, ∗∗∗∗p < 0.0001. N.s: not significant. n. d: not detectable.
Figure 2
Figure 2
FGF19 increases water intake and urine output. A. Water consumption of control and FGF19+ female mice. The number of mice analyzed for each time point is indicated and each dot represents the mean value of an independent cage over one month. B. Urine osmolality of control and FGF19+ female mice at 3 months post HGT. C. Daily urine output in female mice housed in metabolic cages. D. Urine osmolality of control and FGF19+ female mice housed in metabolic cages. E. Daily water consumption of female mice following intrahepatic allograft of FGF19+ (MYC-sgTrp53-FGF19) and control (MYC-sgTrp53) cell lines. Mean water consumption is shown, corresponding to 14 mice (3 cages) or 4 mice (1 cage), as indicated. Dotted line represents the mean consumption of C57Bl/6J mice on the same period in the animal facility (n = 15). F. Effect of FGF19 overexpression on daily water intake and urine osmolality on male mice 1 month post HGT. G. qPCR quantification of FGF15 and Cyp7a1 mRNA (left panels) in livers of female mice injected with FGF15-BFP (FGF15) or BFP plasmid (control, Ctl). Daily water consumption and urine osmolality (right panels) of FGF15 or control female mice 1 month post HGT, normalized by the body weight. In (A–G): data are presented as mean ± SD. For water intake mesures, each dot represents the mean value of an independent cage with two to five mice. For all panels, unpaired t-test statistical significance is indicated. ∗p ≤ 0.05, ∗∗p < 0.01, ∗∗∗p < 0.001, ∗∗∗∗p < 0.0001. n. s: not significant.
Figure 3
Figure 3
FGF19 regulates water homeostasis through central regulation. A. Urine output and urine osmolality 6 h after acute water load or free acces to water. n = 6 mice per group. B. Schematic diagram showing FGF19 and FGF19ΔCTD. The deleted sequence contains water consumption of female mice with hydrodynamic injection of control, FGF19, or FGF19Δ (AA 1-177). Mean consumption over the first month after injection is shown. Each dot represents one cage with two animals. Total number of animals in each group is indicated. qPCR quantification of mRNA expression of Cyp7a1. Data are presented as mean ± SD, and unpaired Student's t-test p-values indicated. C. Sucrose (3%) preference ratio in double-bottle experiment. Experiments were carried out at least one month after the hydrodynamic injection. Each dot represents the mean of two to three measures over a week for a cage containing two animals. The total number of animals is indicated. D. FGF21 plasma levels determined by ELISA in control and FGF19 HGT mice. Number of animals is indicated. Data are presented as mean ± SD, and unpaired Student's t-test p-values indicated. ∗p ≤ 0.05, ∗∗p ≤ 0.01, ∗∗∗p ≤ 0.001, ∗∗∗∗p ≤ 0.0001. n. s: not significant. ∗∗∗p ≤ 0.0001. n. s: not significant.
Figure 4
Figure 4
Increased FGF19 in hepatocellular carcinoma patients is associated with disturbances of the hydrosodic balance . A. Serum FGF19 distribution in a cohort of 173 patients with advanced HCC (FGF19 measured by ELISA). Median value and values at transitions between low, intermediate and high groups are indicated. B. Natremia (left panel) and MELD-Na score (right panel) in patients of the cohort according to the plasma FGF19 concentration C. Creatinin clearance in patients of the cohort according to the plasma FGF19 concentration. Mann Whitney test significance is indicated. ∗p ≤ 0.05, ∗∗p ≤ 0.01, ∗∗∗p ≤ 0.001, ∗∗∗∗p ≤ 0.0001. n. s: not significant.
Multimedia component 1
Supplementary Figure 1
FGF19 overexpression modulate bile acid (BA) pool composition and hydrophobicity in the bile. Bile acids measurements were performed on mouse bile by high performance liquid chromatography-tandem mass spectrometry. The data presented here correspond to a detailed presentation of data presented in Figure 1E right panel A. Relative abundance of primary BA as a percentage of total BA concentrations. B. Relative abundance of secondary BA as a percentage of total BA concentrations. C. Bile hydrophobicity index in control and FGF19 mice. All unpaired t test. Mean +/- SD. N.s: not significant. n.d: not detectable. Abbreviations: CA, cholic acid; CDCA, chenodeoxycholic acid; DCA, deoxycholic acid; MCA, muricholic acid; HDCA, hyodeoxycholic acid. D. Bile acids concentration in bile of control and FGF19 overexpressing mice. Mean, SD and Mann-Whitney test statistical significance are shown.
Multimedia component 2
Supplementary Figure 2
Water intake experiments with non normalized representation. As FGF19 overexpression affects body weight, values of water intake corresponding to 2A (A), 2E (B), 2F (C), 2G (D), 3B (E), are shown as non normalized by body weight. Note that results are comparable with and without normalization.

References

    1. Angelin B., Larsson T.E., Rudling M. Circulating fibroblast growth factors as metabolic regulators - a critical appraisal. Cell Metabolism. 2012;16(6):693–705. doi: 10.1016/j.cmet.2012.11.001. - DOI - PubMed
    1. Gadaleta R.M., Moschetta A. Metabolic Messengers: fibroblast growth factor 15/19. Nature Metabolism. 2019;1(6):588–594. doi: 10.1038/s42255-019-0074-3. - DOI - PubMed
    1. Inagaki T., Choi M., Moschetta A., Peng L., Cummins C.L., McDonald J.G., et al. Fibroblast growth factor 15 functions as an enterohepatic signal to regulate bile acid homeostasis. Cell Metabolism. 2005;2(4):217–225. doi: 10.1016/j.cmet.2005.09.001. - DOI - PubMed
    1. Schaap F.G., van der Gaag N.A., Gouma D.J., Jansen P.L.M. High expression of the bile salt-homeostatic hormone fibroblast growth factor 19 in the liver of patients with extrahepatic cholestasis. Hepatology. 2009;49(4):1228–1235. doi: 10.1002/hep.22771. - DOI - PubMed
    1. Wunsch E., Milkiewicz M., Wasik U., Trottier J., Kempialska-Podhorodecka A., Elias E., et al. Expression of hepatic fibroblast growth factor 19 is enhanced in primary biliary cirrhosis and correlates with severity of the disease. Scientific Reports. 2015;5(March):1–13. doi: 10.1038/srep13462. - DOI - PMC - PubMed

Publication types

MeSH terms

Substances