

Predicted leukocyte telomere length and risk of germ cell tumours
- PMID: 35368045
- PMCID: PMC9296514
- DOI: 10.1038/s41416-022-01798-3
Predicted leukocyte telomere length and risk of germ cell tumours
Abstract
Background: Genetically predicted leukocyte telomere length (LTL) has been evaluated in several studies of childhood and adult cancer. We test whether genetically predicted longer LTL is associated with germ cell tumours (GCT) in children and adults.
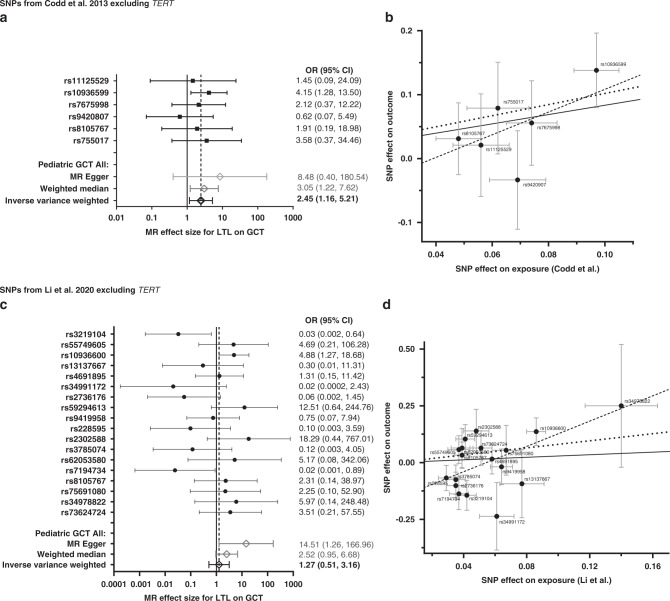
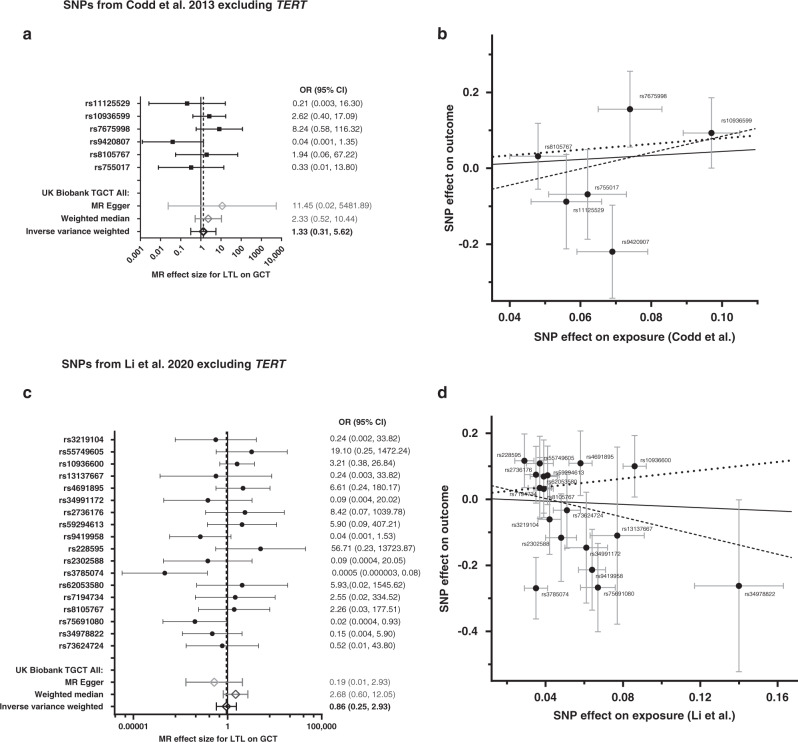
Methods: Paediatric GCT samples were obtained from a Children's Oncology Group study and state biobank programs in California and Michigan (N = 1413 cases, 1220 biological parents and 1022 unrelated controls). Replication analysis included 396 adult testicular GCTs (TGCT) and 1589 matched controls from the UK Biobank. Mendelian randomisation was used to look at the association between genetically predicted LTL and GCTs and TERT variants were evaluated within GCT subgroups.
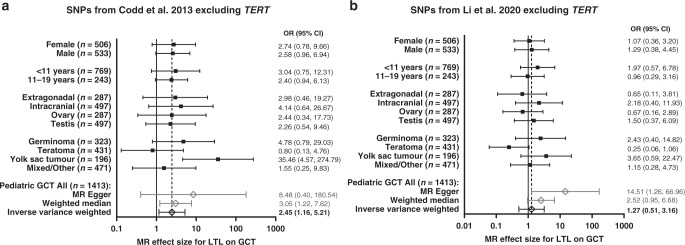
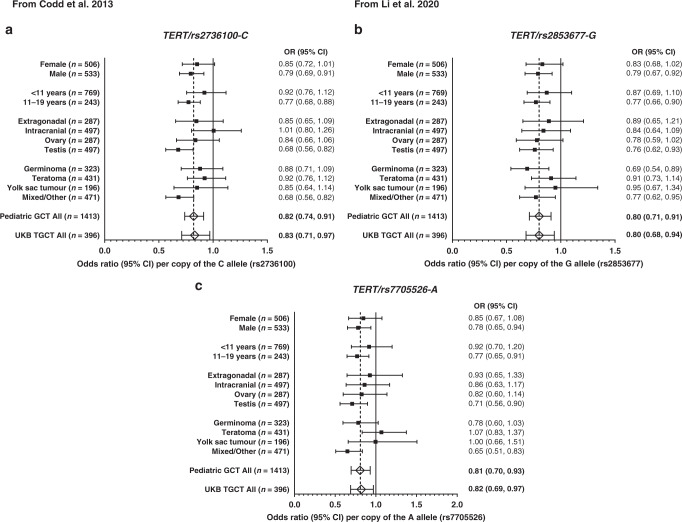
Results: We identified significant associations between TERT variants reported in previous adult TGCT GWAS in paediatric GCT: TERT/rs2736100-C (OR = 0.82; P = 0.0003), TERT/rs2853677-G (OR = 0.80; P = 0.001), and TERT/rs7705526-A (OR = 0.81; P = 0.003). We also extended these findings to females and tumours outside the testes. In contrast, we did not observe strong evidence for an association between genetically predicted LTL by other variants and GCT risk in children or adults.
Conclusion: While TERT is a known susceptibility locus for GCT, our results suggest that LTL predicted by other variants is not strongly associated with risk in either children or adults.
© 2022. The Author(s), under exclusive licence to Springer Nature Limited.
Conflict of interest statement
ALF has acted as a paid consultant for Decibel Therapeutics for work performed outside of the current study. The remaining authors declare no competing interests.
Figures
Similar articles
-
Genetically Inferred Telomere Length and Testicular Germ Cell Tumor Risk.Cancer Epidemiol Biomarkers Prev. 2021 Jun;30(6):1275-1278. doi: 10.1158/1055-9965.EPI-20-1775. Epub 2021 Mar 18. Cancer Epidemiol Biomarkers Prev. 2021. PMID: 33737296 Free PMC article.
-
Common genetic variations in telomere length genes and lung cancer: a Mendelian randomisation study and its novel application in lung tumour transcriptome.Elife. 2023 Apr 20;12:e83118. doi: 10.7554/eLife.83118. Elife. 2023. PMID: 37079368 Free PMC article.
-
Variants in BAK1, SPRY4, and GAB2 are associated with pediatric germ cell tumors: A report from the children's oncology group.Genes Chromosomes Cancer. 2017 Jul;56(7):548-558. doi: 10.1002/gcc.22457. Epub 2017 Apr 4. Genes Chromosomes Cancer. 2017. PMID: 28295819 Free PMC article.
-
Shorter Leukocyte Telomere Length coupled with lower expression of Telomerase Genes in patients with Essential Hypertension.Int J Med Sci. 2020 Aug 1;17(14):2180-2186. doi: 10.7150/ijms.48456. eCollection 2020. Int J Med Sci. 2020. PMID: 32922179 Free PMC article.
-
Long or short? Telomere length and pancreatic cancer and its precursor lesions, a narrative review.Mutagenesis. 2025 Mar 15;40(1):39-47. doi: 10.1093/mutage/gead034. Mutagenesis. 2025. PMID: 37976300 Review.
Cited by
-
Association between leucocyte telomere length and erectile dysfunction in US adults: a secondary study based on 2001-2002 NHANES data.BMJ Open. 2024 Apr 19;14(4):e077808. doi: 10.1136/bmjopen-2023-077808. BMJ Open. 2024. PMID: 38643009 Free PMC article.
-
Children's Oncology Group's 2023 blueprint for research: Epidemiology.Pediatr Blood Cancer. 2023 Sep;70 Suppl 6(Suppl 6):e30566. doi: 10.1002/pbc.30566. Epub 2023 Jul 14. Pediatr Blood Cancer. 2023. PMID: 37449937 Free PMC article.
-
Telomeres and telomerase in mesothelioma: Pathophysiology, biomarkers and emerging therapeutic strategies (Review).Int J Oncol. 2025 Mar;66(3):23. doi: 10.3892/ijo.2025.5729. Epub 2025 Feb 21. Int J Oncol. 2025. PMID: 39981889 Free PMC article. Review.
-
Predicted leukocyte telomere length and risk of myeloid neoplasms.Hum Mol Genet. 2023 Oct 4;32(20):2996-3005. doi: 10.1093/hmg/ddad126. Hum Mol Genet. 2023. PMID: 37531260 Free PMC article.
-
Telomere length and TERT polymorphisms as biomarkers in asbestos-related diseases.Radiol Oncol. 2024 Feb 21;58(1):87-98. doi: 10.2478/raon-2024-0009. eCollection 2024 Mar 1. Radiol Oncol. 2024. PMID: 38378028 Free PMC article.
References
Publication types
MeSH terms
Grants and funding
LinkOut - more resources
Full Text Sources
