. 2022 May 13;23(3):bbac092.
doi: 10.1093/bib/bbac092.

BiTSC 2: Bayesian inference of tumor clonal tree by joint analysis of single-cell SNV and CNA data

Affiliations

BiTSC 2: Bayesian inference of tumor clonal tree by joint analysis of single-cell SNV and CNA data

Ziwei Chen et al. Brief Bioinform. .

Abstract

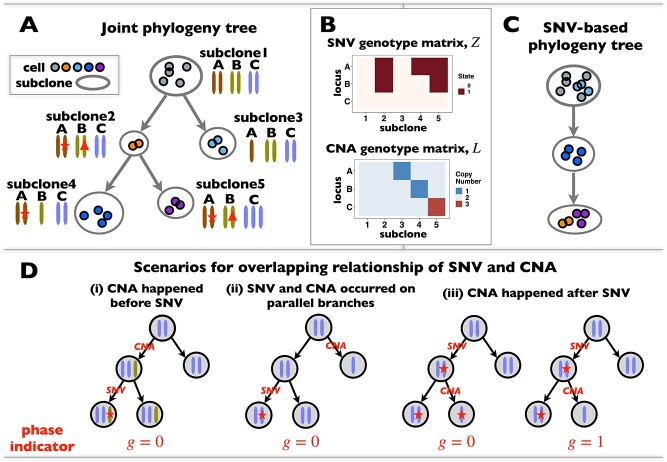
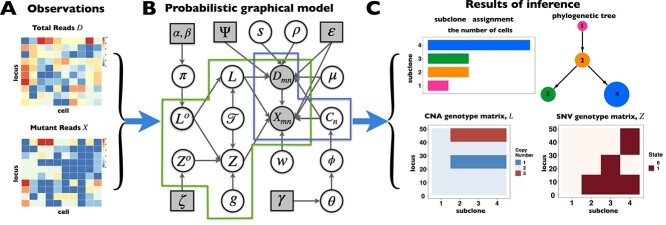
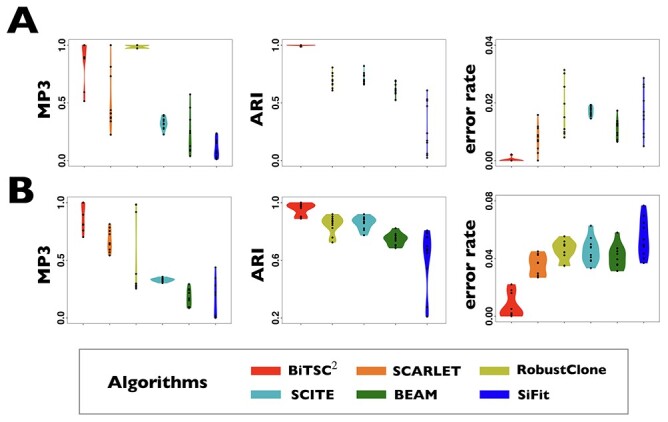
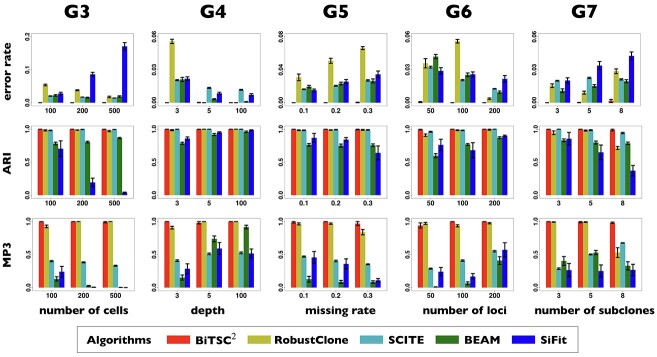
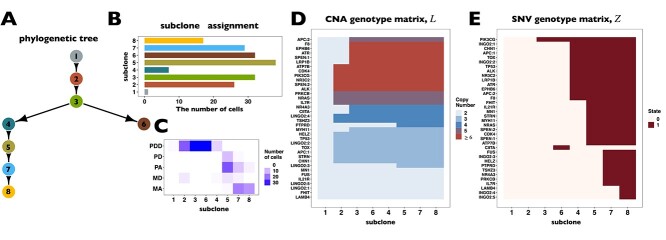
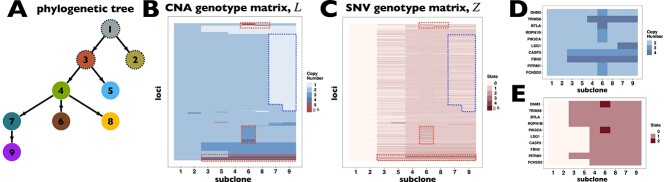
The rapid development of single-cell DNA sequencing (scDNA-seq) technology has greatly enhanced the resolution of tumor cell profiling, providing an unprecedented perspective in characterizing intra-tumoral heterogeneity and understanding tumor progression and metastasis. However, prominent algorithms for constructing tumor phylogeny based on scDNA-seq data usually only take single nucleotide variations (SNVs) as markers, failing to consider the effect caused by copy number alterations (CNAs). Here, we propose BiTSC$^2$, Bayesian inference of Tumor clonal Tree by joint analysis of Single-Cell SNV and CNA data. BiTSC$^2$ takes raw reads from scDNA-seq as input, accounts for the overlapping of CNA and SNV, models allelic dropout rate, sequencing errors and missing rate, as well as assigns single cells into subclones. By applying Markov Chain Monte Carlo sampling, BiTSC$^2$ can simultaneously estimate the subclonal scCNA and scSNV genotype matrices, subclonal assignments and tumor subclonal evolutionary tree. In comparison with existing methods on synthetic and real tumor data, BiTSC$^2$ shows high accuracy in genotype recovery, subclonal assignment and tree reconstruction. BiTSC$^2$ also performs robustly in dealing with scDNA-seq data with low sequencing depth and variant missing rate. BiTSC$^2$ software is available at https://github.com/ucasdp/BiTSC2.

Keywords: Bayesian modeling; cancer evolution; copy number alteration; intra-tumor heterogeneity; single nucleotide variation; single-cell DNA sequencing.


Figures

Figure 1
Figure 1
ScDNA-seq data display tumor heterogeneity. (A) Joint tumor phylogeny tree by SNV and CNA, where the gray node represents normal cells and the other nodes are cancerous cells. The letters A, B, and C are mutation loci. The bars under each letter represent alleles, and the bars with red stars and triangles are mutated. (B) The SNV genotype matrix, formula image, and the CNA genotype matrix, formula image, where rows represent loci and columns are subclones. (C) The phylogeny tree generally obtained by SNV-based algorithms. (D) Three possible scenarios for the overlapping relationship of SNV and CNA along the tree.
Figure 2
Figure 2
Overview of the computational framework of BiTSCformula image that identifies subclones, recovers subclonal genotypes of CNA and SNV, as well as reconstructs subclonal evolutionary trees using tumor scDNA-seq read count data. (A)The input of the algorithm, total reads matrix formula image and mutant reads matrix formula image. (B) The probabilistic graphical model shows the dependency among parameters, where the shade nodes stand for observed or fixed values, the unshaded nodes represent the latent parameters. (C) The inference output of the algorithm, mainly containing subclone assignment (formula image), subclonal phylogenetic tree (formula image), genotype matrix of CNA (formula image) and SNV (formula image), phase indicator formula image and other parameters, such as missing rate (formula image), ADO rate (formula image) and so on.
Figure 3
Figure 3
Comparison of performance on G1 and G2 for scSNV genotype recovery, subclone assignment and tree reconstruction. (A) The violin plot of BiTSCformula image with real segments as input, SCARLET with true CN tree and supported loss set as input, RobustClone, SCITE, BEAM and SiFit for error rate of recovered scSNV genotype matrix, ARI of subclone assignment and MP3 similarity on G1 dataset, where 0, 1 and 1 indicate best performance for error rate, ARI and MP3 similarity, respectively. (B) The violin plot of BiTSCformula image with real segments as input, SCARLET with true CN tree and supported loss set as input, RobustClone, SCITE, BEAM and SiFit for error rate of recovered scSNV genotype matrix, ARI of subclone assignment and MP3 similarity on G2 dataset, where 0, 1 and 1 indicate best performance for error rate, ARI and MP3 distance, respectively.
Figure 4
Figure 4
Comparison of detailed performance on G3-G7 for scSNV genotype recovery, subclone assignment and tree reconstruction among BiTSCformula image with real segments as input, RobustClone, SCITE, BEAM and SiFit, where 0, 1 and 1 indicate best performance for error rate, ARI and MP3 similarity, respectively.
Figure 5
Figure 5
BiTSCformula image reconstructs tumor phylogeny of metastatic colorectal cancer. (A) The phylogeny tree of metastatic colorectal cancer reconstructed by BiTSCformula image. (B) The subclone assignment. (C) The number of overlapped cells contained in subclones identified by BiTSCformula image and cells contained in the targeted region, where PD stands for Primary Diploid, PA stands for Primary Aneuploid, MD stands for Metastatic Diploid, and MA stands for Metastatic Aneuploid in [33]. (D) The CNA subclonal genotype matrix estimated by BiTSCformula image, where LINGO2: 1–5 represent different loci in the genomic region of LINGO2 on the chromosome, as well as SPEN:1-2 and APC:1-2. (E) The SNV subclonal genotype matrix estimated by BiTSCformula image.
Figure 6
Figure 6
BiTSCformula image reconstructs tumor phylogeny of breast cancer. (A) The phylogeny tree of breast cancer reconstructed by BiTSCformula image. (B) The CNA subclonal genotype matrix estimated by BiTSCformula image. (C) The SNV subclonal genotype matrix estimated by BiTSCformula image. (D) The CNA subclonal genotype matrix of 10 previously reported nonsynonymous mutations. (E) The SNV subclonal genotype matrix of 10 previously reported nonsynonymous mutations.

References

    1. Navin NE. Cancer genomics: one cell at a time. Genome Biol 2014;15(8):452. - PMC - PubMed
    1. Lawson DA, Kessenbrock K, Davis RT, et al. . Tumour heterogeneity and metastasis at single-cell resolution. Nat Cell Biol 2018;20(12):1349–60. - PMC - PubMed
    1. Gawad C, Koh W, Quake SR. Single-cell genome sequencing: current state of the science. Nat Rev Genet 2016;17, 175(3). - PubMed
    1. Navin N, Kendall J, Troge J, et al. . Tumour evolution inferred by single-cell sequencing. Nature 2011;472(7341):90. - PMC - PubMed
    1. Wang Y, Waters J, Leung ML, et al. . Clonal evolution in breast cancer revealed by single nucleus genome sequencing. Nature 2014;512(7513):155–60. - PMC - PubMed

Publication types