. 2022 Apr 4;79(4):220.
doi: 10.1007/s00018-022-04251-z.

Protrudin regulates FAK activation, endothelial cell migration and angiogenesis

Affiliations

Protrudin regulates FAK activation, endothelial cell migration and angiogenesis

Amita Arora et al. Cell Mol Life Sci. .

Abstract

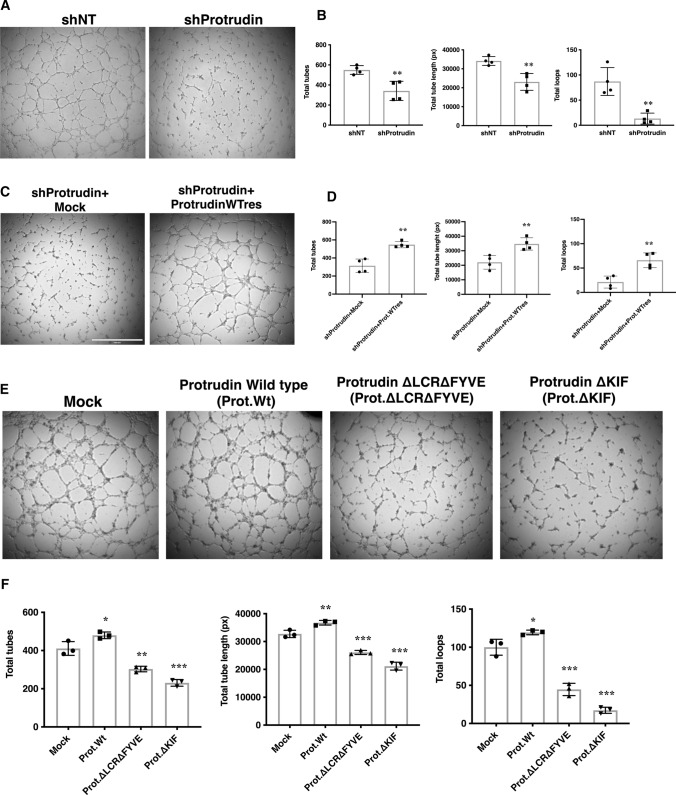
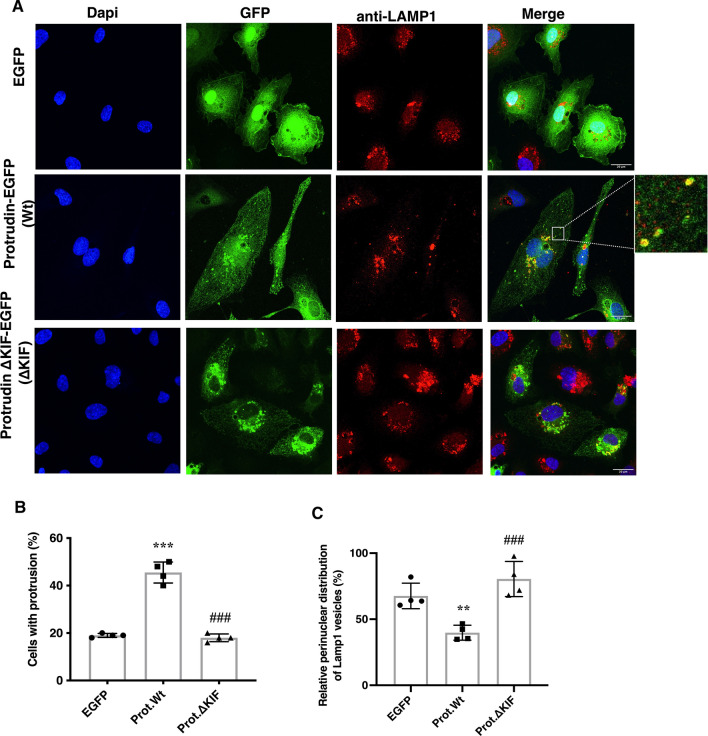
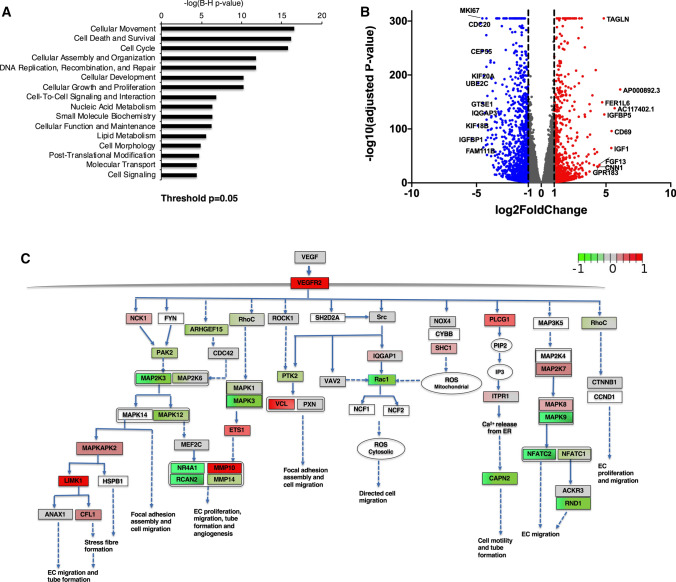
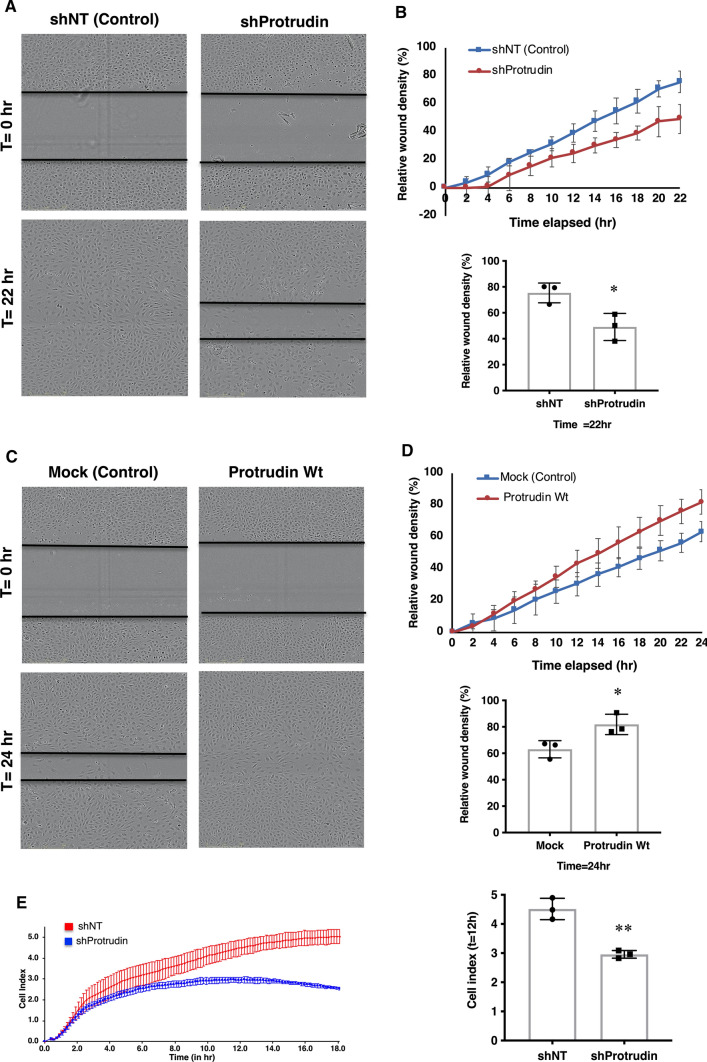
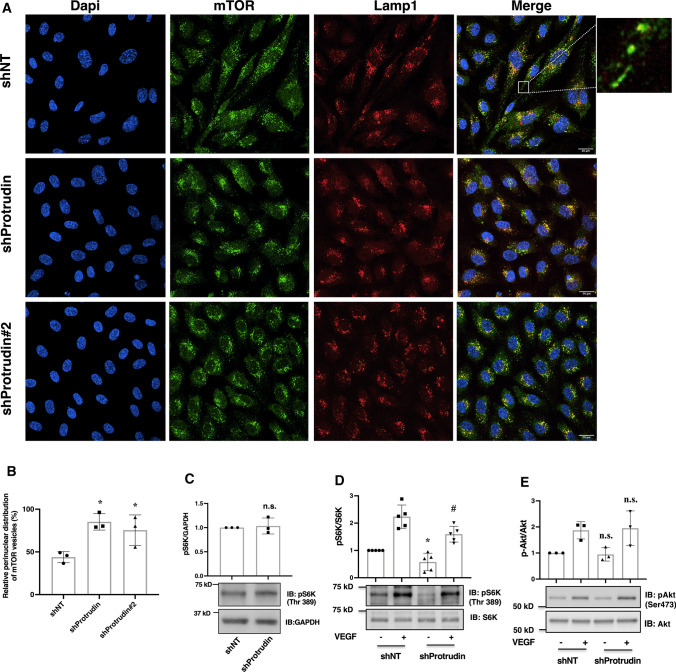
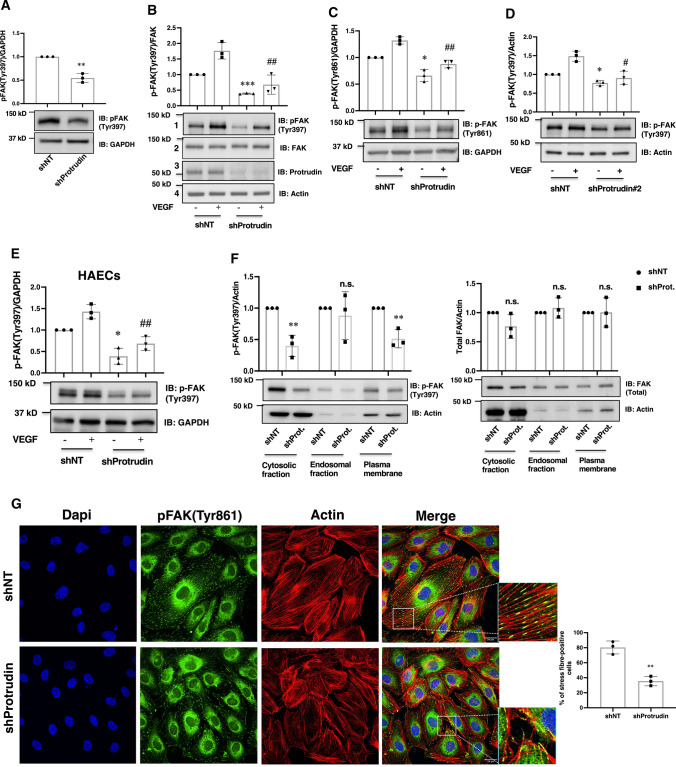
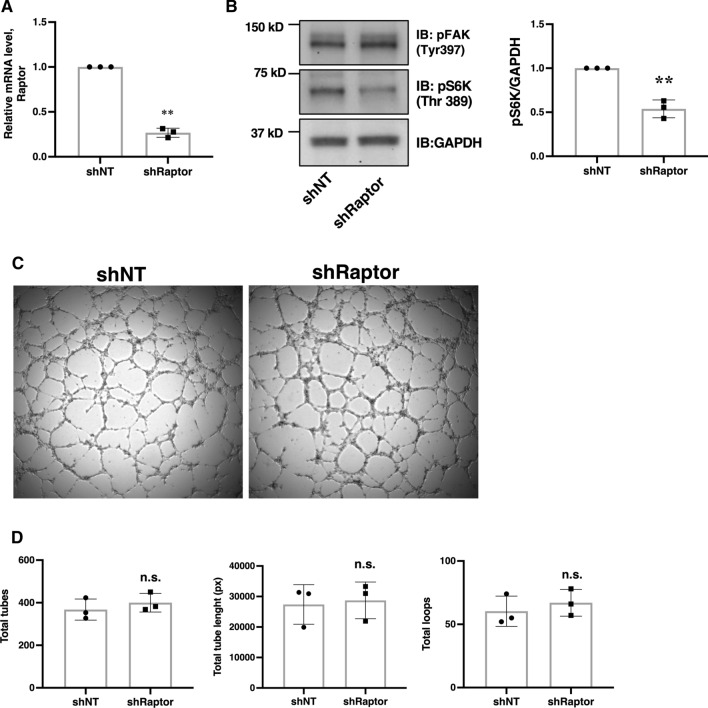
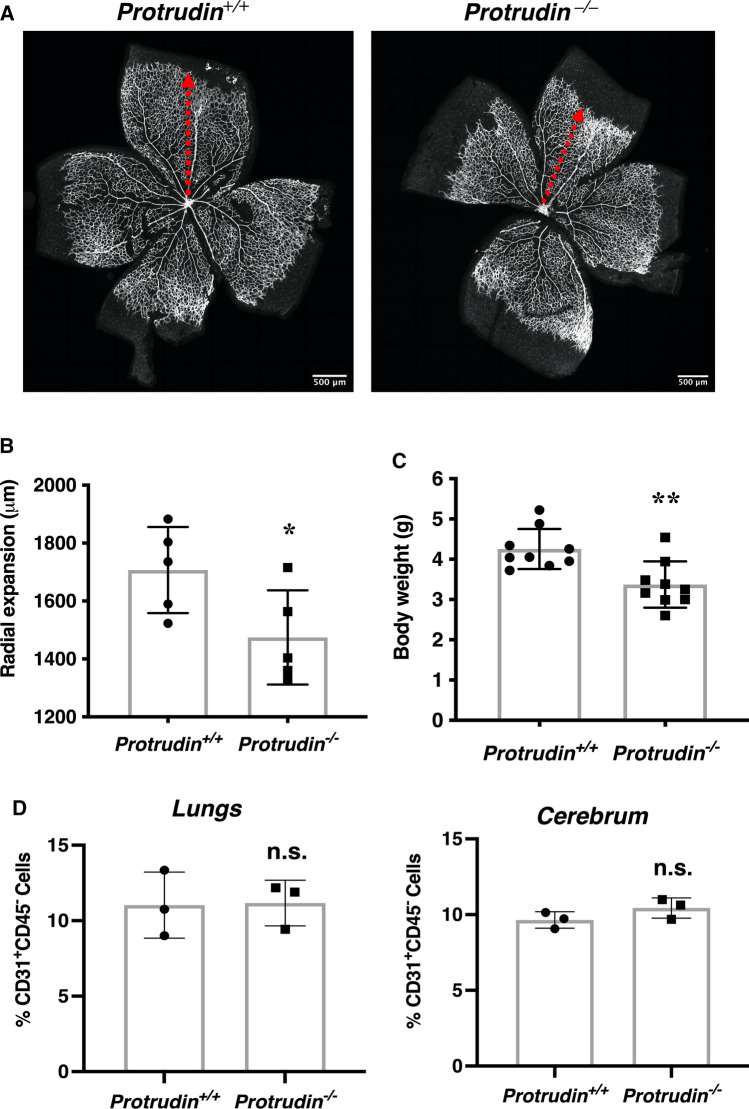
During angiogenesis, endothelial cells form protrusive sprouts and migrate towards the angiogenic stimulus. In this study, we investigate the role of the endoplasmic reticulum (ER)-anchored protein, Protrudin, in endothelial cell protrusion, migration and angiogenesis. Our results demonstrate that Protrudin regulates angiogenic tube formation in primary endothelial cells, Human umbilical vein endothelial cells (HUVECs). Analysis of RNA sequencing data and its experimental validation revealed cell migration as a prominent cellular function affected in HUVECs subjected to Protrudin knockdown. Further, our results demonstrate that knockdown of Protrudin inhibits focal adhesion kinase (FAK) activation in HUVECs and human aortic endothelial cells (HAECs). This is associated with a loss of polarized phospho-FAK distribution upon Protrudin knockdown as compared to Protrudin expressing HUVECs. Reduction of Protrudin also results in a perinuclear accumulation of mTOR and a decrease in VEGF-mediated S6K activation. However, further experiments suggest that the observed inhibition of angiogenesis in Protrudin knockdown cells is not affected by mTOR disturbance. Therefore, our findings suggest that defects in FAK activation and its abnormal subcellular distribution upon Protrudin knockdown are associated with a detrimental effect on endothelial cell migration and angiogenesis. Furthermore, mice with global Protrudin deletion demonstrate reduced retinal vascular progression. To conclude, our results provide evidence for a novel key role of Protrudin in endothelial cell migration and angiogenesis.

Keywords: Endosomes; Focal adhesion kinase; Vasculature; Zfyve27; mTOR.


Conflict of interest statement

The authors declare no conflict of interest concerning this study.

Figures

Fig. 1
Fig. 1
Protrudin regulates angiogenic tube formation in vitro. a HUVECs were transduced for 48 h with shRNA lentiviruses targeting Protrudin (shProtrudin) or a non-targeting shRNA (shNT). Cells were seeded in triplicate on the Millipore matrix in a 96-well plate containing ECGM2 complete media and incubated for 5 h. Phase contrast images were then taken of the tubes formed, 4 fields from each well. The experiment was done four times, a total of at least 40 fields per condition were imaged. Representative images are shown. b Bar diagram demonstrating quantification of the number of tubes, the length of tubes, and the number of loops in control versus Protrudin knockdown cells. Data represent mean ± SD of four independent experiments, two-tailed Student’s t-test.**p < 0.01. c HUVECs were transduced with shProtrudin + Mock lentivirus or shProtrudin + Protrudin-wild-type rescue lentivirus (shProtrudin + Prot.WTres) and then seeded on a Millipore matrix for tube formation assay as described in (a). d Bar diagram demonstrating quantification of the number of tubes, the length of tubes, and the number of loops in shProtrudin + Mock versus shProtrudin + Prot.WTres cells. Data represent mean ± SD of four independent experiments, two-tailed Student’s t-test. **p < 0.01. e HUVECs were transduced with either empty (Mock) or Protrudin (wild-type or domain-deleted) lentiviral constructs for 48 h. Cells were then trypsinized and seeded on the Millipore matrix as described in (a). Experiment was done thrice with wells seeded in triplicate per sample each time; representative images are shown. Scale bar = 1000 μm. f Bar diagram demonstrating quantification of the number of tubes, the length of tubes, and the number of loops in control vs. Protrudin wild-type or domain-deleted protein expressing samples as indicated. Data represent mean ± SD of three independent experiments. One-way ANOVA followed by Dunnett’s multiple comparisons test *p < 0.05, **p < 0.01, ***p < 0.001 as compared to Mock
Fig. 2
Fig. 2
Protrudin regulates late endosome/lysosome (LE/Lys) distribution and protrusion formation in endothelial cells. a Deconvolved confocal microscopic images of HUVECs expressing electroporated plasmid constructs encoding GFP (control), Protrudin-GFP (Protrudin-WT) or KIF-binding domain-deleted Protrudin-GFP (Protrudin-ΔKIF). After 24 h of transfection in ECGM2 complete media, cells were fixed in 4% PFA and immunostained with anti-Lamp1 antibody. The insert highlights dispersed Lamp1 vesicles colocalized with Protrudin-WT representing ER-endosome contact sites. Scale bar = 20 μm. b Quantification of protrusion formation in HUVECs transfected as in (a). Data represent mean ± SD of four independent experiments (200 cells per condition), one-way ANOVA followed by Tukey’s multiple comparisons test. ***p < 0.001 as compared to EGFP transfected control, ###p < 0.001 as compared to Protrudin-WT. c Quantification of perinuclear distributed Lamp1-positive LE/Lys in HUVECs transfected as in (a). Bars represent the percentage of perinuclear Lamp1 vesicles from total Lamp1-positive vesicles in a cell. Data represent mean ± SD of four independent experiments. One-way ANOVA followed by Tukey’s multiple comparisons test **p < 0.01 as compared to EGFP transfected sample, ###p < 0.001 as compared to Protrudin-WT
Fig. 3
Fig. 3
Cellular and molecular functions affected by Protrudin knockdown in HUVECs. a The molecular and cellular functions (RNA sequencing analysis) significantly affected in the shProtrudin cells were identified. P < 0.05 after multiple test adjustment was considered statistically significant (b) Volcano plot demonstrating differentially expressed genes between Protrudin knockdown and control HUVECs (adjusted p < 0.05). Significantly altered mRNAs with > twofold down- or upregulation are indicated in blue and red color, respectively. Top 10 up- and downregulated genes are identified. c VEGF-VEGFR2 signaling network to promote cell migration in endothelial cells illustrated using the Wikipathways database. Red boxes mark upregulated and green boxes downregulated genes upon Protrudin knockdown based on the indicated log2-fold change scale; adjusted p-value < 0.05. The brighter the color the higher is the log2-fold change value; uncolored box denotes not significant. Note: Many interconnections within the network have not been indicated here, to keep the network presentation simple. The main purpose of this network is to indicate the genes involved in endothelial cell migration that are significantly altered upon Protrudin knockdown in HUVECs
Fig. 4
Fig. 4
Protrudin promotes endothelial cell migration. a Representative images of wound closure in HUVECs transduced with Protrudin knockdown or non-targeting lentivirus in ECGM2 complete media, at t = 0 and t = 22 h. Scale bar = 300 μm. b Line diagram representing cell migration profile of HUVECs towards the wounded area over a period of 22 h. The bar graph represents relative wound density (%) in control (shNT) vs. Protrudin knockdown HUVECs for three independent experiments; two-tailed Student’s t-test, *p < 0.05. Data represent mean ± SD. c Wound-healing assay using HUVECs overexpressing Protrudin wild-type (Protrudin-WT) or Mock (Control) lentiviral construct. At 48 h post-transduction, a wound was made in confluent monolayers and cells were imaged for 24 h. Representative images at t = 0 and t = 24 h are shown. Scale bar = 300 μm. d Line diagram representing cell migration profile of HUVECs towards the wounded area over a period of 24 h. The bar graph represents relative wound density (%) in Mock vs. Protrudin overexpressing HUVECs. Data represent mean ± SD, *p < 0.05. e Migration profile of shProtrudin HUVECs compared to shNT (non-targeting shRNA) cells measured in real-time using an impedance-based migration assay on xCELLigence RCTA DP instrument. Bar graph representing migration cell index in Control (shNT) vs. Protrudin knockdown HUVECs at 12 h. Experiment was done thrice. Data represent mean ± SD, two-tailed Student’s t-test **p < 0.01
Fig. 5
Fig. 5
Knockdown of Protrudin promotes perinuclear accumulation of mTOR-positive LE/Lys and diminished mTORC1 activity. a Deconvolved confocal micrographs showing distribution of mTOR-positive LE/Lys. HUVECs were seeded on glass coverslips along with lentivirus carrying shProtrudin, shProtrudin#2 or shNT sequence and cells were grown in ECGM2 complete media. Post-transduction, the cells were fixed in 4% PFA and immunostained with anti-Lamp1 and anti-mTOR antibodies. Experiment was done thrice, and the data are representative of at least 15 image captures for each condition per experiment. The high-magnification inset on the right illustrates dispersed mTOR-Lamp1-positive endosomes. b Quantification of perinuclear distributed mTOR-positive lysosomes. Graph represents percentage intensities of perinuclearly distributed mTOR relative to total cellular mTOR-positive vesicles. 150 cells per condition were analyzed from 3 independent experiments. Data represent mean ± SD for 3 independent experiments. *p < 0.05 as compared to control samples. c Immunoblots showing phosphorylation level of S6K in Protrudin knockdown HUVECs grown in complete media. d Immunoblots of Protrudin knockdown or control cells showing the phosphorylation level of S6K. Cells were serum starved in 0.1% BSA for 5 h followed by stimulation with ( +) or without ( −) VEGF (50 ng/ml) for 20 min. Cells were lysed and immunoblotted with total or phospho-p70S6K (Thr 389) antibodies. Data represent mean ± SD for 5 independent experiments.*p < 0.05 as compared to shNT, − VEGF samples #p < 0.05 compared to shNT, + VEGF samples. d Immunoblots showing the phosphorylation level of Akt(Ser473) in Protrudin knockdown HUVECs as described in (c). Graphs represent relative densitometric values of pAkt(Ser473) normalized to Akt. Data represent mean ± SD for 3 independent experiments. n.s. indicates statistically not significant compared to shNT, − VEGF samples or shNT, + VEGF samples
Fig. 6
Fig. 6
Knockdown of Protrudin impairs activation of focal adhesion kinase. HUVECs were transduced with Protrudin or non-targeting shRNA and incubated for 48 h followed by puromycin selection for 16 h in complete ECGM2 media. a Cells were lysed for immunoblotting using antibodies to pFAK(Tyr397) and GAPDH. The experiments were done thrice; a representative blot is shown. The bar diagram represents relative densitometric values of pFAK(Tyr397) normalized for GAPDH. Data represent mean ± SD for three independent experiments, **p < 0.01, compared to shNT. b Post-selection shNT or shProtrudin cells were serum-starved for 5 h in ECM2 media containing 0.1%BSA followed by stimulation without ( −) or with ( +) VEGF (50 ng/ml) for 5 min, and lysed for immunoblotting using antibodies to pFAK(Tyr397) (panel 1), total FAK (panel 2); Protrudin (panel 3), actin (panel 4); c pFAK(Tyr861) (upper panel), GAPDH (lower panel). The experiments were done thrice; representative blots are shown. The bar diagrams in (b, c) represent relative densitometric values of pFAK(Tyr397) or pFAK(Tyr861) normalized for total FAK and GAPDH, respectively. Data represent mean ± SD for three independent experiments, ***p < 0.001, *p < 0.05 compared to shNT without VEGF stimulation. ##p < 0.01 compared to shNT with VEGF stimulation. d HUVECs were transduced with shProtrudin#2 or non-targeting shRNA as described above for (a) and (b). Cells were lysed and immunoblotted with anti-pFAK(Tyr 397) (upper panel) or -actin (lower panel). The experiments were done thrice; a representative blot is shown. The bar diagram represents relative densitometric values of pFAK (Tyr397) normalized to actin. Data represent mean ± SD, *p < 0.05 compared to shNT without VEGF stimulation. #p < 0.05 compared to shNT with VEGF stimulation. e Human aortic endothelial cells (HAECs) were transduced with shProtrudin or non-targeting shRNA as described above. Cells were lysed and immunoblotted using antibodies against pFAK(Tyr 397) (upper panel) and GAPDH (lower panel). The experiments were done thrice; a representative blot is shown. The bar diagrams represent relative densitometric values of pFAK normalized to GAPDH. Data represent mean ± SD, *p < 0.05 compared to shNT without VEGF stimulation. ##p < 0.01 compared to shNT with VEGF stimulation. f Immunoblot showing cytoplasmic, endosomal and plasma membrane fractions of HUVEC transduced with shNT or shProtrudin, serum-starved for 5 h in medium with 0.1% BSA prior to subcellular fractionation as described in Methods. Data represent mean ± SD for three independent experiments, **p < 0.01, n.s. indicates statistically not significant. The bar diagrams represent relative densitometric values of pFAK or FAK normalized to actin. g HUVECs were seeded on glass coverslips along with control or shProtrudin lentivirus for 48 h in ECGM2 complete media, followed by puromycin selection. Cells were then fixed and stained with Phalloidin-AlexaFluor 594 (actin) or anti-pFAK(Tyr861) and analyzed by confocal microscopy, followed by deconvolution. The experiment was done thrice, and the data are representative of at least 15 image captures per experiment. Bar diagram demonstrates quantification of the percentage of cells with actin stress fibers. 60 cells per condition were analyzed for the quantification, n = 3 independent experiments. Data represent mean ± SD. **p < 0.01 compared to shNT, two-tailed Student’s t-test
Fig. 7
Fig. 7
Knockdown of Raptor does not affect FAK activation or angiogenic tube formation in HUVECs. a Cells were transduced with lentivirus targeting Raptor or non-targeting control lentivirus (shNT) and incubated in complete ECGM2 growth media for 48 h. Transduced cells were selected with puromycin and lysed for Quantitative RT-PCR. b Post-selection Raptor knockdown and shNT cells were subjected to western immunoblotting and probed with anti-pFAK(Tyr397), anti-pS6K(Thr389) and anti-GAPDH antibody. c HUVECs were transduced with shNT or shRaptor lentivirus and then seeded on a Millipore matrix as described in Fig. 1a. d Bar diagram demonstrating quantification of the number of tubes and loops, as well as the length of tubes in shNT versus shRaptor cells. Data represent mean ± SD of three independent experiments, two-tailed Student’s t-test, n.s., statistically not significant
Fig. 8
Fig. 8
Protrudin gene deletion retards physiological postnatal angiogenesis. a Isolectin B4 staining of postnatal day 7 retinas from Zfyve27+/+ (wild-type) and Protrudin KO (Zfyve27−/−) mice, showing vascular progression. Scale bar = 500 μm; n = 5. b Bar graph representing quantification of retinal vascular progression; n = 5. Data represent mean ± SD, *p < 0.05, two-tailed Student’s t-test. c Body weight of Zfyve27+/+ and Zfyve27–/– mice at 7 to 9 days of age, n = 9, two-tailed Student’s t-test. Data represent mean ± SD, **p < 0.01. d FACS-based cell counts for CD31+CD45 cell populations isolated for mice lungs (postnatal day 7, n = 3) and cerebrum (postnatal day 13–16, n = 3). n.s., statistically not significant

References

    1. Carmeliet P, Jain RK. Molecular mechanisms and clinical applications of angiogenesis. Nature. 2011;473(7347):298–307. doi: 10.1038/nature10144. - DOI - PMC - PubMed
    1. Potente M, Carmeliet P. The Link Between Angiogenesis and Endothelial Metabolism. Annu Rev Physiol. 2017;79:43–66. doi: 10.1146/annurev-physiol-021115-105134. - DOI - PubMed
    1. Chen W, Xia P, Wang H, Tu J, Liang X, Zhang X, Li L. The endothelial tip-stalk cell selection and shuffling during angiogenesis. J Cell Commun Signal. 2019;13(3):291–301. doi: 10.1007/s12079-019-00511-z. - DOI - PMC - PubMed
    1. De Smet F, Segura I, De Bock K, Hohensinner PJ, Carmeliet P. Mechanisms of vessel branching: filopodia on endothelial tip cells lead the way. Arterioscler Thromb Vasc Biol. 2009;29(5):639–649. doi: 10.1161/ATVBAHA.109.185165. - DOI - PubMed
    1. Atkinson SJ, Ellison TS, Steri V, Gould E, Robinson SD. Redefining the role(s) of endothelial alphavbeta3-integrin in angiogenesis. Biochem Soc Trans. 2014;42(6):1590–1595. doi: 10.1042/BST20140206. - DOI - PubMed

MeSH terms

Substances

LinkOut - more resources