

Dwarfs on the Shoulders of Giants: Bayesian Analysis With Informative Priors in Elite Sports Research and Decision Making
- PMID: 35368412
- PMCID: PMC8970347
- DOI: 10.3389/fspor.2022.793603
Dwarfs on the Shoulders of Giants: Bayesian Analysis With Informative Priors in Elite Sports Research and Decision Making
Abstract
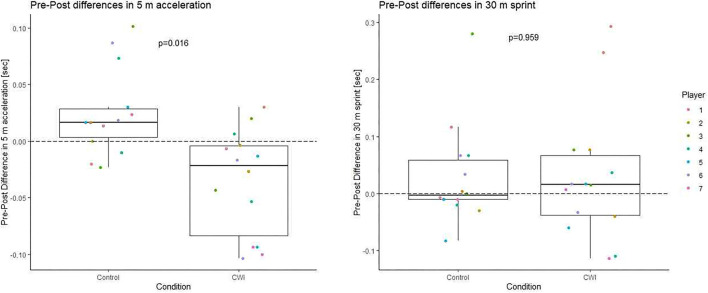
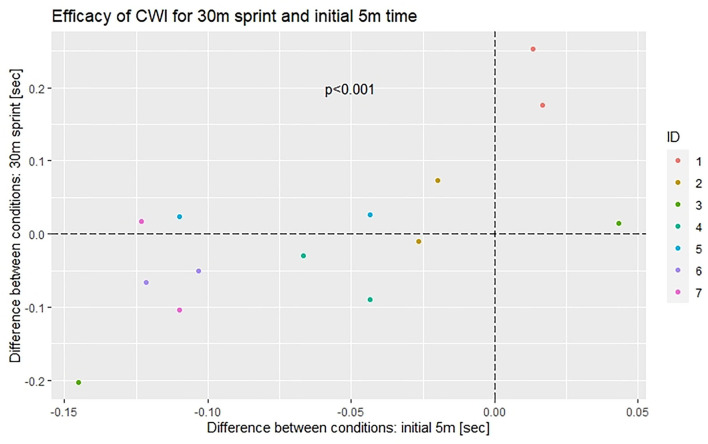
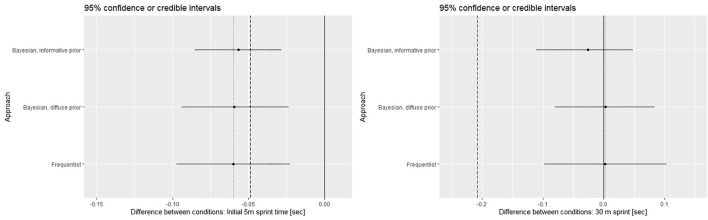
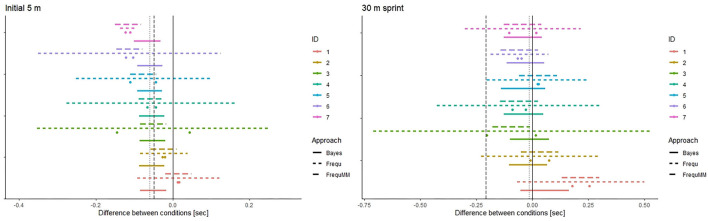
While sample sizes in elite sports are necessarily small, so are the effects that may be relevant. This conundrum is complicated by an understandable reluctance of athletes to comply with extensive study requirements. In Bayesian analyses, pre-existing knowledge (e.g., from sub-elite trials) can be formally included to supplement scarce data. Moreover, some design specifics for small sample research extend to the extreme case of a single subject. This provides the basis for actionable feedback (e.g., about individual responses) thereby incentivising participation. As a proof-of-concept, we conducted a replicated cross-over trial on the effect of cold-water immersion (CWI) on sprint performance recovery in soccer players. Times for 30 m linear sprint and the initial 5 m section, respectively, were measured by light gates before and 24 h after induction of fatigue. Data were analysed by Bayesian and by standard frequentist methods. Informative priors are based on a published metaanalysis. Seven players completed the trial. Sprint performance was 4.156 ± 0.193 s for 30 m linear sprint and 0.978 ± 0.064 s for the initial 5 m section. CWI improved recovery of sprint time for the initial 5 m section (difference to control: -0.060 ± 0.060 s, p = 0.004) but not for the full 30 m sprint (0.002 ± 0.115 s, p = 0.959), with general agreement between Bayesian and frequentist interval estimates. On the individual level, relevant differences between analytical approaches were present for most players. Changes in the two performance measures are correlated (p = 0.009) with a fairly good reproducibility of individual response patterns. Bayesian analyses with informative priors may be a practicable and meaningful option particularly for very small samples and when the analytical aim is decision making (use / don't use in the specific setting) rather than generalizable inference.
Keywords: Bayesian statistics; cold-water immersion; individual response; methodology; replicate crossover.
Copyright © 2022 Hecksteden, Forster, Egger, Buder, Kellner and Meyer.
Conflict of interest statement
The authors declare that the research was conducted in the absence of any commercial or financial relationships that could be construed as a potential conflict of interest.
Figures
Similar articles
-
Metabolic, cognitive and neuromuscular responses to different multidirectional agility-like sprint protocols in elite female soccer players - a randomised crossover study.BMC Sports Sci Med Rehabil. 2024 Mar 6;16(1):64. doi: 10.1186/s13102-024-00856-y. BMC Sports Sci Med Rehabil. 2024. PMID: 38448940 Free PMC article.
-
Change-of-Direction Ability, Linear Sprint Speed, and Sprint Momentum in Elite Female Athletes: Differences Between Three Different Team Sports.J Strength Cond Res. 2022 Jan 1;36(1):262-267. doi: 10.1519/JSC.0000000000003857. J Strength Cond Res. 2022. PMID: 33065701
-
Recovery following Rugby Union matches: effects of cold water immersion on markers of fatigue and damage.Appl Physiol Nutr Metab. 2019 May;44(5):546-556. doi: 10.1139/apnm-2018-0542. Epub 2018 Oct 15. Appl Physiol Nutr Metab. 2019. PMID: 30321486 Clinical Trial.
-
Water immersion recovery for athletes: effect on exercise performance and practical recommendations.Sports Med. 2013 Nov;43(11):1101-30. doi: 10.1007/s40279-013-0063-8. Sports Med. 2013. PMID: 23743793 Review.
-
Quantifying Exposure and Intra-Individual Reliability of High-Speed and Sprint Running During Sided-Games Training in Soccer Players: A Systematic Review and Meta-analysis.Sports Med. 2023 Feb;53(2):371-413. doi: 10.1007/s40279-022-01773-1. Epub 2022 Nov 4. Sports Med. 2023. PMID: 36331702 Free PMC article.
Cited by
-
Genotypic Influences on Actuators of Aerobic Performance in Tactical Athletes.Genes (Basel). 2024 Nov 28;15(12):1535. doi: 10.3390/genes15121535. Genes (Basel). 2024. PMID: 39766802 Free PMC article.
-
Post-Match Recovery Responses in Italian Serie A Youth Soccer Players: Effects of Manipulating Training Load 48 h After Match Play.Eur J Sport Sci. 2025 May;25(5):e12297. doi: 10.1002/ejsc.12297. Eur J Sport Sci. 2025. PMID: 40254901 Free PMC article. Clinical Trial.
-
The effectiveness of traditional vs. velocity-based strength training on explosive and maximal strength performance: A network meta-analysis.Front Physiol. 2022 Aug 10;13:926972. doi: 10.3389/fphys.2022.926972. eCollection 2022. Front Physiol. 2022. PMID: 36035476 Free PMC article.
-
Using a Bayesian network to classify time to return to sport based on football injury epidemiological data.PLoS One. 2025 Mar 20;20(3):e0314184. doi: 10.1371/journal.pone.0314184. eCollection 2025. PLoS One. 2025. PMID: 40112251 Free PMC article.
-
Why Humble Farmers May in Fact Grow Bigger Potatoes: A Call for Street-Smart Decision-Making in Sport.Sports Med Open. 2023 Oct 14;9(1):94. doi: 10.1186/s40798-023-00641-0. Sports Med Open. 2023. PMID: 37837528 Free PMC article.
References
-
- Aitken C. G. G., Taroni F. T. (2004). Statistics and the Evaluation of Evidence for Forensic Scientists, 2nd Edn. Hoboken, NJ: John Wiley and Sons. 10.1002/0470011238 - DOI
-
- Bates D., Maechler M., Bolker B., Walker S. (2015). Fitting linear mixed-effects models using lme4. J. Statist. Softw. 67, 1–48. 10.18637/jss.v067.i01 - DOI
-
- Brown V.. (2021). An introduction to linear mixed-effects modeling in R. Adv. Methods Pract. Psychol. Sci. 4, 1–19. 10.1177/2515245920960351 - DOI
LinkOut - more resources
Full Text Sources
Research Materials