. 2022 Mar 15:13:821026.
doi: 10.3389/fgene.2022.821026. eCollection 2022.

Beyond Genes: Inclusion of Alternative Splicing and Alternative Polyadenylation to Assess the Genetic Architecture of Predisposition to Voluntary Alcohol Consumption in Brain of the HXB/BXH Recombinant Inbred Rat Panel

Affiliations

Beyond Genes: Inclusion of Alternative Splicing and Alternative Polyadenylation to Assess the Genetic Architecture of Predisposition to Voluntary Alcohol Consumption in Brain of the HXB/BXH Recombinant Inbred Rat Panel

Ryan Lusk et al. Front Genet. .

Abstract

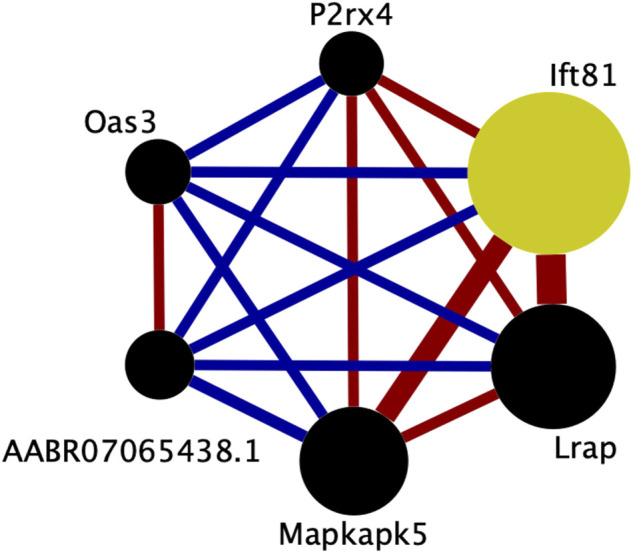
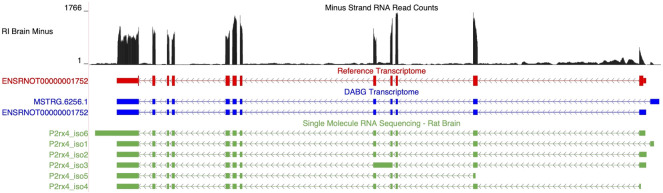
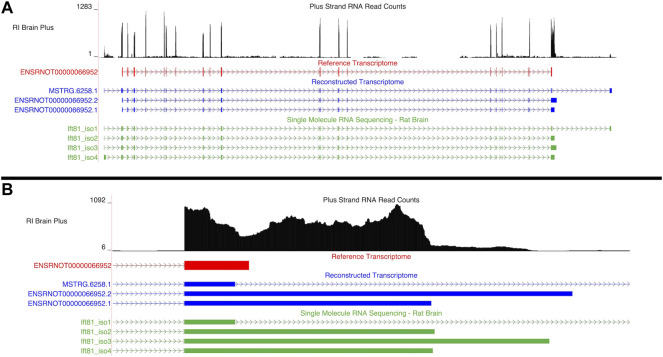
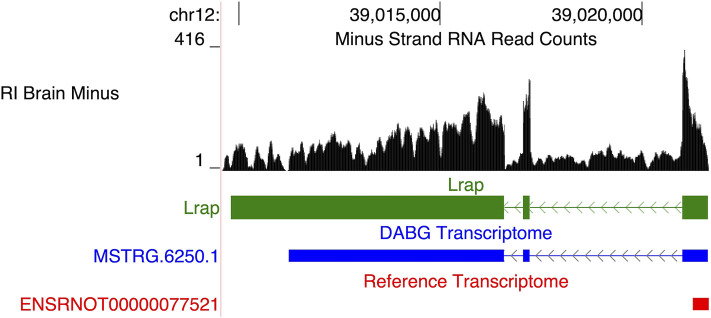
Post transcriptional modifications of RNA are powerful mechanisms by which eukaryotes expand their genetic diversity. For instance, researchers estimate that most transcripts in humans undergo alternative splicing and alternative polyadenylation. These splicing events produce distinct RNA molecules, which in turn yield distinct protein isoforms and/or influence RNA stability, translation, nuclear export, and RNA/protein cellular localization. Due to their pervasiveness and impact, we hypothesized that alternative splicing and alternative polyadenylation in brain can contribute to a predisposition for voluntary alcohol consumption. Using the HXB/BXH recombinant inbred rat panel (a subset of the Hybrid Rat Diversity Panel), we generated over one terabyte of brain RNA sequencing data (total RNA) and identified novel splice variants (via StringTie) and alternative polyadenylation sites (via aptardi) to determine the transcriptional landscape in the brains of these animals. After establishing an analysis pipeline to ascertain high quality transcripts, we quantitated transcripts and integrated genotype data to identify candidate transcript coexpression networks and individual candidate transcripts associated with predisposition to voluntary alcohol consumption in the two-bottle choice paradigm. For genes that were previously associated with this trait (e.g., Lrap, Ift81, and P2rx4) (Saba et al., Febs. J., 282, 3556-3578, Saba et al., Genes. Brain. Behav., 20, e12698), we were able to distinguish between transcript variants to provide further information about the specific isoforms related to the trait. We also identified additional candidate transcripts associated with the trait of voluntary alcohol consumption (i.e., isoforms of Mapkapk5, Aldh1a7, and Map3k7). Consistent with our previous work, our results indicate that transcripts and networks related to inflammation and the immune system in brain can be linked to voluntary alcohol consumption. Overall, we have established a pipeline for including the quantitation of alternative splicing and alternative polyadenylation variants in the transcriptome in the analysis of the relationship between the transcriptome and complex traits.

Keywords: HXB/BXH recombinant inbred panel; RNA-seq—RNA sequencing; alternative polyadenylation; alternative splicing; isoform; transcriptome; voluntary alcohol consumption; weighted gene co expression network analysis.


Conflict of interest statement

The authors declare that the research was conducted in the absence of any commercial or financial relationships that could be construed as a potential conflict of interest.

Figures

FIGURE 1
FIGURE 1
Heritability of transcripts in the detected above background transcriptome. Heritability of transcripts derived from the Ensembl reference annotation, StringTie, and aptardi. Heritability was estimated as the coefficient of determination (R2) from a one-way ANOVA of individual rat expression values using strain as the predictor (30 strains total) and transcript normalized expression estimates as the response. The solid horizontal line within each violin plot represents the median heritability for that group of transcripts. The dashed horizontal lines represent the upper quartile and lower quartile heritabilities for that group of transcripts.
FIGURE 2
FIGURE 2
Quantitative trait loci (QTL) for voluntary alcohol consumption in the HXB/BXH recombinant inbred panel. Strain means were used in a marker regression to determine phenotypic QTL. The blue line represents the logarithm of the odds (LOD) score threshold for a suggestive QTL (genome-wide p-value = 0.63). Suggestive QTL are labeled with their location, 95% Bayesian credible interval, LOD score, and genome-wide p-value. Empirical genome-wide phenotypic QTL p-values were calculated using 1,000 permutations.
FIGURE 3
FIGURE 3
Isoforms of the Map3k7 gene. (A) Blue transcripts represent those identified in the detected above background (DABG) transcriptome, and the red transcript represents the transcript present in the Ensembl reference annotation. ENSRNOT00000007657 is annotated in the Ensembl reference transcriptome and retained in the DABG transcriptome. MSTRG.23809.1 represents a novel isoform identified by StringTie. MSTRG.23809.1 represents an isoform with exon 12 skipped compared to ENSRNOT00000007657 (circled in green). (B) Detailed view of the exon 12 region. The RNA sequencing reads on the positive strand (black plot) represent a 10% randomly sampled subset from the HXB/BXH recombinant inbred rat panel RNA sequencing data in brain. This image was generated using the UCSC Genome Browser (Kent et al., 2002).
FIGURE 4
FIGURE 4
Isoforms of the Aldh1a7 gene. (A) The blue transcript represents those identified in the detected above background (DABG) transcriptome, and the red transcript represents the transcript present in Ensembl reference annotation. ENSRNOT00000024093 is annotated in the Ensembl reference transcriptome but was filtered out of the DABG transcriptome. ENSRNOT00000024093.1 represents a novel isoform identified by aptardi. (B) Detailed view of the 3′ region comparing aptardi annotation (ENSRNOT00000024093.1) to Ensembl reference annotation (ENSRNOT00000024093). ENSRNOT00000024093 and ENSRNOT00000024093.1 differ only in the length of their 3′ most exon. The RNA sequencing reads on the negative strand (black plot) represent a 10% randomly sampled subset from the HXB/BXH recombinant inbred rat panel RNA sequencing data in brain. This image was generated using the UCSC Genome Browser (Kent, 2002).
FIGURE 5
FIGURE 5
Connectivity within the brain candidate coexpression module for predisposition to voluntary alcohol consumption. Each circle represents a transcript from the coexpression module. The size of each circle is weighted based on its intra-modular connectivity (not to scale), and the thickness of each edge is weighted based on the magnitude of the connectivity between the two transcripts (not to scale). The edge colors indicate the direction of the connectivity (red = positive, blue = negative). Transcripts are ordered by intra-modular connectivity clockwise starting with Ift81. Strain mean normalized transcript expression estimates were used in weighted gene coexpression network analysis to generate coexpression modules. This figure was generated using Cytoscape (v. 3.8.2) (Shannon et al., 2003).
FIGURE 6
FIGURE 6
Isoforms of the P2rx4 gene. Blue transcripts represent those identified in the detected above background (DABG) transcriptome, the red transcript represents the transcript present in Ensembl reference annotation, and the green transcripts represent transcripts identified in the single molecule RNA sequencing data from rat brain. ENSRNOT00000001752 is annotated in the Ensembl reference transcriptome and retained in the DABG transcriptome, whereas MSTRG.6256.1 represents a novel isoform identified here by StringTie. MSTRG.6256.1 and ENSRNOT00000001752 differ in their 5′ most exon but otherwise share exon junctions. The RNA sequencing reads on the negative strand (black plot) represent a 10% randomly sampled subset from the HXB/BXH recombinant inbred rat panel RNA sequencing data in brain. This image was generated using the UCSC Genome Browser (Kent et al., 2002).
FIGURE 7
FIGURE 7
Isoforms of the Ift81 gene. (A) Blue transcripts represent those identified in the detected above background (DABG) transcriptome, the red transcript represents the transcript present in Ensembl reference annotation, and the green transcripts represent transcripts identified in the single molecule RNA sequencing data from rat brain. ENSRNOT00000066952 is annotated in the Ensembl reference transcriptome but removed in the DABG transcriptome. MSTRG.6258.1 represents a novel isoform identified by StringTie, and ENSRNOT00000066952.1 and ENSRNOT00000066952.2 represent novel isoforms identified by aptardi. (B) Detailed view of the 3′ region comparing aptardi annotation (ENSRNOT00000066952.1 and ENSRNOT00000066952.2) to Ensembl annotation (ENSRNOT00000066952). ENSRNOT00000066952, ENSRNOT00000066952.1, and ENSRNOT00000066952.2 differ only in the length of their 3′ most exon, whereas MSTRG.6258.1 possesses a different exon structure. The RNA sequencing reads on the positive strand (black plot) represent a 10% randomly sampled subset from the HXB/BXH recombinant inbred rat panel RNA sequencing data in brain. This image was generated using the UCSC Genome Browser (Kent et al., 2002).
FIGURE 8
FIGURE 8
Recapitulation of Lrap. We previously identified a novel transcript, subsequently annotated Lrap, as a potential mediator of alcohol consumption that is expressed in rat brain (Saba et al., 2015; Saba et al., 2020). The structure identified previously is shown in green (Lrap), the de novo transcript identified in the detected above background (DABG) transcriptome is shown in blue (MSTRG.6250.1), and existing Ensembl annotation is shown in red (ENSRNOT00000077521). The transcript identified here as MSTRG.6250.1 (annotated by StringTie) closely matches our previous annotation of Lrap. Additionally, the RNA sequencing reads on the negative strand (black plot) support the present of this transcript in our dataset. The RNA sequencing reads represent a 10% randomly sampled subset from the HXB/BXH recombinant inbred rat panel RNA sequencing data in brain. This image was generated using the UCSC Genome Browser (Kent et al., 2002).

References

    1. Abiola O., Angel J. M., Avner P., Bachmanov A. A., Belknap J. K., Bennett B., et al. (2003). The Nature and Identification of Quantitative Trait Loci: a Community's View. Nat. Rev. Genet. 4, 911–916. 10.1038/nrg1206 - DOI - PMC - PubMed
    1. Arlinde C., Sommer W., Björk K., Reimers M., Hyytiä P., Kiianmaa K., et al. (2004). A Cluster of Differentially Expressed Signal Transduction Genes Identified by Microarray Analysis in a Rat Genetic Model of Alcoholism. Pharmacogenomics J. 4, 208–218. 10.1038/sj.tpj.6500243 - DOI - PubMed
    1. Asatryan L., Popova M., Perkins D., Trudell J. R., Alkana R. L., Davies D. L. (2010). Ivermectin Antagonizes Ethanol Inhibition in Purinergic P2X4 Receptors. J. Pharmacol. Exp. Ther. 334, 720–728. 10.1124/jpet.110.167908 - DOI - PMC - PubMed
    1. Baik I., Cho N. H., Kim S. H., Han B.-G., Shin C. (2011). Genome-wide Association Studies Identify Genetic Loci Related to Alcohol Consumption in Korean Men. Am. J. Clin. Nutr. 93, 809–816. 10.3945/ajcn.110.001776 - DOI - PubMed
    1. Beaudoing E., Gautheret D. (2001). Identification of Alternate Polyadenylation Sites and Analysis of Their Tissue Distribution Using EST Data. Genome Res. 11, 1520–1526. 10.1101/gr.190501 - DOI - PMC - PubMed