

Metataxonomic Analysis of Milk Samples From SARS-CoV-2-Positive and SARS-CoV-2-Negative Women
- PMID: 35369105
- PMCID: PMC8971750
- DOI: 10.3389/fnut.2022.853576
Metataxonomic Analysis of Milk Samples From SARS-CoV-2-Positive and SARS-CoV-2-Negative Women
Abstract
Objective: To assess the impact of SARS-CoV-2 viral infection on the metataxonomic profile and its evolution during the first month of lactation.
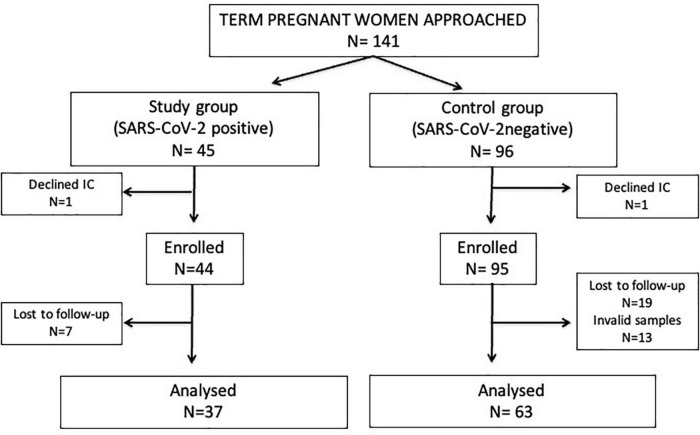
Methods: Milk samples from 37 women with full-term pregnancies and mild SARS-CoV-2 infection and from 63 controls, collected in the first and fifth postpartum weeks, have been analyzed. SARS-CoV-2 RNA was assessed by reverse transcription polymerase chain reaction (RT-PCR) both in cases and controls. After DNA extraction, the V3-V4 hypervariable region of the gene 16S rRNA was amplified and sequenced using the MiSeq system of Illumina. Data were submitted for statistical and bioinformatics analyses after quality control.
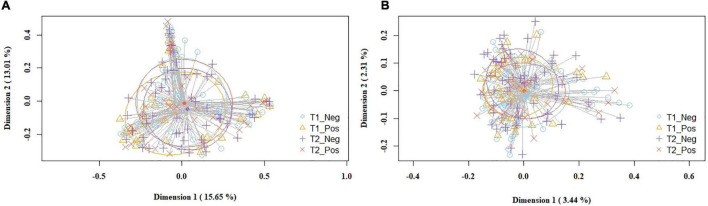
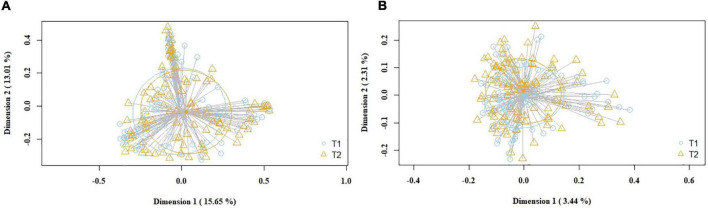
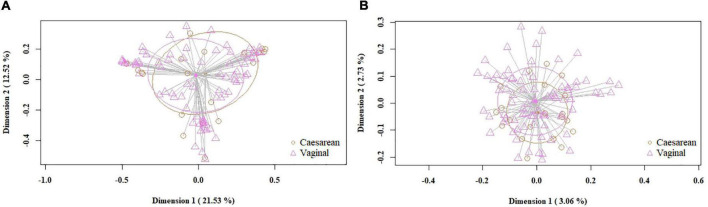
Results: All the 1st week and 5th week postpartum milk samples were negative for SARS-CoV-2 RNA. Alpha diversity showed no differences between milk samples from the study and control group, and this condition was maintained along the observation time. Analysis of the beta-diversity also indicated that the study and control groups did not show distinct bacterial profiles. Staphyloccus and Streptococcus were the most abundant genera and the only ones that were detected in all the milk samples provided. Disease state (symptomatic or asymptomatic infection) did not affect the metataxonomic profile in breast milk.
Conclusion: These results support that in the non-severe SARS-CoV-2 pregnant woman infection the structure of the bacterial population is preserved and does not negatively impact on the human milk microbiota.
Keywords: SARS-CoV-2; human milk; infant gut colonization; metataxonomic analysis; microbiota.
Copyright © 2022 Gómez-Torres, Sánchez-García, Castro, Arroyo, Cabañas, González-Sánchez, López-Azorín, Moral-Pumarega, Escuder-Vieco, Cabañes-Alonso, Rodríguez, Alba and Pellicer.
Conflict of interest statement
The authors declare that the research was conducted in the absence of any commercial or financial relationships that could be construed as a potential conflict of interest.
Figures
Similar articles
-
Immediate Pre-Partum SARS-CoV-2 Status and Immune Profiling of Breastmilk: A Case-Control Study.Front Immunol. 2021 Jul 26;12:720716. doi: 10.3389/fimmu.2021.720716. eCollection 2021. Front Immunol. 2021. PMID: 34381462 Free PMC article.
-
Human Milk Microbiome and Maternal Postnatal Psychosocial Distress.Front Microbiol. 2019 Oct 22;10:2333. doi: 10.3389/fmicb.2019.02333. eCollection 2019. Front Microbiol. 2019. PMID: 31695687 Free PMC article.
-
Breast Milk and Breastfeeding of Infants Born to SARS-CoV-2 Positive Mothers: A Prospective Observational Cohort Study.Am J Perinatol. 2021 Sep;38(11):1209-1216. doi: 10.1055/s-0041-1731451. Epub 2021 Jun 28. Am J Perinatol. 2021. PMID: 34182576
-
Detection of SARS-CoV-2 in Milk From COVID-19 Positive Mothers and Follow-Up of Their Infants.Front Pediatr. 2020 Oct 27;8:597699. doi: 10.3389/fped.2020.597699. eCollection 2020. Front Pediatr. 2020. PMID: 33194929 Free PMC article.
-
No Evidence of Infectious SARS-CoV-2 in Human Milk: Analysis of a Cohort of 110 Lactating Women.medRxiv [Preprint]. 2021 Apr 7:2021.04.05.21254897. doi: 10.1101/2021.04.05.21254897. medRxiv. 2021. Update in: Pediatr Res. 2022 Oct;92(4):1140-1145. doi: 10.1038/s41390-021-01902-y. PMID: 33851178 Free PMC article. Updated. Preprint.
Cited by
-
Breastfeeding vs. breast milk transmission during COVID-19 pandemic, which is more important?Front Pediatr. 2023 Sep 6;11:1253333. doi: 10.3389/fped.2023.1253333. eCollection 2023. Front Pediatr. 2023. PMID: 37744448 Free PMC article. Review.
-
COVID-19 mRNA vaccine-mediated antibodies in human breast milk and their association with breast milk microbiota composition.NPJ Vaccines. 2023 Oct 5;8(1):151. doi: 10.1038/s41541-023-00745-4. NPJ Vaccines. 2023. PMID: 37798293 Free PMC article.
-
Gut microbiota and COVID-19: An intriguing pediatric perspective.World J Clin Cases. 2022 Aug 16;10(23):8076-8087. doi: 10.12998/wjcc.v10.i23.8076. World J Clin Cases. 2022. PMID: 36159525 Free PMC article. Review.
-
The Entero-Mammary Pathway and Perinatal Transmission of Gut Microbiota and SARS-CoV-2.Int J Mol Sci. 2022 Sep 7;23(18):10306. doi: 10.3390/ijms231810306. Int J Mol Sci. 2022. PMID: 36142219 Free PMC article.
References
LinkOut - more resources
Full Text Sources
Miscellaneous