

Parathyroid Hormone Promotes Human Umbilical Vein Endothelial Cell Migration and Proliferation Through Orai1-Mediated Calcium Signaling
- PMID: 35369318
- PMCID: PMC8965836
- DOI: 10.3389/fcvm.2022.844671
Parathyroid Hormone Promotes Human Umbilical Vein Endothelial Cell Migration and Proliferation Through Orai1-Mediated Calcium Signaling
Abstract
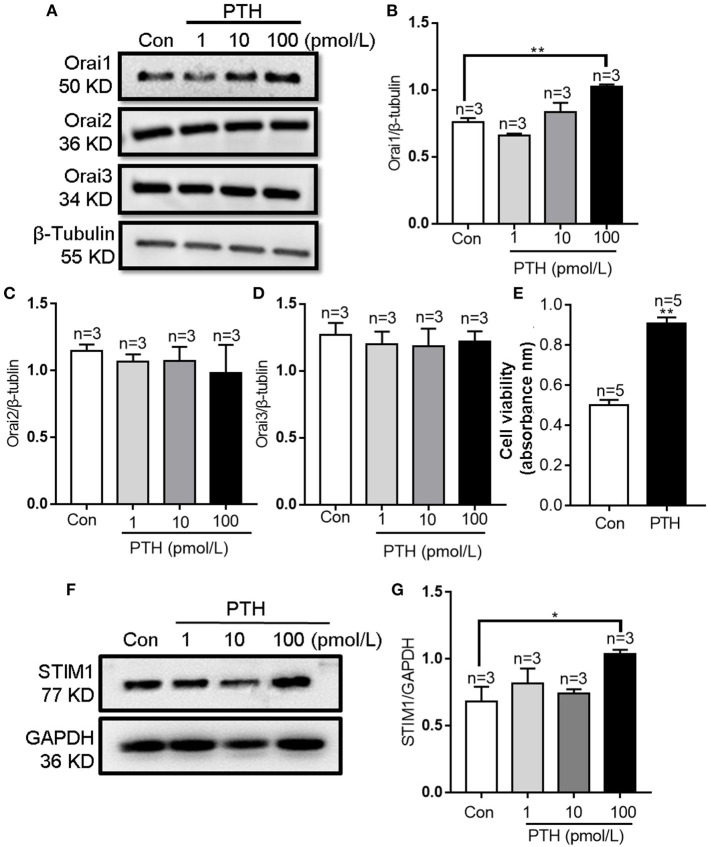
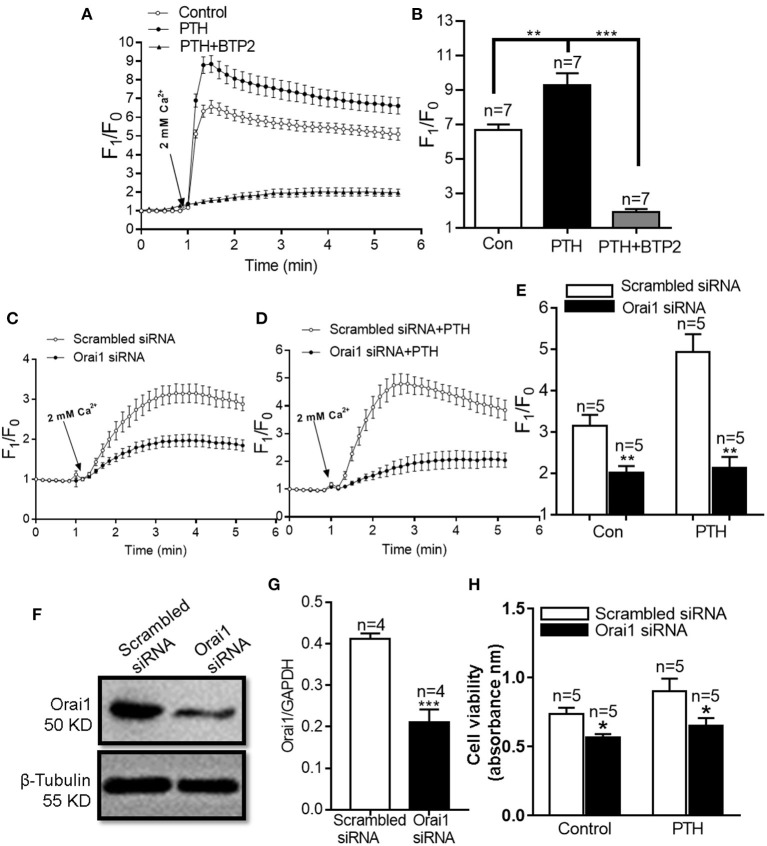
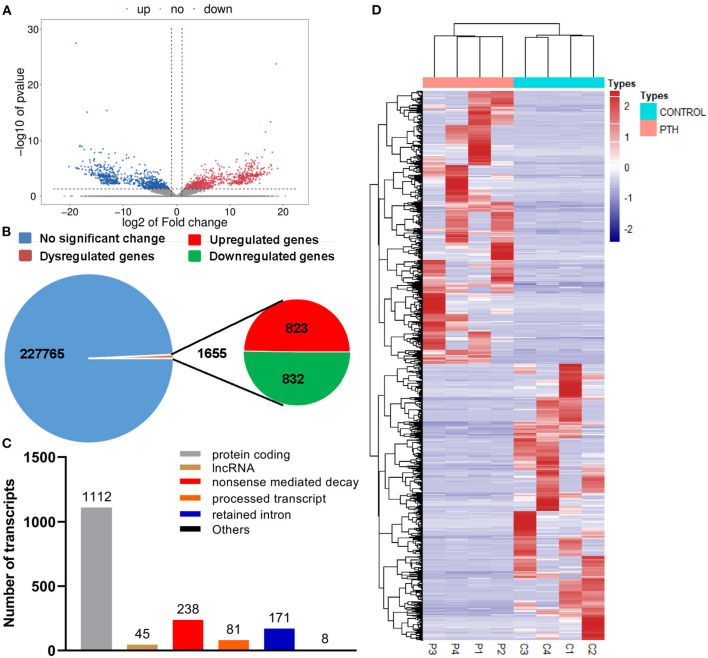
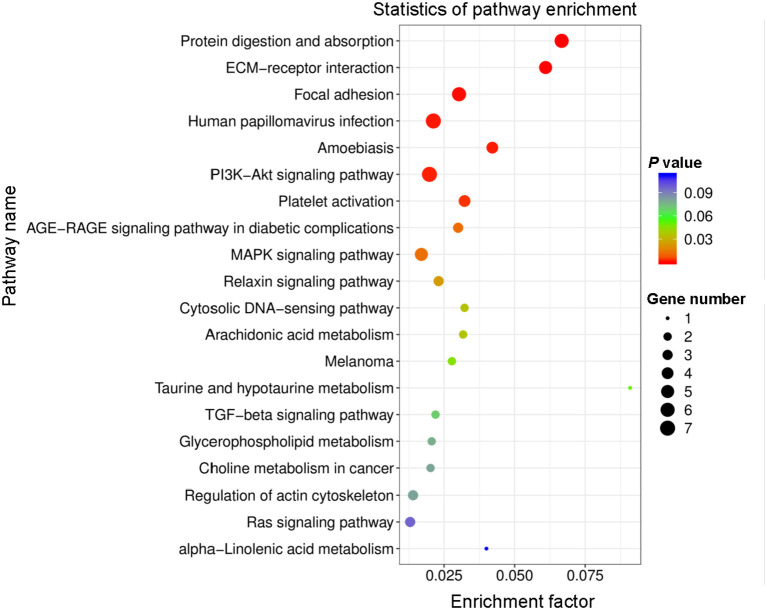
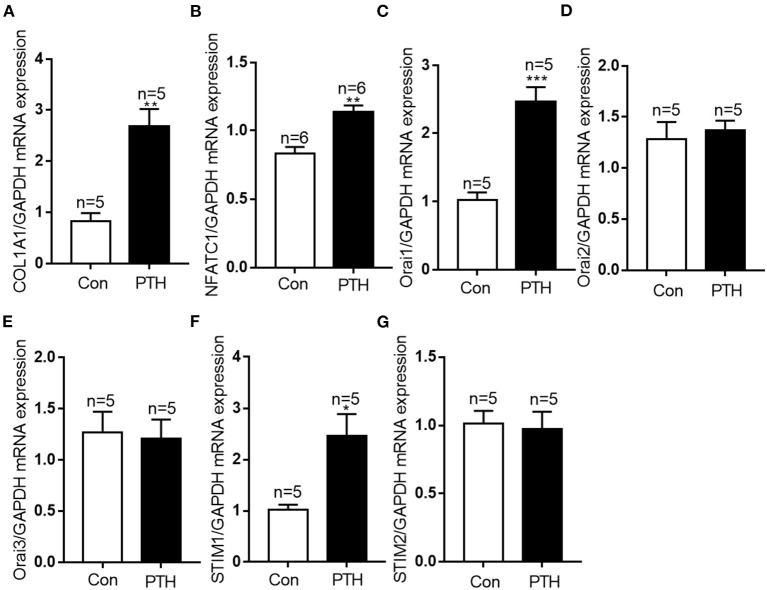
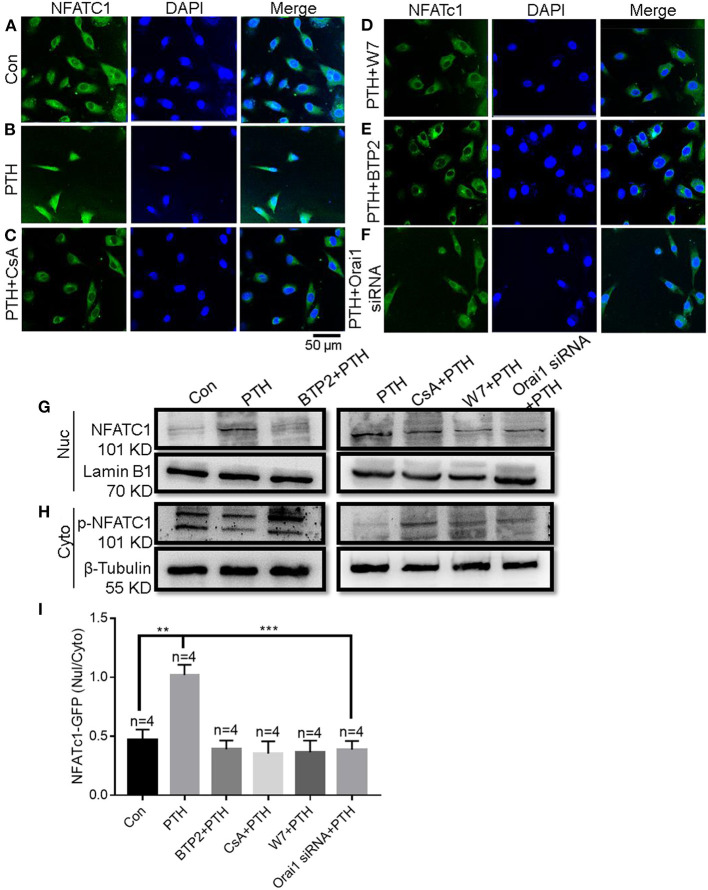
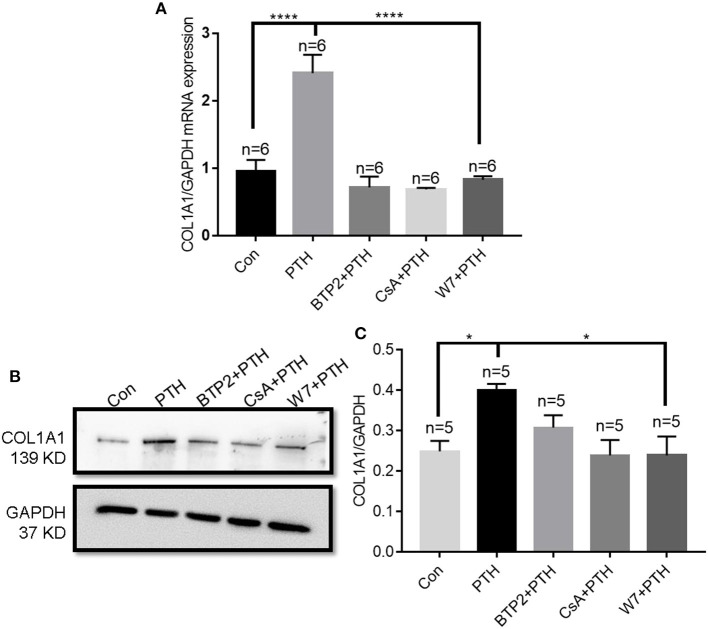
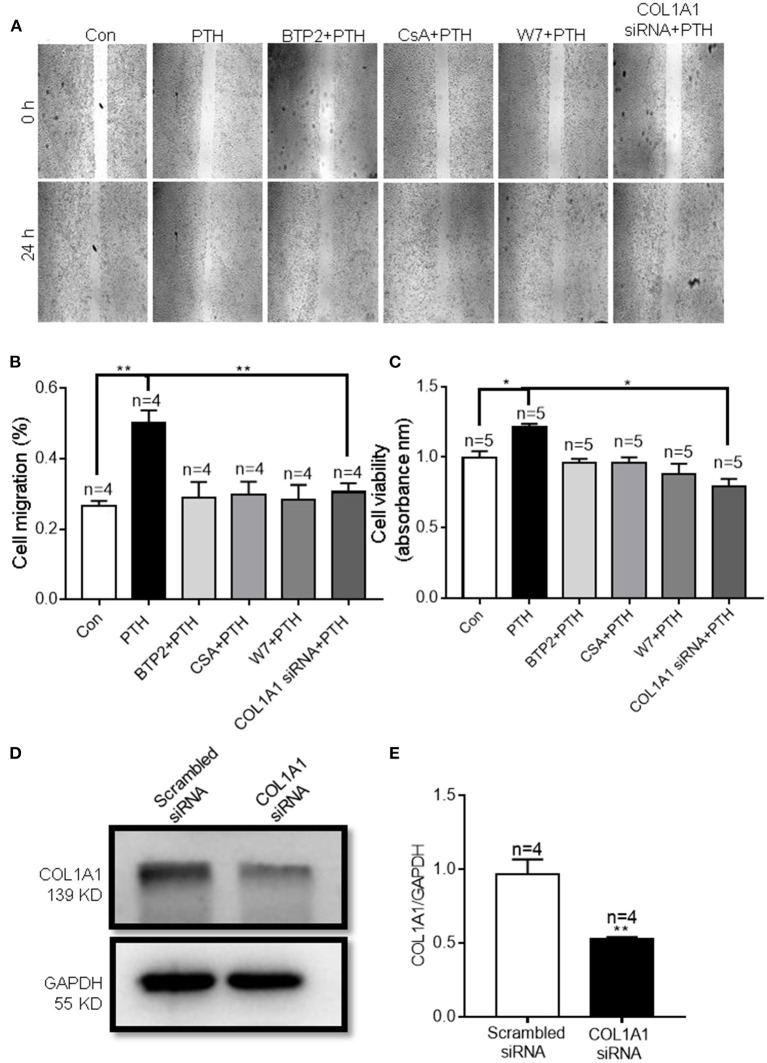
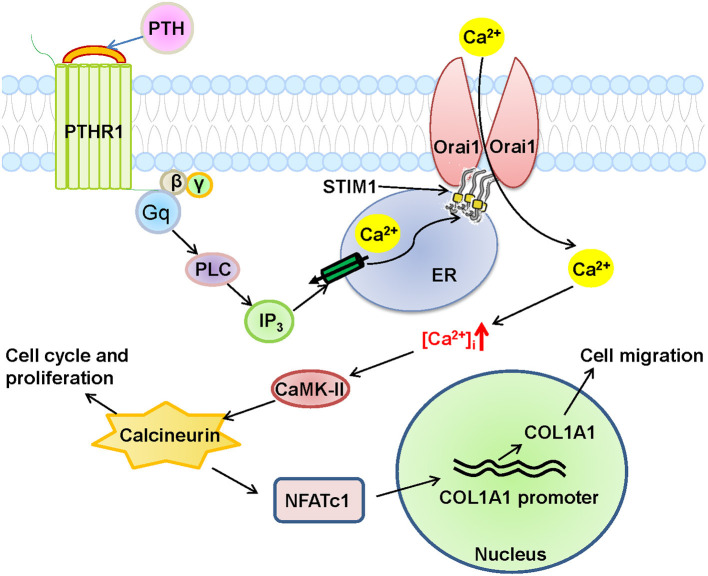
Parathyroid hormone is the main endocrine regulator of extracellular calcium and phosphorus levels. Secondary hyperparathyroidism-induced endothelial dysfunction may be related to calcium homeostasis disorders. Here, we investigated the effects of parathyroid hormone on human umbilical vein endothelial cells (HUVECs) and characterized the involvement of store-operated Ca2+ entry (SOCE) and the nuclear factor of activated T cells (NFAT) signaling pathway. We used immunoblot experiments to find that parathyroid hormone significantly enhanced the expression of the Orai1 channel, a type of channel mediating SOCE, SOCE activity, and Orai1-mediated proliferation of HUVECs but did not increase Orai2 and Orai3. RNA-seq was utilized to identify 1,655 differentially expressed genes (823 upregulated and 832 downregulated) in parathyroid hormone-treated HUVECs as well as enhanced focal adhesion signaling and expression levels of two key genes, namely, COL1A1 and NFATC1. Increased protein and mRNA expression levels of COL1A1 and NFATC1 were confirmed by immunoblotting and quantitative RT-PCR, respectively. Cytosol and nuclei fractionation experiments and immunofluorescence methods were used to show that parathyroid hormone treatment increased NFATC1 nuclear translocation, which was inhibited by a calcineurin inhibitor (CsA), a selective calmodulin antagonist (W7), an Orai channel inhibitor (BTP2), or Orai1 small interfering RNA (siRNA) transfection. Parathyroid hormone also increased COL1A1 expression, cell migration, and proliferation of HUVECs. The PTH-induced increase in HUVEC migration and proliferation were inhibited by CsA, W7, BTP2, or COL1A1 siRNA transfection. These findings indicated that PTH increased Orai1 expression and Orai1-mediated SOCE, causing the nuclear translocation of NFATC1 to increase COL1A1 expression and COL1A1-mediated HUVEC migration and proliferation. These results suggest potential key therapeutic targets of Orai1 and the downstream calmodulin/calcineurin/NFATC1/COL1A1 signaling pathway in parathyroid hormone-induced endothelial dysfunction and shed light on underlying mechanisms that may be altered to prevent or treat secondary hyperparathyroidism-associated cardiovascular disease.
Keywords: COL1A1; NFAT; human umbilical vein endothelial cells; parathyroid hormone; secondary hyperparathyroidism; store-operated Ca2+ entry.
Copyright © 2022 Wang, Xu, Wu, Shen, Lin, Fang, Zhang, Shen, Liu and Wu.
Conflict of interest statement
The authors declare that the research was conducted in the absence of any commercial or financial relationships that could be construed as a potential conflict of interest.
Figures
Similar articles
-
STIM1 Regulates Endothelial Calcium Overload and Cytokine Upregulation During Sepsis.J Surg Res. 2021 Jul;263:236-244. doi: 10.1016/j.jss.2020.12.016. Epub 2021 Mar 10. J Surg Res. 2021. PMID: 33713955
-
Pregnancy-Specific Glycoprotein 9 Enhances Store-Operated Calcium Entry and Nitric Oxide Release in Human Umbilical Vein Endothelial Cells.Diagnostics (Basel). 2023 Mar 16;13(6):1134. doi: 10.3390/diagnostics13061134. Diagnostics (Basel). 2023. PMID: 36980442 Free PMC article.
-
Stromal interaction molecule 1 (STIM1) and Orai1 mediate histamine-evoked calcium entry and nuclear factor of activated T-cells (NFAT) signaling in human umbilical vein endothelial cells.J Biol Chem. 2014 Oct 17;289(42):29446-56. doi: 10.1074/jbc.M114.578492. Epub 2014 Sep 4. J Biol Chem. 2014. PMID: 25190815 Free PMC article.
-
NFAT5-sensitive Orai1 expression and store-operated Ca2+ entry in megakaryocytes.FASEB J. 2017 Aug;31(8):3439-3448. doi: 10.1096/fj.201601211R. Epub 2017 Apr 26. FASEB J. 2017. PMID: 28446591
-
Stim and Orai proteins in neuronal Ca(2+) signaling and excitability.Front Cell Neurosci. 2015 Apr 24;9:153. doi: 10.3389/fncel.2015.00153. eCollection 2015. Front Cell Neurosci. 2015. PMID: 25964739 Free PMC article. Review.
Cited by
-
Exercise Reduces Airway Smooth Muscle Contraction in Asthmatic Rats via Inhibition of IL-4 Secretion and Store-Operated Ca2+ Entry Pathway.Allergy Asthma Immunol Res. 2023 May;15(3):361-373. doi: 10.4168/aair.2023.15.3.361. Epub 2023 Feb 27. Allergy Asthma Immunol Res. 2023. PMID: 37075798 Free PMC article.
-
Human Parathyroid Hormone (1-34) accelerates skin wound healing through inducing cell migration via up-regulating the expression of Rac1.Cell Div. 2024 Feb 12;19(1):4. doi: 10.1186/s13008-024-00111-3. Cell Div. 2024. PMID: 38347626 Free PMC article.
-
Human Parathyroid Hormone Analog (3-34/29-34) promotes wound re-epithelialization through inducing keratinocyte migration and epithelial-mesenchymal transition via PTHR1-PI3K/AKT activation.Cell Commun Signal. 2023 Aug 23;21(1):217. doi: 10.1186/s12964-023-01243-9. Cell Commun Signal. 2023. PMID: 37612710 Free PMC article.
-
The Molecular Heterogeneity of Store-Operated Ca2+ Entry in Vascular Endothelial Cells: The Different roles of Orai1 and TRPC1/TRPC4 Channels in the Transition from Ca2+-Selective to Non-Selective Cation Currents.Int J Mol Sci. 2023 Feb 7;24(4):3259. doi: 10.3390/ijms24043259. Int J Mol Sci. 2023. PMID: 36834672 Free PMC article. Review.
-
Apoptotic Extracellular Vesicles from Supernumerary Tooth-Derived Pulp Stem Cells Transfer COL1A1 to Promote Angiogenesis via PI3K/Akt/VEGF Pathway.Int J Nanomedicine. 2024 Jul 8;19:6811-6828. doi: 10.2147/IJN.S466136. eCollection 2024. Int J Nanomedicine. 2024. PMID: 39005959 Free PMC article.
References
LinkOut - more resources
Full Text Sources
Miscellaneous