. 2022 Mar 16:13:814448.
doi: 10.3389/fmicb.2022.814448. eCollection 2022.

A Standardized Extract of Lentinula edodes Cultured Mycelium Inhibits Pseudomonas aeruginosa Infectivity Mechanisms

Affiliations

A Standardized Extract of Lentinula edodes Cultured Mycelium Inhibits Pseudomonas aeruginosa Infectivity Mechanisms

Mireia Tena-Garitaonaindia et al. Front Microbiol. .

Erratum in

Abstract

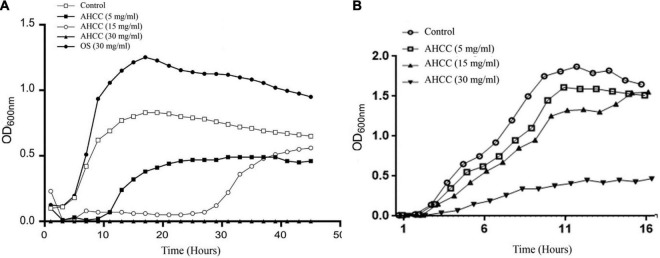
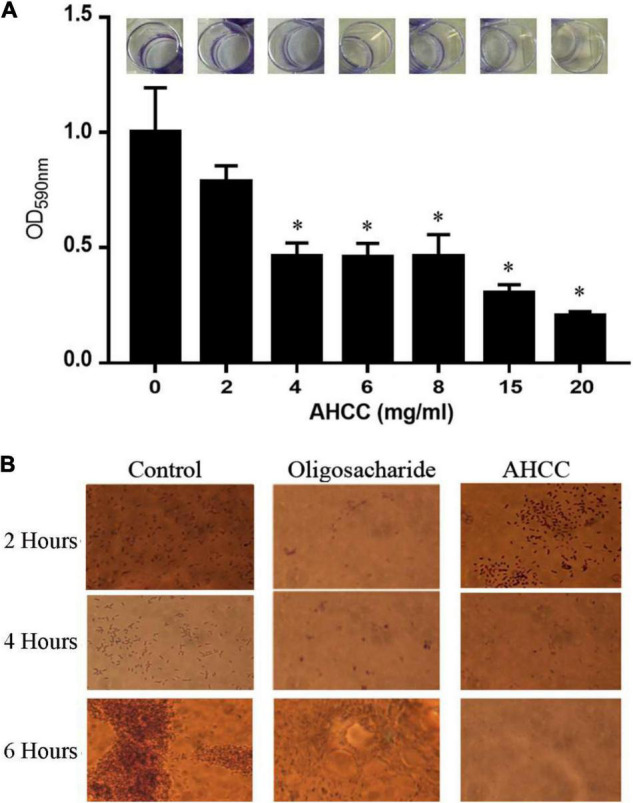
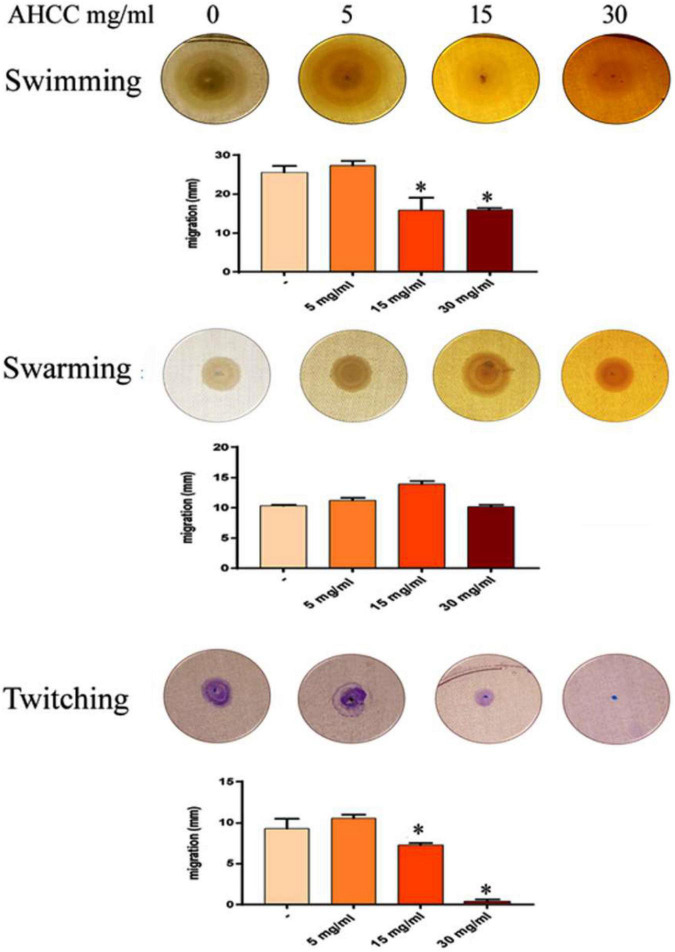
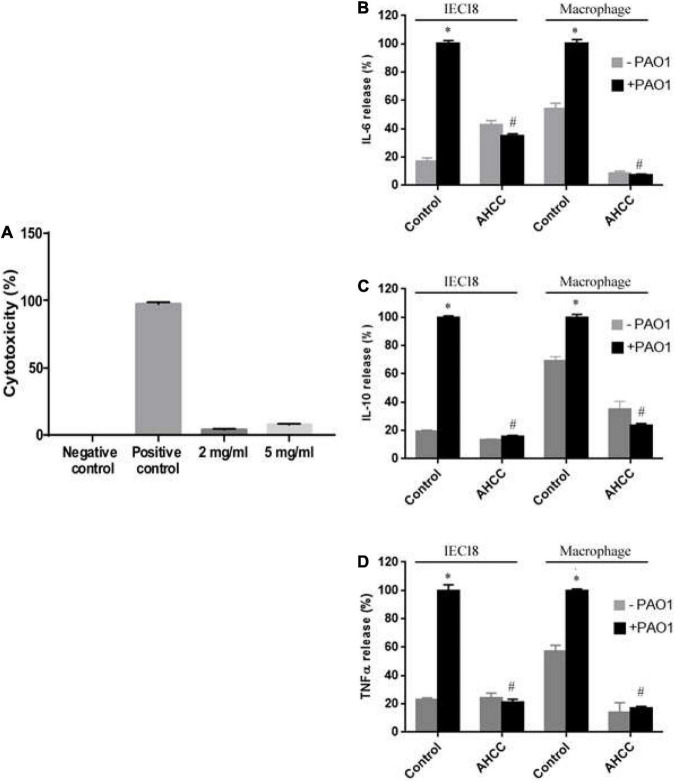
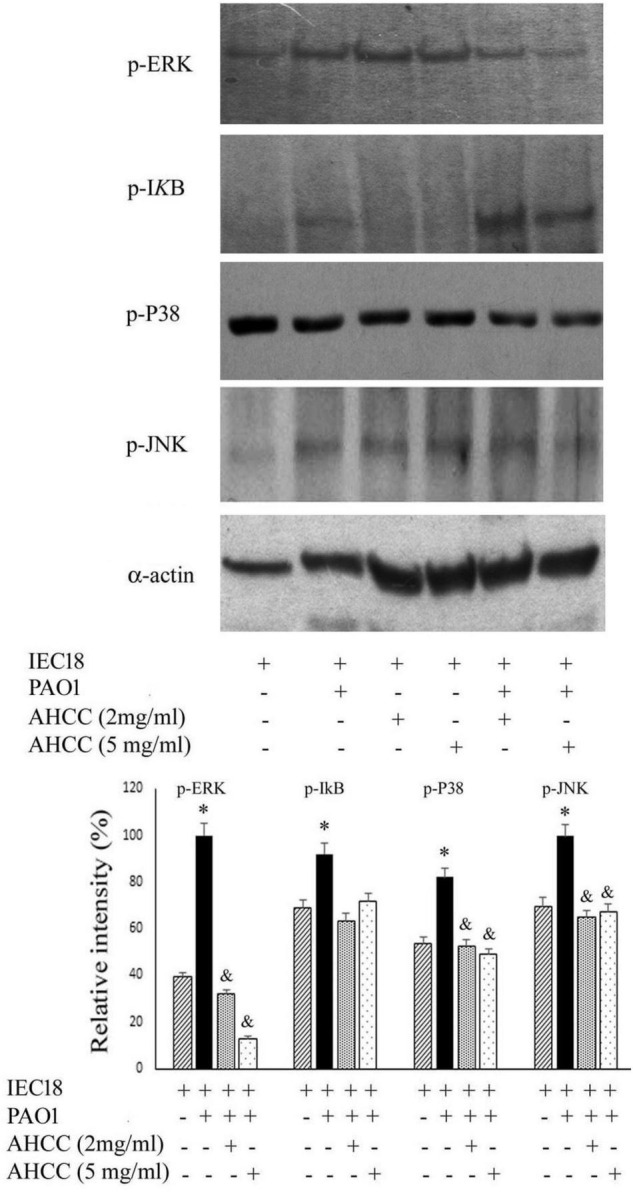
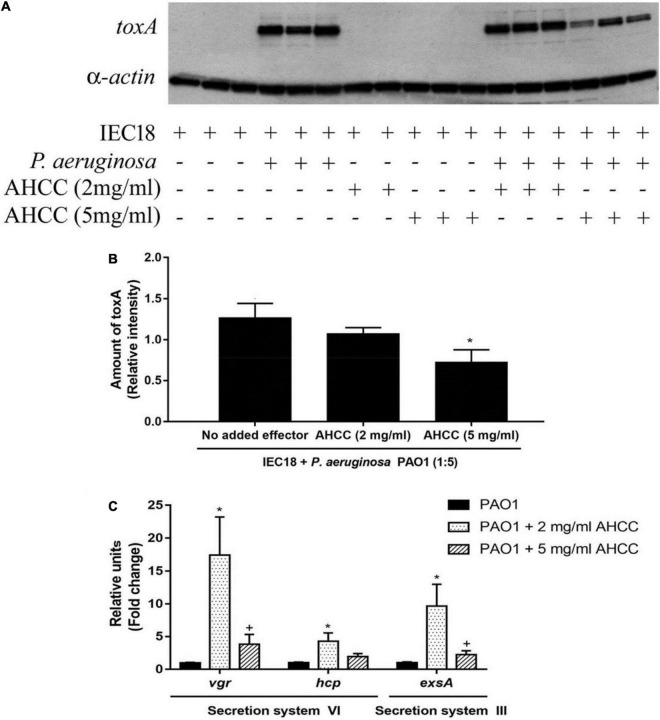
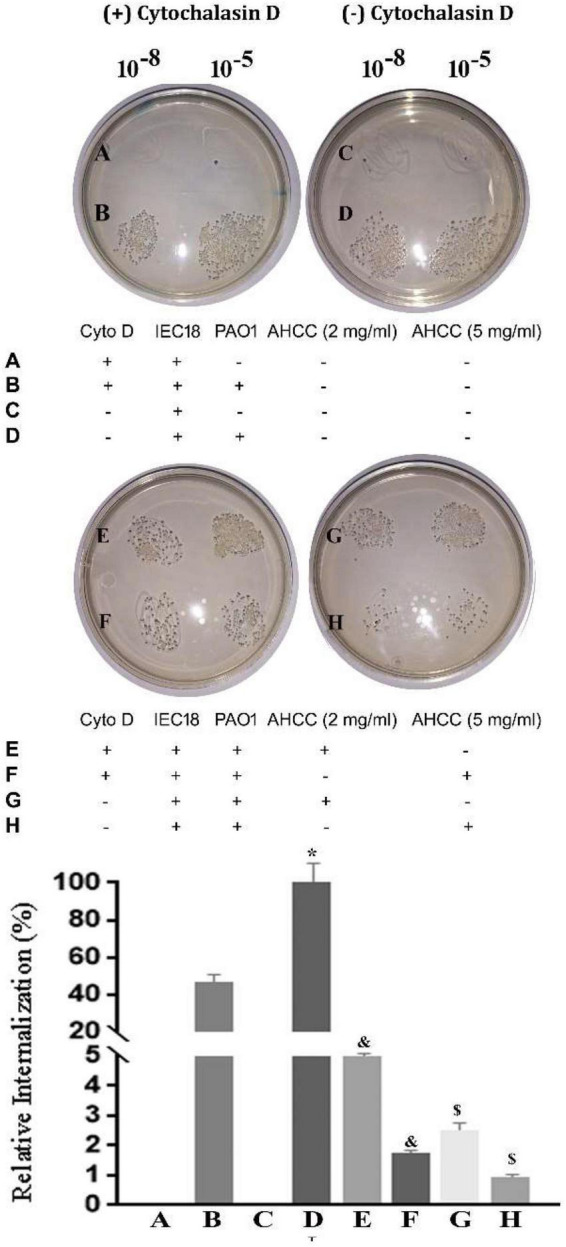
The priority pathogen list of the World Health Organization classified Pseudomonas aeruginosa as the second top critical pathogen. Hence, the development of novel antibacterial strategies to tackle this bacterium is highly necessary. Herein we explore the potential antibacterial effect of a standardized extract of cultured mycelium of Lentinula edodes (AHCC®) on P. aeruginosa. AHCC® was found to inhibit the growth rate and biofilm formation of strain PAO1. No change in swarming was observed, but AHCC® hampered swimming and twitching motility. In accordance, a decreased expression of metabolism, growth, and biofilm formation genes was shown. AHCC® also diminished the levels of exotoxin A and bacteria inside IEC18 cells and the secretion of IL-6, IL-10 and TNF by infected macrophages. This effect was related to a reduced phosphorylation of MAPKs and to bacteria internalization. Taken together, our data suggest that AHCC® has a potential role to prevent P. aeruginosa infections and may lead to the development of new therapies.

Keywords: AHCC®; PCR real time (qPCR); Pseudomonas aeruginosa; immune response; internalization; motility and biofilm; prebiotic; secretion system and adhesion.


Conflict of interest statement

The authors declare that the research was conducted in the absence of any commercial or financial relationships that could be construed as a potential conflict of interest.

Figures

FIGURE 1
FIGURE 1
Effect of AHCC® on the growth of P. aeruginosa. The growth curves in minimal medium M9 (A) and complete medium BHI (B) in the absence and presence of AHCC® at 5, 15 and 30 mg/mL are shown. As a control for the use of oligosaccharides as a carbon source when bacteria were grown in minimal medium M9 20 mg/mL of goat milk oligosaccharides (OS) was used. Growth curves were recorded at 37°C for 24 h. Representative data from one of three independent experiments with similar results are shown.
FIGURE 2
FIGURE 2
Formation of P. aeruginosa biofilm. (A) Biofilm formation in the absence and in the presence of different concentrations of AHCC® in 24-well plates. Biofilm formation was monitored in M9 minimal medium supplemented with 0.2% (w/v) glucose and casamino acids and quantified after 6 h. Then, the relative amount of biofilm formation in the experiments was represented against AHCC® concentration. Data are the average of three independent assays. (B) Microscopic inspection of biofilm formation in the absence and in the presence of 10 mg/mL of AHCC® at 2, 4 and 6 h.
FIGURE 3
FIGURE 3
Effects of AHCC® on the motility of P. aeruginosa. Motility assays were carried out as described in Materials and Methods. AHCC® at 5, 15 and 30 mg/mL was present in the agar plates and in the bacterial suspension. *p < 0.05 vs. control (ANOVA followed by least significance tests).
FIGURE 4
FIGURE 4
Toxicity and inflammatory response of AHCC® on macrophages and IEC 18 cells. Lactate dehydrogenase (LDH) as a marker of cytotoxicity was measured in the supernatants of IEC18 cells (A) exposed to AHCC® at 2 or 5 mg/mL. (B–D) Cytokine levels in the supernatant of IEC18 or macrophages. Cells were incubated with P. aeruginosa PAO1 (ratio 1/5) for 8 h in either the absence or the presence of 5 mg/mL AHCC® prior to the determination of IL-6 (B), IL-10 (C) and TNF secretion (D). Values are means ± s.e.m., n = 6–8; *p < 0.05 vs. cells without bacteria and #p < 0.05 vs. WT in the absence of AHCC® (ANOVA followed by least significance tests).
FIGURE 5
FIGURE 5
Inflammatory transduction pathways are modulated by AHCC®. Macrophage cells were cultured in the presence of P. aeruginosa in the absence or presence of 2 and 5 mg/mL AHCC®. After 8 h growth western blots were performed using the cell extracts and the corresponding antibody against specifics proteins. The following protein were detected: p-ERK (the phosphorylated form of Extracellular Regulated Kinase), p-P38 (Activated and phosphorylated form of P38 mitogen-activated protein kinases), p-JNK (Jun N-terminal kinases), p-IkB (phosphorylated form). As control, actin was quantified in all samples using α-actin antibody. Shown are duplicate sample in the absence of added effectors and triplicate samples in the presence of AHCC®. *p < 0.05 vs cells without bacteria. (ANOVA followed by least significance tests).
FIGURE 6
FIGURE 6
The gene expression of P. aeruginosa secretion systems and toxA are modulated by AHCC®. (A) Western blot determination of the cellular concentration of exotoxin A in IEC18 cells following co-culture with P. aeruginosa in the presence and absence of AHCC® at 2 and 5 mg/mL of concentration. (B) Densitometric analysis of above data. Exotoxin A densities were corrected with those obtained for α-actin. (C) Quantitative real time PCR studies of P. aeruginosa of cultures grown in the presence and absence of AHCC® at 2 and 5 mg/mL of concentration. The expression of genes encoding proteins of secretion systems III and VI are shown. Values are means ± S.E.M., n = 6–9; *p < 0.05 vs. without AHCC® (ANOVA followed by least significance tests).
FIGURE 7
FIGURE 7
Effect of AHCC® on internalization by IEC 18 in vitro. In the presence and in the absence of 8 μM Cyto D, the cells were synchronously infected with 10 CFU/cell for 60 min. Bacterial internalization was analyzed by automatically quantifying the growth colony forming units (CFU) (The experiment are performed in triplicated; mean ± S.E.M). The graph shows the mean percentage of bacterial internalization with respect to the sample control in the presence or absence of 20 mg/mL AHCC®. *p < 0.05 vs. without Cyto D and &p < 0.05 vs. without AHCC® (ANOVA followed by least significance tests).

References

    1. Abril M. A., Michan C., Timmis K. N., Ramos J. L. (1989). Regulator and enzyme specificities of the TOL plasmid-encoded upper pathway for degradation of aromatic hydrocarbons and expansion of the substrate range of the pathway. J. Bacteriol. 171 6782–6790. 10.1128/jb.171.12.6782-6790.1989 - DOI - PMC - PubMed
    1. Aloush V., Shiri N. V., Yardena S. I., Shaltiel C., Yehuda C. (2006). Multidrug-resistant Pseudomonas aeruginosa: risk factors and clinical impact. Antimicrob. Agents Chemother. 50 43–48. - PMC - PubMed
    1. Alvarez-Ortega C., Wiegand I., Olivares J., Hancock R. E., Martínez J. L. (2010). Genetic determinants involved inthe susceptibility of Pseudomonas aeruginosa to beta lactam antibiotics. Antimicrob. Agents Chemother. 54 4159–4167. - PMC - PubMed
    1. Amber S. J., Nancy H. D. (2008). Role of ampD homologs in overproduction of AmpC in clinical isolates of Pseudomonas aeruginosa. Antimicrob. Agents Chemother. 52 3922–3927. 10.1128/AAC.00341-08 - DOI - PMC - PubMed
    1. Ameer E., Qing W., Pierre C. (2012). The soluble pyocins S2 and S4 from Pseudomonas aeruginosa bind to the same FpvAI receptor. Microbiologyopen 1 268–275. 10.1002/mbo3.27 - DOI - PMC - PubMed