. 2022 Mar 16:13:859241.
doi: 10.3389/fmicb.2022.859241. eCollection 2022.

A New Way to Trace SARS-CoV-2 Variants Through Weighted Network Analysis of Frequency Trajectories of Mutations

Affiliations

A New Way to Trace SARS-CoV-2 Variants Through Weighted Network Analysis of Frequency Trajectories of Mutations

Qiang Huang et al. Front Microbiol. .

Abstract

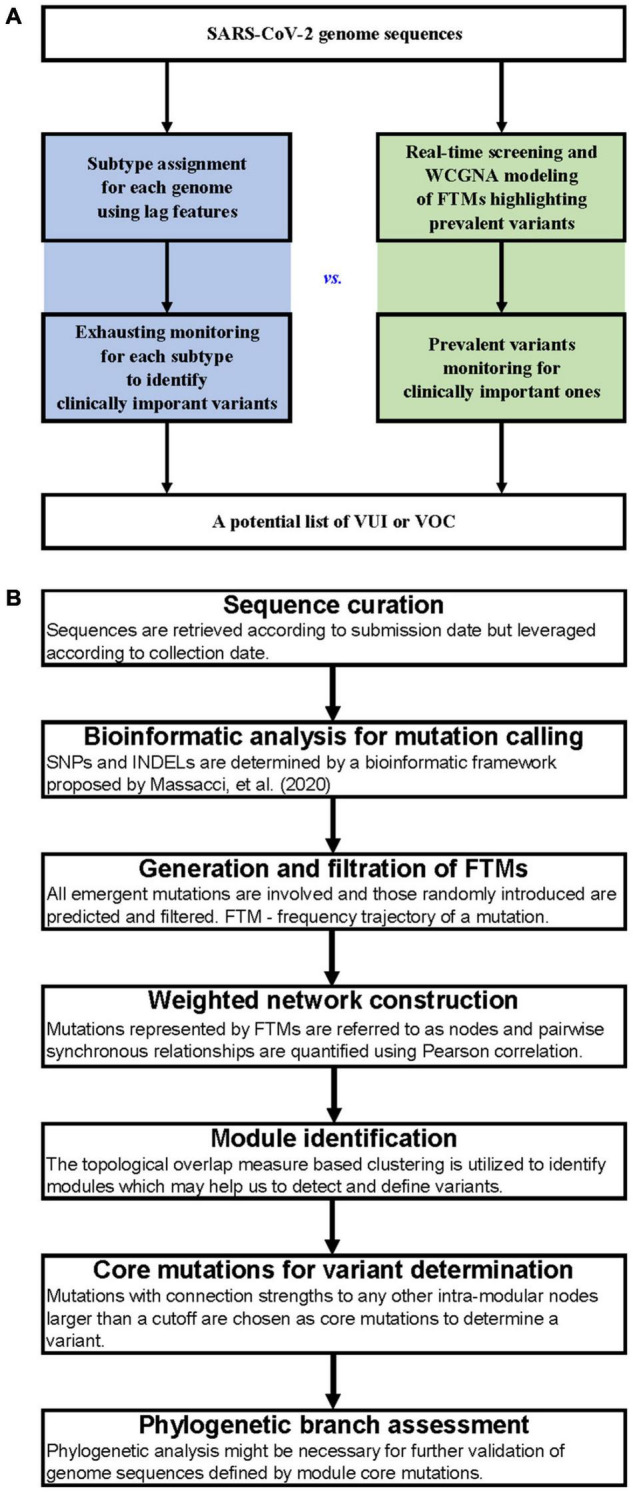
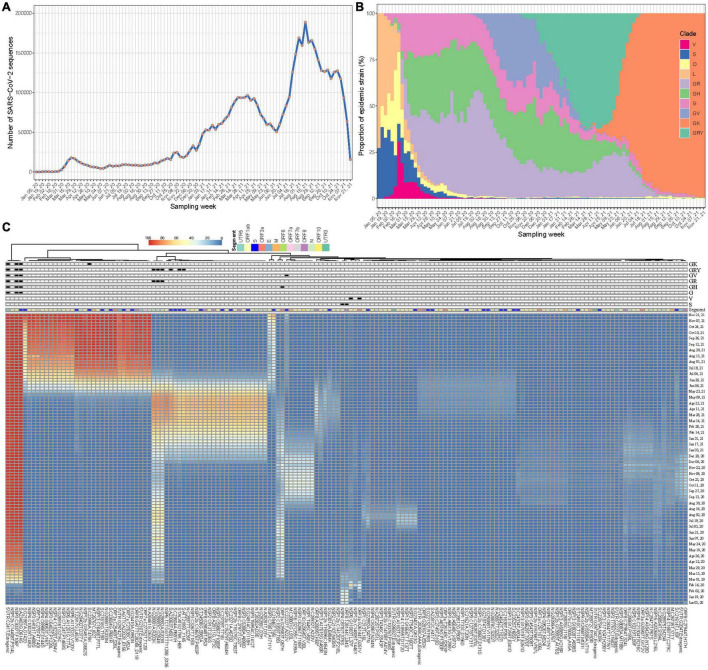
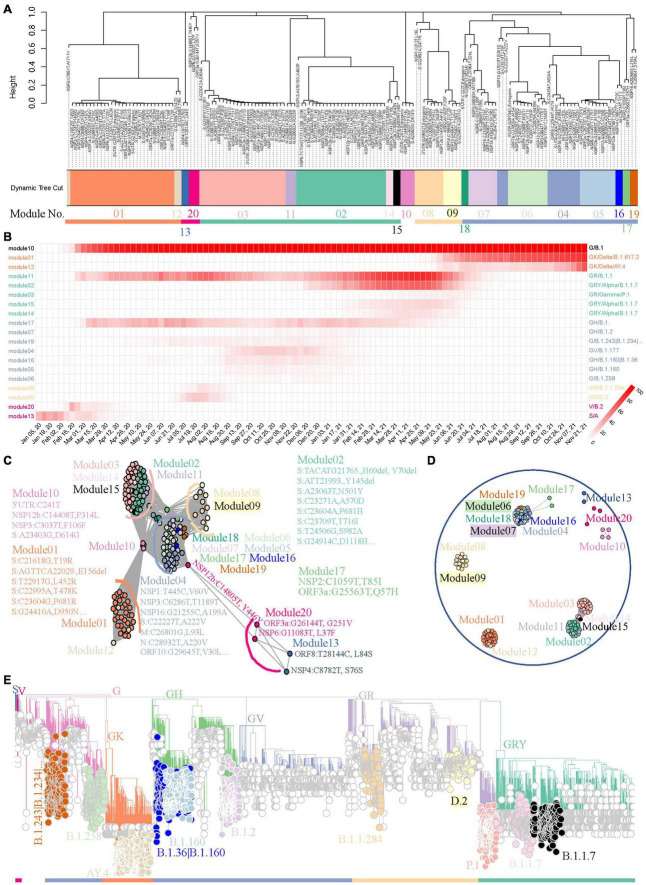
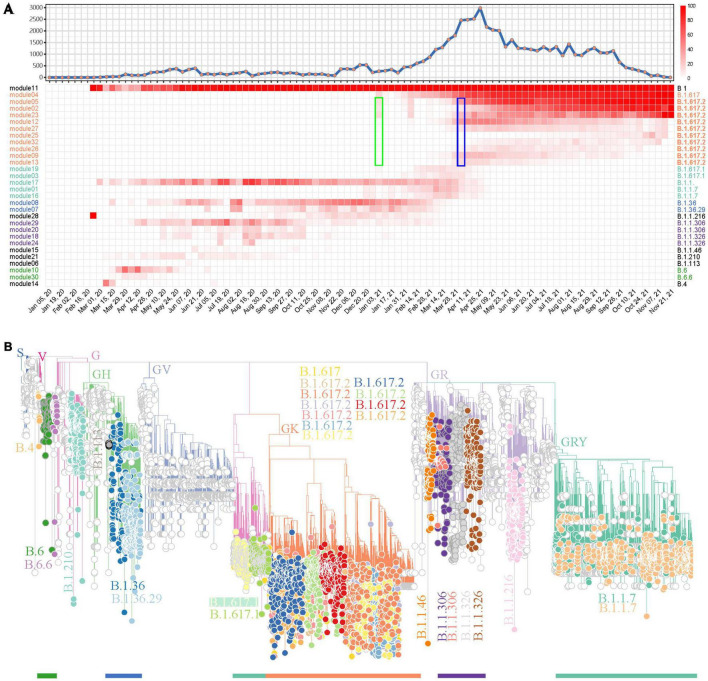
Early detection of SARS-CoV-2 variants enables timely tracking of clinically important strains in order to inform the public health response. Current subtype-based variant surveillance depending on prior subtype assignment according to lag features and their continuous risk assessment may delay this process. We proposed a weighted network framework to model the frequency trajectories of mutations (FTMs) for SARS-CoV-2 variant tracing, without requiring prior subtype assignment. This framework modularizes the FTMs and conglomerates synchronous FTMs together to represent the variants. It also generates module clusters to unveil the epidemic stages and their contemporaneous variants. Eventually, the module-based variants are assessed by phylogenetic tree through sub-sampling to facilitate communication and control of the epidemic. This process was benchmarked using worldwide GISAID data, which not only demonstrated all the methodology features but also showed the module-based variant identification had highly specific and sensitive mapping with the global phylogenetic tree. When applying this process to regional data like India and South Africa for SARS-CoV-2 variant surveillance, the approach clearly elucidated the national dispersal history of the viral variants and their co-circulation pattern, and provided much earlier warning of Beta (B.1.351), Delta (B.1.617.2), and Omicron (B.1.1.529). In summary, our work showed that the weighted network modeling of FTMs enables us to rapidly and easily track down SARS-CoV-2 variants overcoming prior viral subtyping with lag features, accelerating the understanding and surveillance of COVID-19.

Keywords: SARS-CoV-2; frequency trajectories; mutations; variant tracing; weighted network analysis.


Conflict of interest statement

The authors declare that the research was conducted in the absence of any commercial or financial relationships that could be construed as a potential conflict of interest.

Figures

FIGURE 1
FIGURE 1
Workflows for SARS-CoV-2 variant surveillance. (A) Workflow comparison between subtype-based and FTM-based variant surveillance methods. (B) Outline of a weighted network framework for variant surveillance using FTMs.
FIGURE 2
FIGURE 2
Synchronous temporal changes between variant-specific FTMs and variant prevalence. (A) Weekly distribution of SARS-CoV-2 genome sequences according to sampling time. (B) Time course of major variant distribution in collected sequences. (C) A Wald’s linkage hierarchical cluster tree of frequency trajectories of mutations. One hundred and fifty-eight mutations passing filtration were analyzed, annotated and displayed. Variant-specific mutations were flagged.
FIGURE 3
FIGURE 3
A benchmark to use weighted network framework for identification of worldwide pandemic variants. (A) Clustering dendrogram of 158 FTMs from GISAID worldwide data. The module numbers are labeled and module clusters are highlighted with different colors. (B) The heatmap of module-based variant prevalence. The variants were determined by core mutations within each module. The modules were reordered and colored according to their module clusters and time course. (C) Network graph with topology overlap values > 10– 3 to show the relationship between nodes and modules of the weighted network. (D) Network graph with topology overlap values > 0.1. (E) Phylogenic evaluation of detected worldwide pandemic variants. Time-resolved maximum clade credibility phylogeny is shown and identified variants are highlighted and annotated with visually friendly colors.
FIGURE 4
FIGURE 4
A demonstration to identify SARS-CoV-2 variants prevalent in India using the weighted network. (A) Weekly distribution of SARS-CoV-2 genome sequences according to sampling time (top) and the heatmap of module-based variant prevalence (bottom). Core mutations within each module were used to define the variants. The modules were reordered and colored according to their module clusters and time course. The weeks when Delta (B.1.617.2) was identified as a prevalent variant by network model (green) or reported as a VUI by WHO (blue) are highlighted by rectangles. (B) Phylogenic evaluation of detected endemic SARS-CoV-2 variants in South Africa. The detected variants are highlighted and annotated with visually friendly colors.
FIGURE 5
FIGURE 5
SARS-CoV-2 variant surveillance in South Africa using the weighted network. (A) Weekly distribution of SARS-CoV-2 genome sequences according to sampling time (top) and the heatmap of module-based variant prevalence (bottom). Core mutations within each module were used to define the variants. The modules were reordered and colored according to their module clusters and time course. The weeks when Omicron (B.1.1.529) and Beta (B.1.351) were identified as prevalent variants by network model (green) or reported as VUI or VOC by WHO (blue) are highlighted by rectangles. (B–E) Phylogenic evaluation of every major SARS-CoV-2 variant detected in South Africa, including Omicron (B), Delta (C), Beta (D) and C.1 (E). The module-based variants having consistent classification with Pangolin lineages are labeled.

Similar articles

Cited by

References

    1. Bernasconi A., Mari L., Casagrandi R., Ceri S. (2021). Data-driven analysis of amino acid change dynamics timely reveals SARS-CoV-2 variant emergence. Sci. Rep. 11:21068. 10.1038/s41598-021-00496-z - DOI - PMC - PubMed
    1. Chakraborty D., Agrawal A., Maiti S. (2021). Rapid identification and tracking of SARS-CoV-2 variants of concern. Lancet 397 1346–1347. 10.1016/s0140-6736(21)00470-0 - DOI - PMC - PubMed
    1. Chiara M., Horner D. S., Gissi C., Pesole G. (2021). Comparative genomics reveals early emergence and biased spatiotemporal distribution of SARS-CoV-2. Mol. Biol. Evol. 38 2547–2565. 10.1093/molbev/msab049 - DOI - PMC - PubMed
    1. Csárdi G., Nepusz T. (2006). The igraph software package for complex network research. InterJ. Complex Syst. 1695 1–9.
    1. Grubaugh N. D., Hodcroft E. B., Fauver J. R., Phelan A. L., Cevik M. (2021). Public health actions to control new SARS-CoV-2 variants. Cell 184 1127–1132. 10.1016/j.cell.2021.01.044 - DOI - PMC - PubMed