

Trends and disparities in the utilization of influenza vaccines among commercially insured US adults during the COVID-19 pandemic
- PMID: 35370018
- PMCID: PMC8960160
- DOI: 10.1016/j.vaccine.2022.03.058
Trends and disparities in the utilization of influenza vaccines among commercially insured US adults during the COVID-19 pandemic
Abstract
Objectives: Little is known about how the coronavirus disease 2019 (COVID-19) pandemic affected influenza vaccine utilization and disparities. We sought to estimate changes in the likelihood of receiving an influenza vaccine across different demographic subgroups during the COVID-19 pandemic.
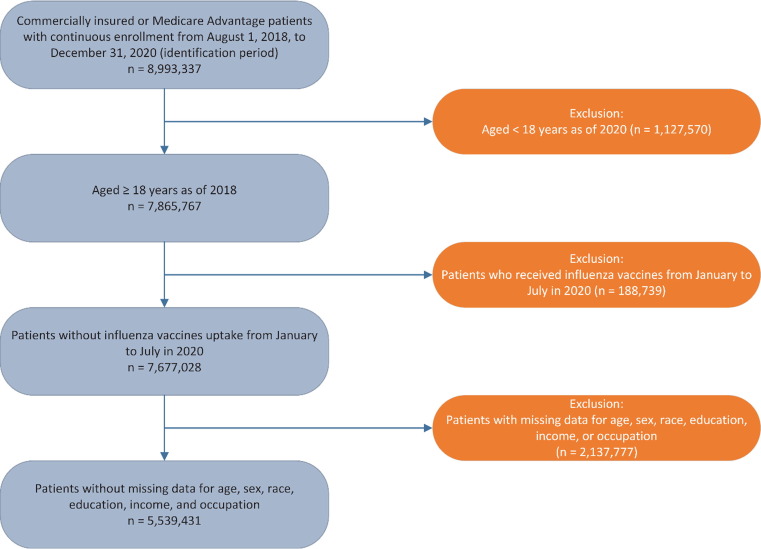
Methods: In this cohort study, we analyzed influenza vaccine uptake from 2019 to 2020 using Optum commercial insurance claims data. Eligible individuals were aged 18 or above in 2018 and continuously enrolled from 08/01/2018 through 12/31/2020. Multivariable logistic regressions were fitted for the individual-level influenza vaccine uptake. Adjusting for demographic factors and medical histories, we estimated probabilities of receiving influenza vaccines before and after the COVID-19 pandemic across demographic subgroups.
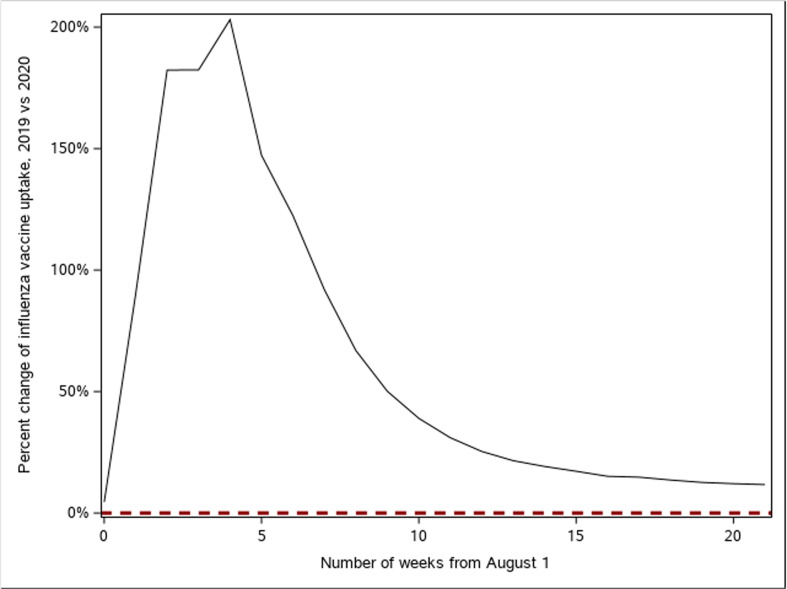
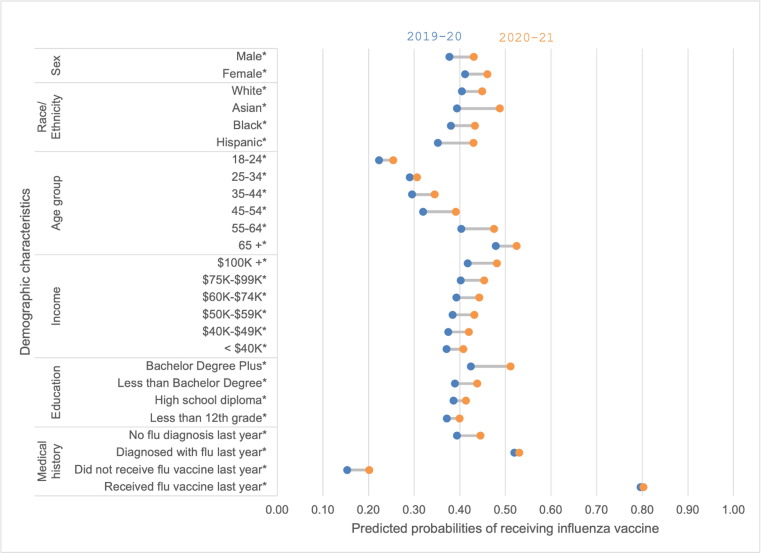
Results: From August to December 2019, unadjusted influenza vaccination rate was 42.3%, while in the same period of 2020, the vaccination rate increased to 45.9%. Females had a higher vaccination rate in 2019 (OR: 1.16, 95% CI 1.15-1.16), but the increase was larger for males. Blacks and Hispanics had lower vaccination rates relative to whites in both flu seasons. Hispanics showed a greater increase in vaccination rate, increasing by 7.8 percentage points (p < .001) compared to 4.4 (p < .001) for whites. The vaccination rate for Blacks increased by 5.2 percentage points (p < .001). All income groups experienced vaccination improvements, but poorer individuals had lower vaccination rates in both seasons. The most profound disparities occurred when educational cohort were considered. The vaccination rate increased among college-educated enrollees by 8.8 percentage points (p < .001) during the pandemic compared to an increase of 2.8 percentage points (p < .001) for enrollees with less than a 12th grade education. Past influenza infections or vaccination increased the likelihood of vaccination (p < .001).
Conclusions: The COVID-19 pandemic was associated with increased influenza vaccine utilization. Disparities persisted but narrowed with respect to gender and race but worsened with respect to income and educational attainment.
Keywords: COVID-19; Health Disparity; Influenza; Vaccination.
Copyright © 2022 Elsevier Ltd. All rights reserved.
Conflict of interest statement
Declaration of Competing Interest The authors declare that they have no known competing financial interests or personal relationships that could have appeared to influence the work reported in this paper.
Figures
References
-
- CDC. Flu Vaccination Coverage, United States, 2019–20 Influenza Season. Published October 1, 2020. Accessed August 17, 2021. https://www.cdc.gov/flu/fluvaxview/coverage-1920estimates.htm.
-
- CDC. Racial and Ethnic Minority Groups. Centers for Disease Control and Prevention. Published July 6, 2021. Accessed August 17, 2021. https://www.cdc.gov/flu/highrisk/disparities-racial-ethnic-minority-grou....
MeSH terms
Substances
LinkOut - more resources
Full Text Sources
Medical
Miscellaneous
