. 2022 Apr 4;7(1):98.
doi: 10.1038/s41392-022-00915-1.

Identification of NOXA as a pivotal regulator of resistance to CAR T-cell therapy in B-cell malignancies

Affiliations

Identification of NOXA as a pivotal regulator of resistance to CAR T-cell therapy in B-cell malignancies

Xin Yan et al. Signal Transduct Target Ther. .

Abstract

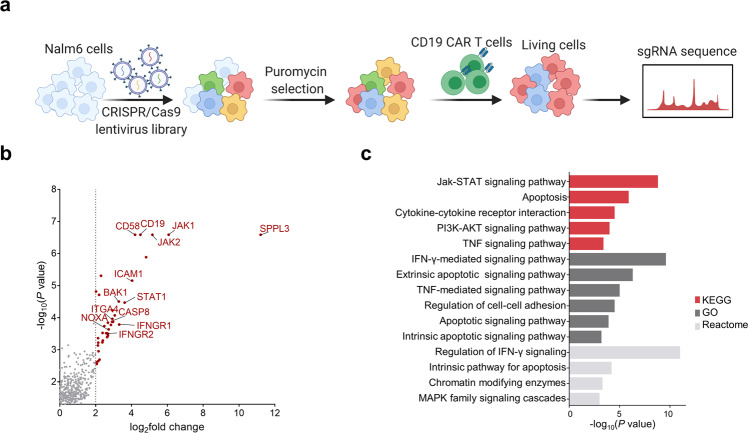
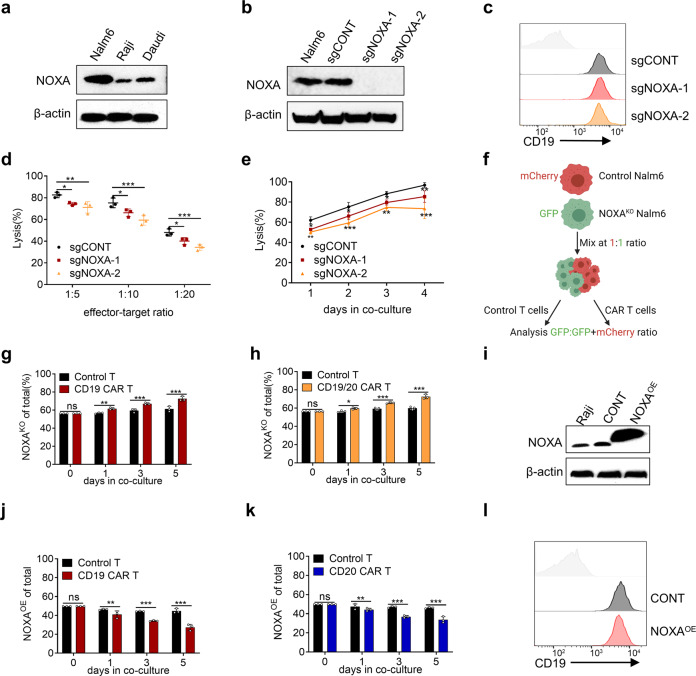
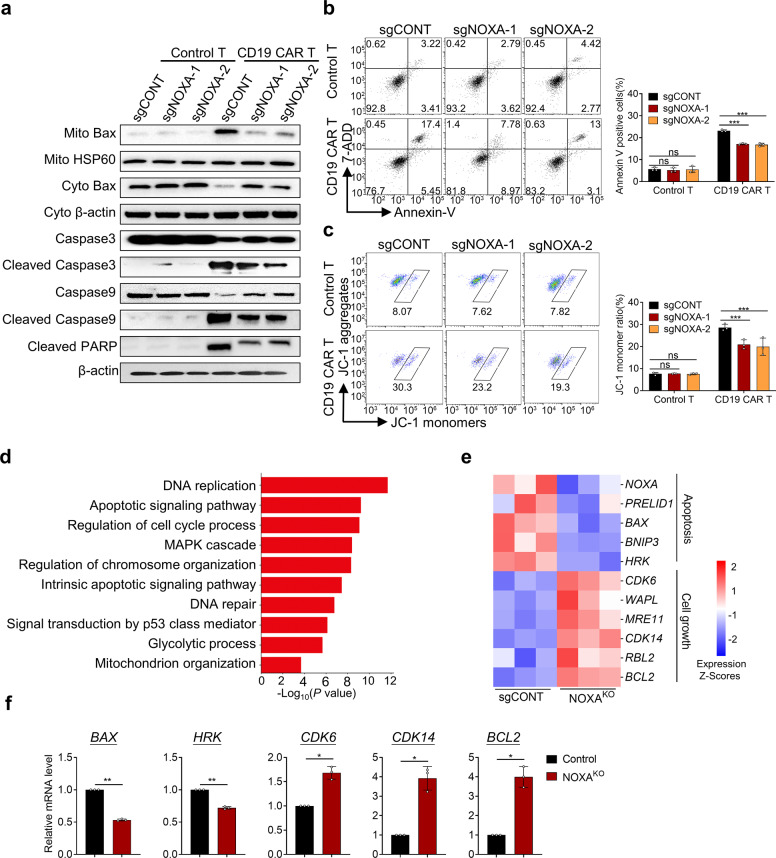
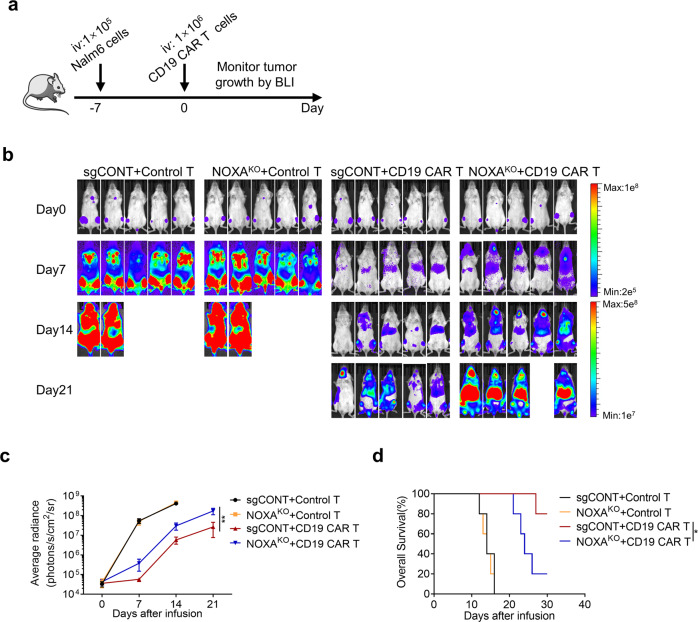
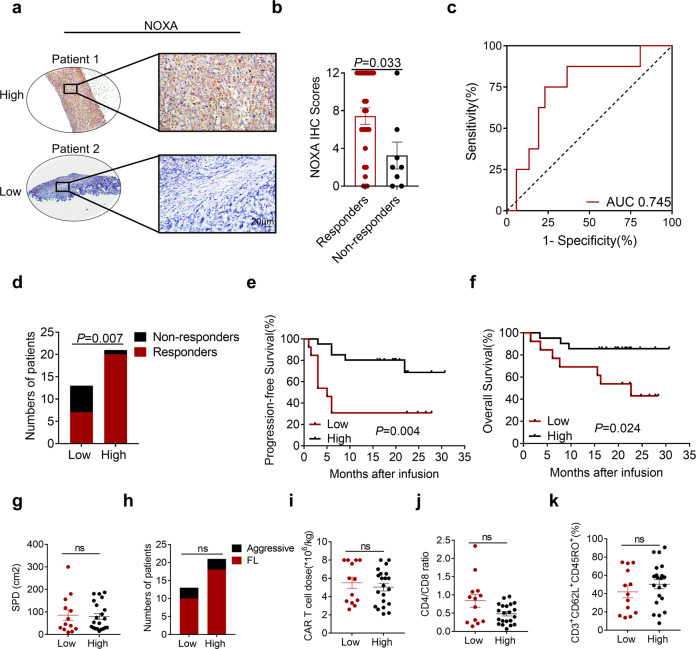
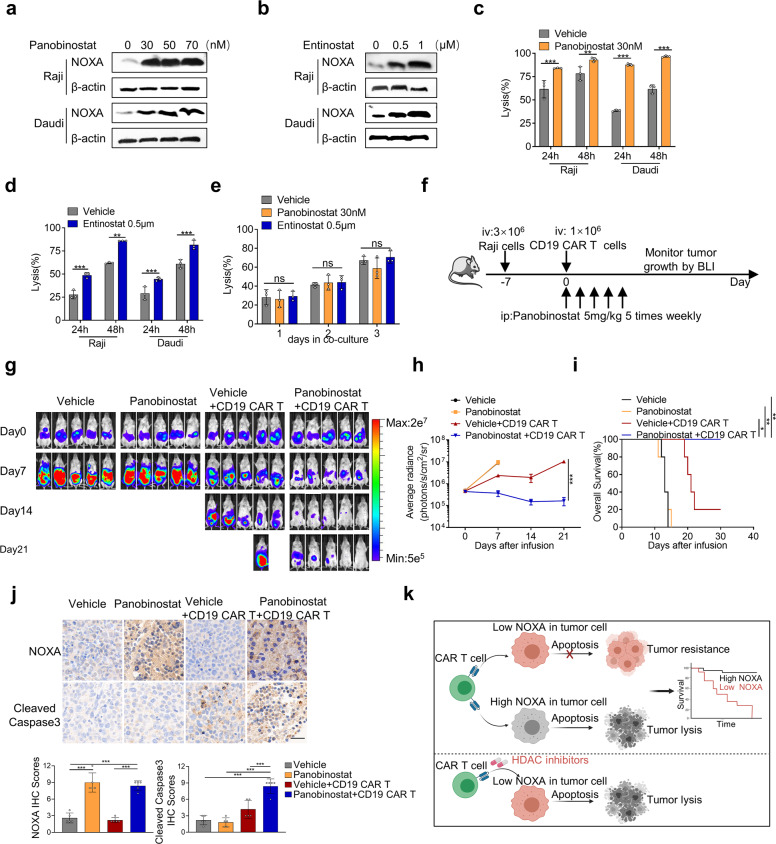
Despite the remarkable success of chimeric antigen receptor (CAR) T-cell therapy for treating hematologic malignancies, resistance and recurrence still occur, while the markers or mechanisms underlying this resistance remain poorly understood. Here, via an unbiased genome-wide CRISPR/Cas9 screening, we identified loss of NOXA, a B-cell lymphoma 2 (BCL2) family protein in B-cell malignancies, as a pivotal regulator of resistance to CAR T-cell therapy by impairing apoptosis of tumor cells both in vitro and in vivo. Notably, low NOXA expression in tumor samples was correlated with worse survival in a tandem CD19/20 CAR T clinical trial in relapsed/refractory B-cell lymphoma. In contrast, pharmacological augmentation of NOXA expression by histone deacetylase (HDAC) inhibitors dramatically sensitized cancer cells to CAR T cell-mediated clearance in vitro and in vivo. Our work revealed the essentiality of NOXA in resistance to CAR T-cell therapy and suggested NOXA as a predictive marker for response and survival in patients receiving CAR T-cell transfusions. Pharmacological targeting of NOXA might provide an innovative therapeutic strategy to enhance CAR T-cell therapy.


Conflict of interest statement

The authors declare no competing interests.

Figures

Fig. 1
Fig. 1
Genome-wide CRISPR/Cas9 screening in Nalm6 cells cocultured with CD19 CAR T cells. a Schematic of the CRISPR/Cas9 screening. b Volcano plots of essential enriched sgRNAs after screening. c KEGG, GO, and Reactome pathway enrichment analysis of genes identified in CRISPR screening
Fig. 2
Fig. 2
NOXA plays a pivotal role in resistance to CAR T cells. a Western blot analysis of NOXA protein levels in CD19+ B-lymphoid cell lines. b Western blot analysis of NOXA protein levels in the sgCONT and NOXAKO Nalm6 cell lines. c Flow cytometry analysis of the level of CD19 expression in the sgCONT and NOXAKO Nalm6 cell lines. d Cytotoxic analysis of sgCONT and NOXAKO Nalm6 cells cocultured with CD19 CAR T cells on day 2 at different E:T ratio. e Cytotoxic analysis of sgCONT and NOXAKO Nalm6 cells cocultured with CD19 CAR T cells (1:10 E:T ratio) over time. f Experimental design of growth competition assay. g, h mCherry+ sgCONT Nalm6 cells were combined with GFP+ NOXAKO Nalm6 cells at an ~1:1 ratio and cocultured with CD19 CAR T or tandem CD19/20 CAR T cells. The proportion of GFP+ tumor cells over time is shown. i Western blot analysis of NOXA protein levels in control and NOXAOE Raji cells. j, k mCherry+ control Raji cells were combined with GFP+ NOXAOE Raji cells at an ~1:1 ratio and cocultured with CD19 CAR T or CD20 CAR T cells. The proportion of GFP+ tumor cells over time is shown. l Flow cytometry analysis of the level of CD19 expression in control and NOXAOE cell lines. Differences among groups were calculated with two-way ANOVA tests. Values are shown as the mean ± SD of triplicates. *P < 0.05, **P < 0.01, and ***P < 0.001
Fig. 3
Fig. 3
NOXA knockout induces resistance to CAR T cells via the apoptotic pathway. a sgCONT and NOXAKO Nalm6 cells were treated with control or CD19 CAR T cells before western blotting assays. Mitochondrial protein levels were normalized to HSP60, and the cytosolic protein and total protein levels were normalized to β-actin. b, c sgCONT and NOXAKO Nalm6 cells were collected and stained with Annexin V/7-ADD and JC-1 and analyzed by flow cytometry after coculture with control or CD19 CAR T cells. d GO enrichment analysis of differentially expressed genes between sgCONT and NOXAKO Nalm6 cells in biological process functions. e Heatmap of selected genes with differential expression (P < 0.05) related to apoptosis and cell growth between sgCONT and NOXAKO cells after coculture with CD19 CAR T cells. f BAX, HRK, CDK6, CDK14, and BCL2 expression was compared between sgCONT and NOXAKO cells after coculture with CD19 CAR T cells by real-time PCR. Differences among groups were calculated with two-way ANOVA tests. Values are shown as the mean ± SD of triplicates. ns: not significant (P > 0.05); *P < 0.05, **P < 0.01, and ***P < 0.001
Fig. 4
Fig. 4
Knockout of NOXA reduces the sensitivity of tumor cells to CAR T-cell therapy in vivo. a Experimental timeline comparing the susceptibility of sgCONT Nalm6 and NOXAKO Nalm6 tumor-bearing mice to CD19 CAR T cells. b Nalm6 tumor progression as evaluated by bioluminescence imaging (n = 5 mice per group). c Mouse tumor burden (average radiance). The indicated P value was determined by two-way ANOVA test. d Survival of mice inoculated with sgCONT or NOXAKO Nalm6 cells and treated with control T cells or CD19 CAR T cells. Log-rank tests were used to determine statistical significance. Values are shown as the mean ± SD of five mice per group. ns: not significant (P > 0.05); *P < 0.05, **P < 0.01, and ***P < 0.001
Fig. 5
Fig. 5
NOXA expression is related to clinical outcomes after CAR T-cell infusion. a Representative images of immunohistochemical (IHC) staining for high and low NOXA expression in R/R B-cell lymphoma before treatment with tandem CD19/CD20 CAR T cells. The outlined areas in the left images are magnified on the right. Scale bars, 20 μm. b NOXA expression scores by IHC in responders and non-responders. A two-tailed Student’s t test was used to analyze the differences between two groups. c The ROC curve of NOXA IHC scores in responders and non-responders. d The number of responders and non-responders in the low NOXA expression group and high NOXA expression group. A Fisher’s exact test was used for analysis. e, f Kaplan–Meier plot of progression-free survival and overall survival in the low NOXA expression group and high NOXA expression group. Log-rank tests were used to analyze the significance between the two groups. gk Baseline characteristics of patients and transfused CAR T cells between two groups, including tumor burden, lymphoma type, CAR T-cell dose, CD4/CD8 ratio, and memory phenotype Two-tailed Student’s t test were used to analyze the differences between two groups. Values are shown as the mean ± SD. ns: not significant (P > 0.05); *P < 0.05, **P < 0.01, and ***P < 0.001
Fig. 6
Fig. 6
Histone deacetylase inhibitors could enhance tumor cell vulnerability to CAR T cells. a, b Western blot analysis of Raji cells and Daudi cells treated with panobinostat (a) or entinostat (b) for 24 h. c, d Cytotoxic analysis of Raji cells and Daudi cells pretreated with 30 nM panobinostat (c) or 0.5 μM entinostat (d) for 24 h and then cocultured with CD19 CAR T cells over time. e Cytotoxic analysis of NOXAKO Nalm6 cells pretreated with 30 nM panobinostat or 0.5 μM entinostat for 24 h and then cocultured with CD19 CAR T cells over time. Values in (ae) were shown as the mean ± SD of triplicates. f Experimental timeline comparing the antitumor ability of vehicle alone, panobinostat alone, the combination of vehicle and CD19 CAR T cells, and combination of panobinostat and CD19 CAR T cells in mice bearing Raji-luc xenograft tumors (n = 5 mice per group). g Raji tumor progression as evaluated by bioluminescence imaging. h Mouse tumor burden (average radiance). The indicated P value was determined by two-way ANOVA test. i Survival analyses of mice treated with vehicle alone, panobinostat alone, the combination of vehicle and CD19 CAR T cells, and combination of panobinostat and CD19 CAR T cells. Log-rank tests were used to analyze the significance between four groups. j Representative images of IHC staining for NOXA and cleaved caspase3 from Raji tumor xenografts treated with the indicated treatments. Magnification: ×40, Scale bars: 20 μm. Quantification of IHC staining using IHC scores was represented as mean ± SD of five mice per group. P values were calculated with the two-tailed Student’s t test. k Schematic drawing summarizing our findings. Values are shown as the mean ± SD. ns: not significant (P > 0.05); *P < 0.05, **P < 0.01, and ***P < 0.001

References

    1. Schuster SJ, et al. Chimeric antigen receptor T cells in refractory B-cell lymphomas. N. Engl. J. Med. 2017;377:2545–2554. - PMC - PubMed
    1. Neelapu SS, et al. Axicabtagene ciloleucel CAR T-cell therapy in refractory large B-cell lymphoma. N. Engl. J. Med. 2017;377:2531–2544. - PMC - PubMed
    1. Locke FL, et al. Phase 1 results of ZUMA-1: a multicenter study of KTE-C19 anti-CD19 CAR T cell therapy in refractory aggressive lymphoma. Mol. Ther. 2017;25:285–295. - PMC - PubMed
    1. Maude SL, et al. Chimeric antigen receptor T cells for sustained remissions in leukemia. N. Engl. J. Med. 2014;371:1507–1517. - PMC - PubMed
    1. Mullard A. FDA approves fourth CAR-T cell therapy. Nat. Rev. Drug Discov. 2021;20:166. - PubMed

Publication types