

Loss of KCC2 in GABAergic Neurons Causes Seizures and an Imbalance of Cortical Interneurons
- PMID: 35370549
- PMCID: PMC8966887
- DOI: 10.3389/fnmol.2022.826427
Loss of KCC2 in GABAergic Neurons Causes Seizures and an Imbalance of Cortical Interneurons
Abstract
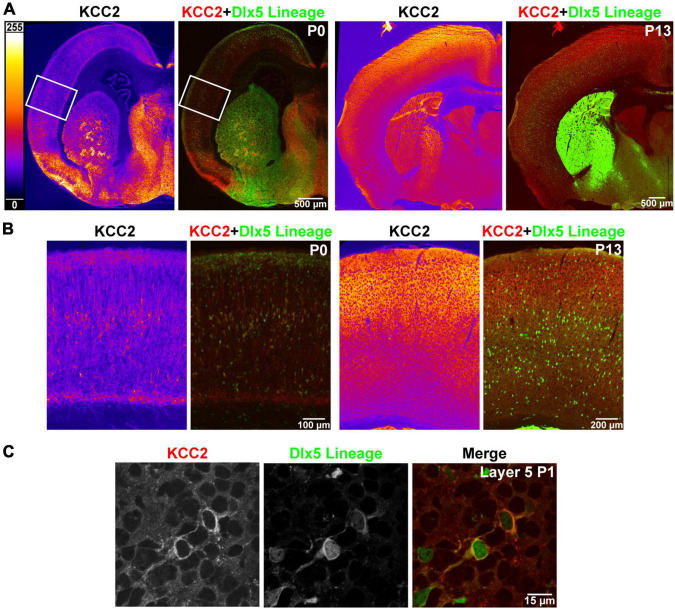
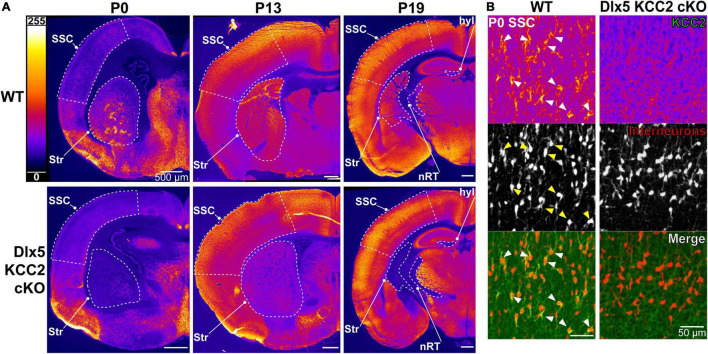
K-Cl transporter KCC2 is an important regulator of neuronal development and neuronal function at maturity. Through its canonical transporter role, KCC2 maintains inhibitory responses mediated by γ-aminobutyric acid (GABA) type A receptors. During development, late onset of KCC2 transporter activity defines the period when depolarizing GABAergic signals promote a wealth of developmental processes. In addition to its transporter function, KCC2 directly interacts with a number of proteins to regulate dendritic spine formation, cell survival, synaptic plasticity, neuronal excitability, and other processes. Either overexpression or loss of KCC2 can lead to abnormal circuit formation, seizures, or even perinatal death. GABA has been reported to be especially important for driving migration and development of cortical interneurons (IN), and we hypothesized that properly timed onset of KCC2 expression is vital to this process. To test this hypothesis, we created a mouse with conditional knockout of KCC2 in Dlx5-lineage neurons (Dlx5 KCC2 cKO), which targets INs and other post-mitotic GABAergic neurons in the forebrain starting during embryonic development. While KCC2 was first expressed in the INs of layer 5 cortex, perinatal IN migrations and laminar localization appeared to be unaffected by the loss of KCC2. Nonetheless, the mice had early seizures, failure to thrive, and premature death in the second and third weeks of life. At this age, we found an underlying change in IN distribution, including an excess number of somatostatin neurons in layer 5 and a decrease in parvalbumin-expressing neurons in layer 2/3 and layer 6. Our research suggests that while KCC2 expression may not be entirely necessary for early IN migration, loss of KCC2 causes an imbalance in cortical interneuron subtypes, seizures, and early death. More work will be needed to define the specific cellular basis for these findings, including whether they are due to abnormal circuit formation versus the sequela of defective IN inhibition.
Keywords: KCC2; development; excitatory GABA; excitatory/inhibitory balance; interneuron; parvalbumin interneuron; seizure; somatostatin interneuron.
Copyright © 2022 Zavalin, Hassan, Fu, Delpire and Lagrange.
Conflict of interest statement
The authors declare that the research was conducted in the absence of any commercial or financial relationships that could be construed as a potential conflict of interest.
Figures


Similar articles
-
GABAA-Receptor Signaling and Ionic Plasticity in the Generation and Spread of Seizures.In: Noebels JL, Avoli M, Rogawski MA, Vezzani A, Delgado-Escueta AV, editors. Jasper's Basic Mechanisms of the Epilepsies. 5th edition. New York: Oxford University Press; 2024. Chapter 6. In: Noebels JL, Avoli M, Rogawski MA, Vezzani A, Delgado-Escueta AV, editors. Jasper's Basic Mechanisms of the Epilepsies. 5th edition. New York: Oxford University Press; 2024. Chapter 6. PMID: 39637123 Free Books & Documents. Review.
-
Cortical Parvalbumin-Positive Interneuron Development and Function Are Altered in the APC Conditional Knockout Mouse Model of Infantile and Epileptic Spasms Syndrome.J Neurosci. 2023 Feb 22;43(8):1422-1440. doi: 10.1523/JNEUROSCI.0572-22.2022. Epub 2023 Jan 30. J Neurosci. 2023. PMID: 36717229 Free PMC article.
-
Cation-chloride cotransporters and the polarity of GABA signalling in mouse hippocampal parvalbumin interneurons.J Physiol. 2020 May;598(10):1865-1880. doi: 10.1113/JP279221. Epub 2020 Feb 17. J Physiol. 2020. PMID: 32012273
-
Disruption of KCC2 in Parvalbumin-Positive Interneurons Is Associated With a Decreased Seizure Threshold and a Progressive Loss of Parvalbumin-Positive Interneurons.Front Mol Neurosci. 2022 Feb 3;14:807090. doi: 10.3389/fnmol.2021.807090. eCollection 2021. Front Mol Neurosci. 2022. PMID: 35185464 Free PMC article.
-
The Therapeutic Potential of Neuronal K-Cl Co-Transporter KCC2 in Huntington's Disease and Its Comorbidities.Int J Mol Sci. 2020 Nov 30;21(23):9142. doi: 10.3390/ijms21239142. Int J Mol Sci. 2020. PMID: 33266310 Free PMC article. Review.
Cited by
-
Interneuron odyssey: molecular mechanisms of tangential migration.Front Neural Circuits. 2023 Sep 14;17:1256455. doi: 10.3389/fncir.2023.1256455. eCollection 2023. Front Neural Circuits. 2023. PMID: 37779671 Free PMC article. Review.
-
Rett and Rett-related disorders: Common mechanisms for shared symptoms?Exp Biol Med (Maywood). 2023 Nov;248(22):2095-2108. doi: 10.1177/15353702231209419. Epub 2023 Dec 6. Exp Biol Med (Maywood). 2023. PMID: 38057990 Free PMC article. Review.
-
Developmental loss of NMDA receptors results in supernumerary forebrain neurons through delayed maturation of transit-amplifying neuroblasts.Sci Rep. 2024 Feb 9;14(1):3395. doi: 10.1038/s41598-024-53910-7. Sci Rep. 2024. PMID: 38336823 Free PMC article.
-
Layer-specific changes of KCC2 and NKCC1 in the mouse dentate gyrus after entorhinal denervation.Front Mol Neurosci. 2023 May 24;16:1118746. doi: 10.3389/fnmol.2023.1118746. eCollection 2023. Front Mol Neurosci. 2023. PMID: 37293543 Free PMC article.
-
High Doses of ANA12 Improve Phenobarbital Efficacy in a Model of Neonatal Post-Ischemic Seizures.Int J Mol Sci. 2024 Jan 24;25(3):1447. doi: 10.3390/ijms25031447. Int J Mol Sci. 2024. PMID: 38338726 Free PMC article.
References
Grants and funding
LinkOut - more resources
Full Text Sources
Molecular Biology Databases