

External Evaluation of Risperidone Population Pharmacokinetic Models Using Opportunistic Pediatric Data
- PMID: 35370711
- PMCID: PMC8969425
- DOI: 10.3389/fphar.2022.817276
External Evaluation of Risperidone Population Pharmacokinetic Models Using Opportunistic Pediatric Data
Abstract
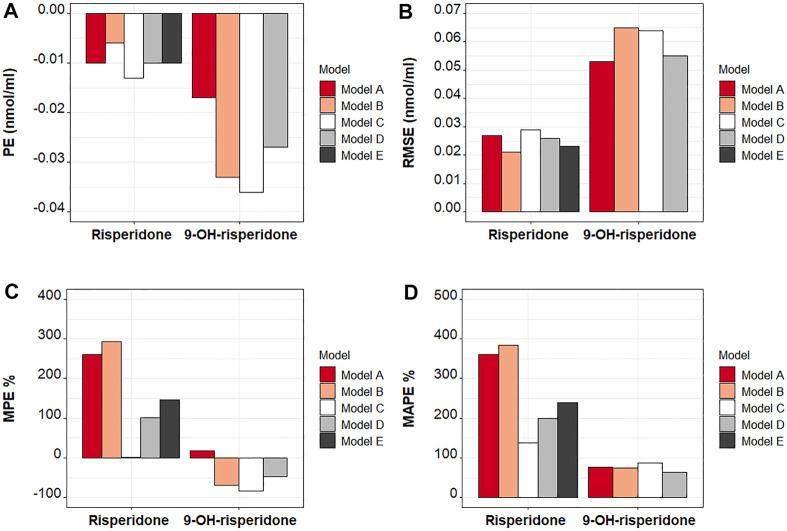
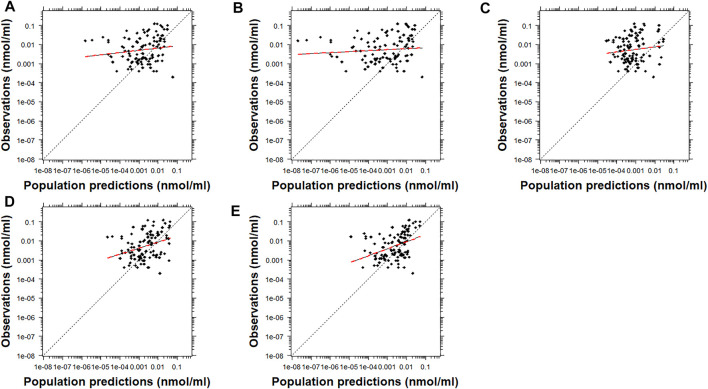
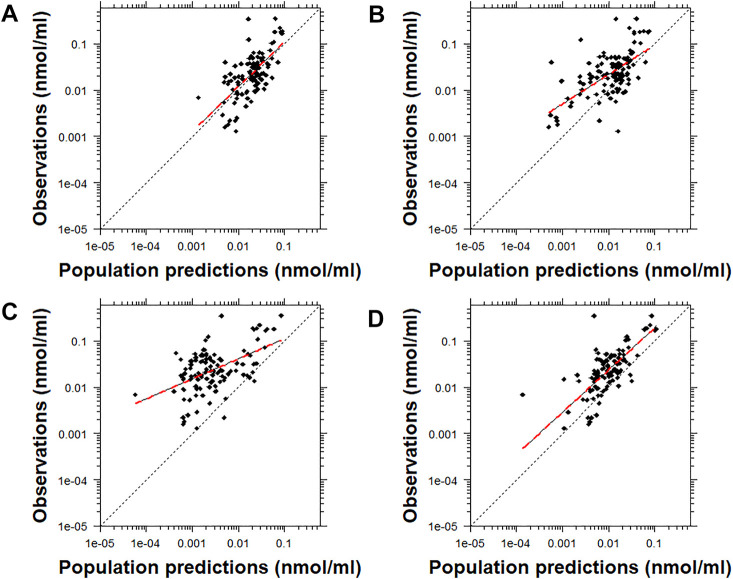
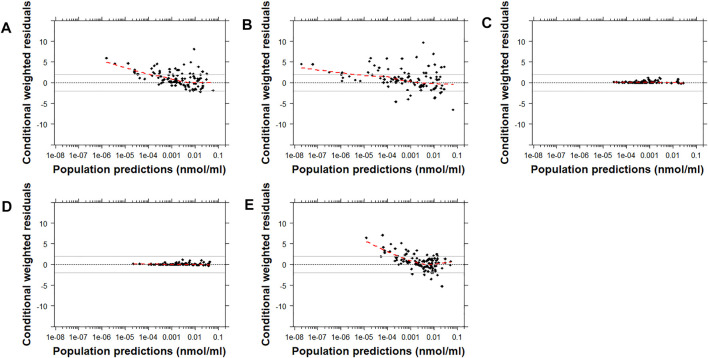
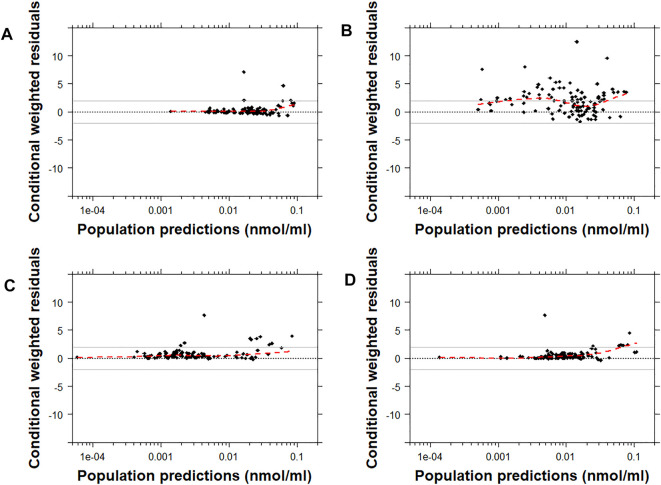
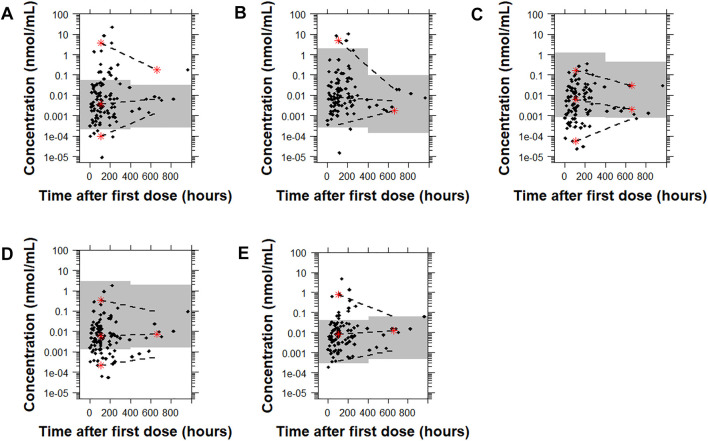
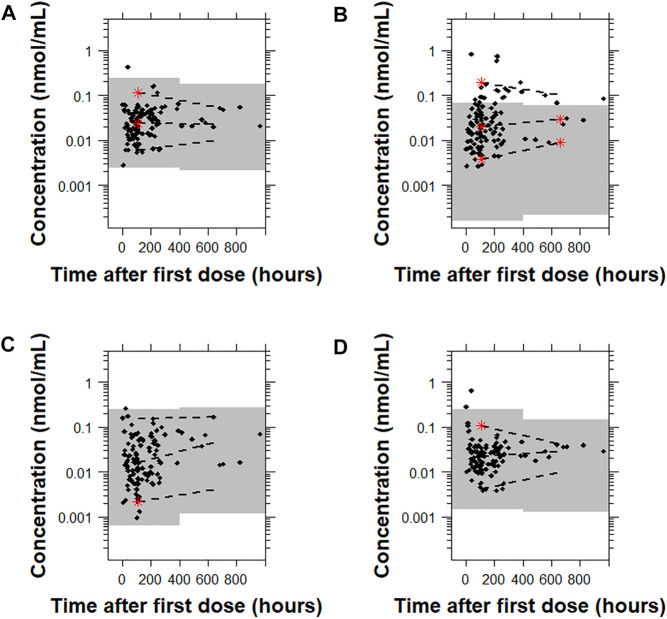
Risperidone is approved to treat schizophrenia in adolescents and autistic disorder and bipolar mania in children and adolescents. It is also used off-label in younger children for various psychiatric disorders. Several population pharmacokinetic models of risperidone and 9-OH-risperidone have been published. The objectives of this study were to assess whether opportunistically collected pediatric data can be used to evaluate risperidone population pharmacokinetic models externally and to identify a robust model for precision dosing in children. A total of 103 concentrations of risperidone and 112 concentrations of 9-OH-risperidone, collected from 62 pediatric patients (0.16-16.8 years of age), were used in the present study. The predictive performance of five published population pharmacokinetic models (four joint parent-metabolite models and one parent only) was assessed for accuracy and precision of the predictions using statistical criteria, goodness of fit plots, prediction-corrected visual predictive checks (pcVPCs), and normalized prediction distribution errors (NPDEs). The tested models produced similarly precise predictions (Root Mean Square Error [RMSE]) ranging from 0.021 to 0.027 nmol/ml for risperidone and 0.053-0.065 nmol/ml for 9-OH-risperidone). However, one of the models (a one-compartment mixture model with clearance estimated for three subpopulations) developed with a rich dataset presented fewer biases (Mean Percent Error [MPE, %] of 1.0% vs. 101.4, 146.9, 260.4, and 292.4%) for risperidone. In contrast, a model developed with fewer data and a more similar population to the one used for the external evaluation presented fewer biases for 9-OH-risperidone (MPE: 17% vs. 69.9, 47.8, and 82.9%). None of the models evaluated seemed to be generalizable to the population used in this analysis. All the models had a modest predictive performance, potentially suggesting that sources of inter-individual variability were not entirely captured and that opportunistic data from a highly heterogeneous population are likely not the most appropriate data to evaluate risperidone models externally.
Keywords: pediatrics; pharmacokinetics; population modeling; precision dosing; risperidone.
Copyright © 2022 Karatza, Ganguly, Hornik, Muller, Al-Uzri, James, Balevic and Gonzalez.
Conflict of interest statement
EK received funding from GlaxoSmithKline (GSK) through a University of North Carolina at Chapel Hill (UNC)/GSK Pharmacokinetics/Pharmacodynamics Post-Doctoral Fellowship. SG is employed by Regeneron Pharmaceuticals, Inc. SJB receives support from the National Institutes of Health (NIH), US Food and Drug Administration, Patient Centered Outcomes Research Institute, the Rheumatology Research Foundation’s Scientist Development Award, the Childhood Arthritis and Rheumatology Research Alliance, and consulting for UCB. DG receives research support from Nabriva Therapeutics through a contract with The University of North Carolina at Chapel Hill. In addition, DG serves as a consultant for Tellus Therapeutics, focusing on neonatal drug development. The remaining authors declare that the research was conducted in the absence of any commercial or financial relationships that could be construed as a potential conflict of interest.
Figures
Similar articles
-
External Evaluation of Population Pharmacokinetic Models of Methotrexate for Model-Informed Precision Dosing in Pediatric Patients with Acute Lymphoid Leukemia.Pharmaceutics. 2023 Feb 8;15(2):569. doi: 10.3390/pharmaceutics15020569. Pharmaceutics. 2023. PMID: 36839891 Free PMC article.
-
Population pharmacokinetics of doxorubicin: establishment of a NONMEM model for adults and children older than 3 years.Cancer Chemother Pharmacol. 2013 Mar;71(3):749-63. doi: 10.1007/s00280-013-2069-1. Epub 2013 Jan 13. Cancer Chemother Pharmacol. 2013. PMID: 23314734
-
Plasma pharmacokinetic characteristics of risperidone and their relationship to saliva concentrations in children with psychiatric or neurodevelopmental disorders.Clin Ther. 2007 Jul;29(7):1476-86. doi: 10.1016/j.clinthera.2007.07.026. Clin Ther. 2007. PMID: 17825699 Free PMC article. Clinical Trial.
-
[Antipsychotics in bipolar disorders].Encephale. 2004 Sep-Oct;30(5):417-24. doi: 10.1016/s0013-7006(04)95456-5. Encephale. 2004. PMID: 15627046 Review. French.
-
Systematic external evaluation of published population pharmacokinetic models of mycophenolate mofetil in adult kidney transplant recipients co-administered with tacrolimus.Br J Clin Pharmacol. 2019 Apr;85(4):746-761. doi: 10.1111/bcp.13850. Epub 2019 Feb 5. Br J Clin Pharmacol. 2019. PMID: 30597603 Free PMC article.
References
-
- Arnold L. E., Gadow K. D., Farmer C. A., Findling R. L., Bukstein O., Molina B. S., et al. (2015). Comorbid Anxiety and Social Avoidance in Treatment of Severe Childhood Aggression: Response to Adding Risperidone to Stimulant and Parent Training; Mediation of Disruptive Symptom Response. J. Child. Adolesc. Psychopharmacol. 25 (3), 203–212. 10.1089/cap.2014.0104 - DOI - PMC - PubMed
-
- Auguie B. (2017). gridExtra: Miscellaneous Functions for “Grid” Graphics. R package version 2.3. https://CRAN.R-project.org/package=gridExtra.
Grants and funding
LinkOut - more resources
Full Text Sources
Medical