. 2022 Mar 18:13:850846.
doi: 10.3389/fimmu.2022.850846. eCollection 2022.

Definition of the Immune Parameters Related to COVID-19 Severity

Affiliations

Definition of the Immune Parameters Related to COVID-19 Severity

Sarah Birindelli et al. Front Immunol. .

Erratum in

Abstract

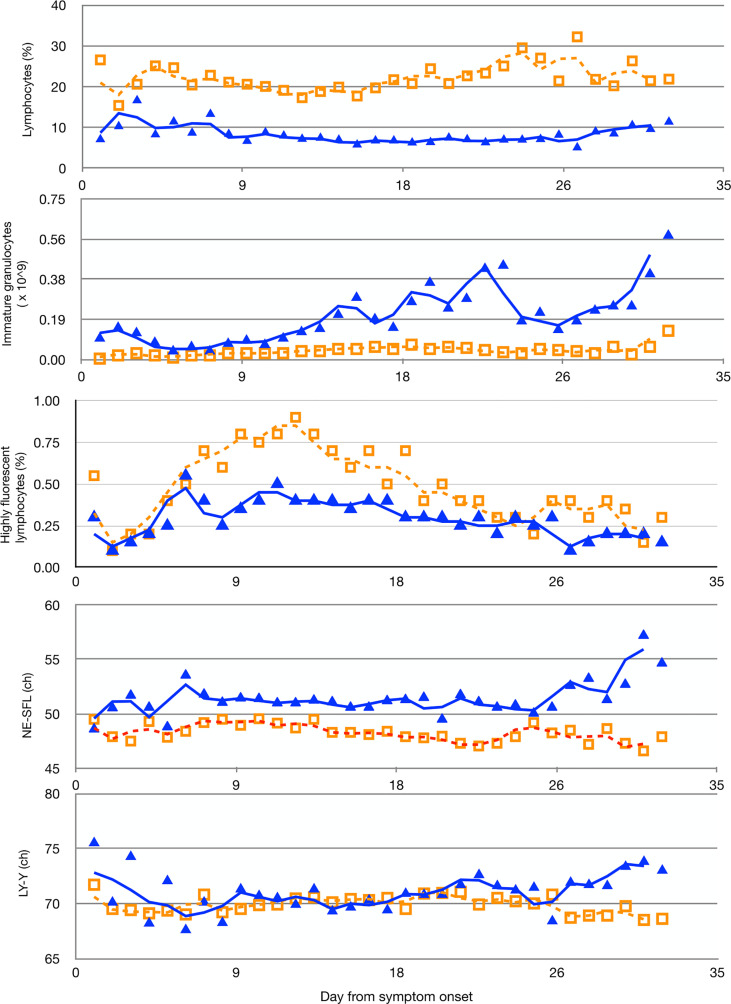
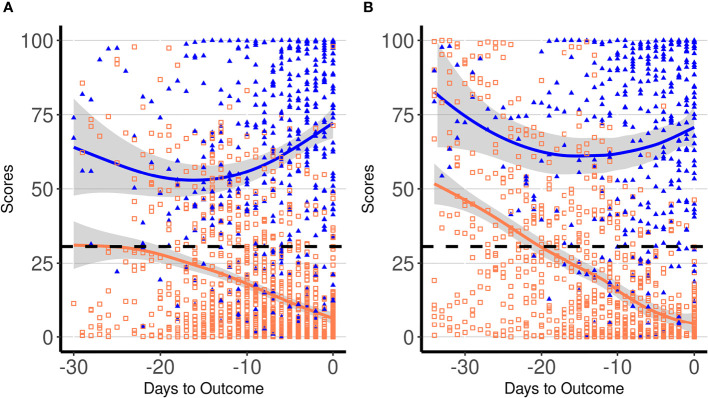
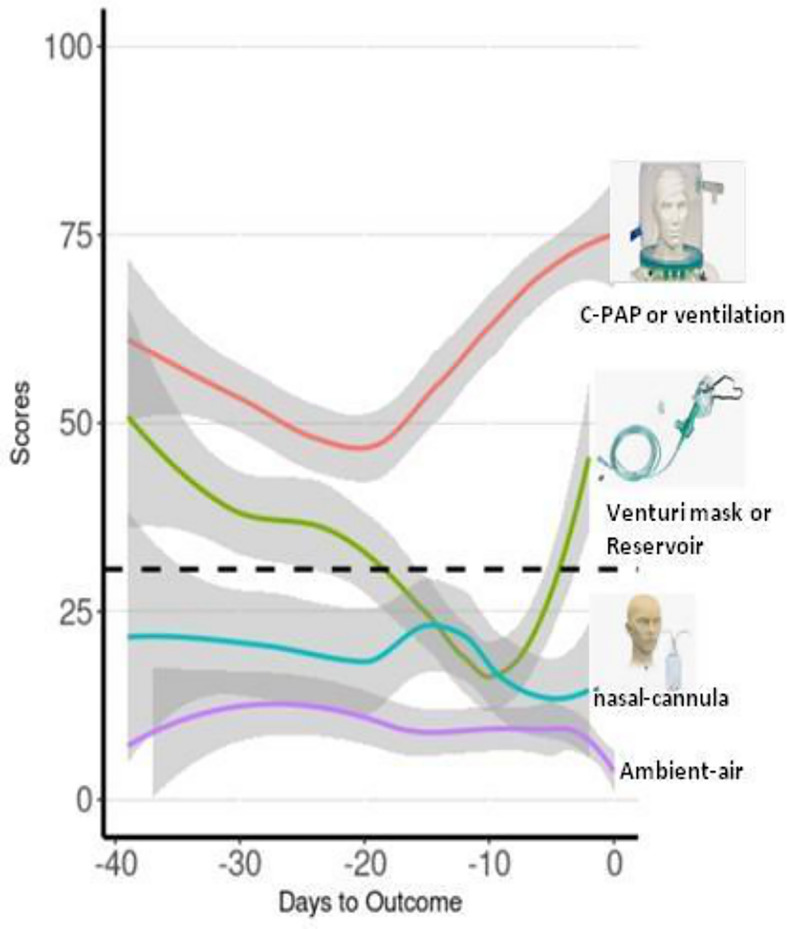
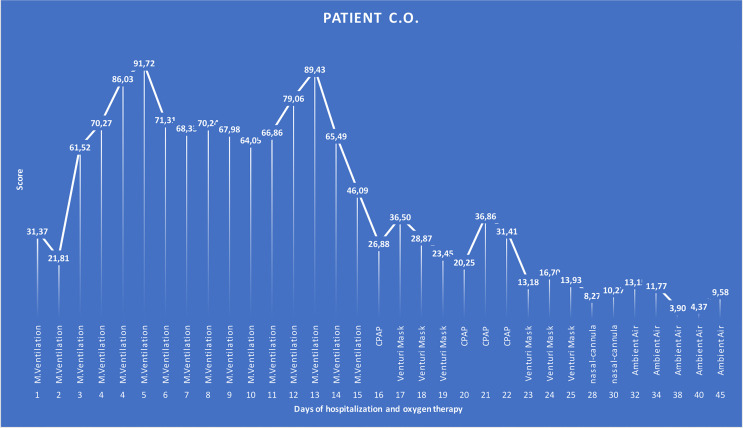
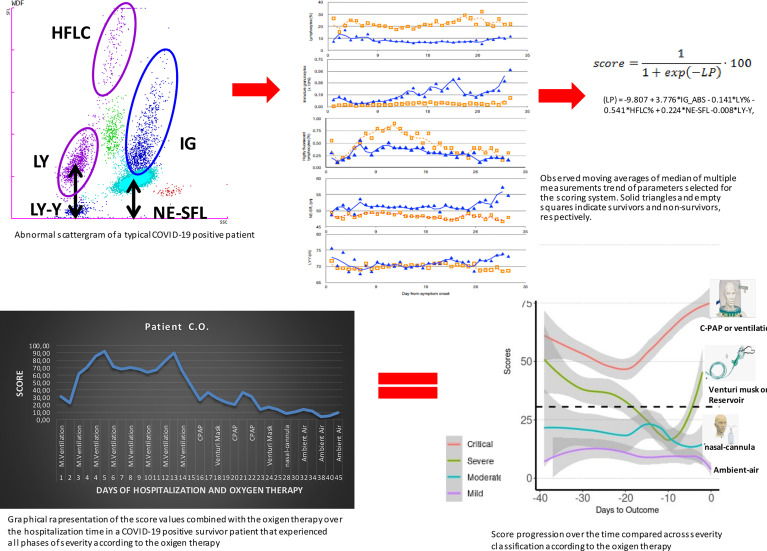
A relevant portion of patients with disease caused by the severe acute respiratory syndrome coronavirus 2 (COVID-19) experience negative outcome, and several laboratory tests have been proposed to predict disease severity. Among others, dramatic changes in peripheral blood cells have been described. We developed and validated a laboratory score solely based on blood cell parameters to predict survival in hospitalized COVID-19 patients. We retrospectively analyzed 1,619 blood cell count from 226 consecutively hospitalized COVID-19 patients to select parameters for inclusion in a laboratory score predicting severity of disease and survival. The score was derived from lymphocyte- and granulocyte-associated parameters and validated on a separate cohort of 140 consecutive COVID-19 patients. Using ROC curve analysis, a best cutoff for score of 30.6 was derived, which was associated to an overall 82.0% sensitivity (95% CI: 78-84) and 82.5% specificity (95% CI: 80-84) for detecting outcome. The scoring trend effectively separated survivor and non-survivor groups, starting 2 weeks before the end of the hospitalization period. Patients' score time points were also classified into mild, moderate, severe, and critical according to the symptomatic oxygen therapy administered. Fluctuations of the score should be recorded to highlight a favorable or unfortunate trend of the disease. The predictive score was found to reflect and anticipate the disease gravity, defined by the type of the oxygen support used, giving a proof of its clinical relevance. It offers a fast and reliable tool for supporting clinical decisions and, most important, triage in terms of not only prioritization but also allocation of limited medical resources, especially in the period when therapies are still symptomatic and many are under development. In fact, a prolonged and progressive increase of the score can suggest impaired chances of survival and/or an urgent need for intensive care unit admission.

Keywords: COVID-19 outcome; blood cell count; clinical management; immunological changes; oxygen therapy; severity score; triage.


Conflict of interest statement

The authors declare that the research was conducted in the absence of any commercial or financial relationships that could be construed as a potential conflict of interest.

Figures

Figure 1
Figure 1
Moving averages of median of multiple measurements of LY%, IG_ABS, HFLC%, the fluorescent light intensity of the neutrophil area on the leukocyte differential (WDF) scattergram (NE-SFL), and the fluorescent light intensity of the lymphocyte area on the WDF scattergram (LY-Y), measured in COVID-19 patients according to days from symptom onset. Solid blue triangles and empty orange squares indicate non-survivors and survivors, respectively. ch, channel-arbitrary units of light scattering.
Figure 2
Figure 2
Dynamic profiles of proposed laboratory score in COVID-19 patients according to days to the outcome in the derivation (A) and in the validation cohort (B). Symbols indicate single patients’ daily score in survivors (empty orange squares) and non-survivors (solid blue triangles), respectively. Blue and orange lines represent trajectories of daily average score values in non-survivors and survivors, respectively, with the 95% confidence intervals displayed by the shaded area. The dashed line indicates the best cutoff for score (30.6).
Figure 3
Figure 3
Moving averages of median of score progression over time across severity groups for the assessment of the score values with the severity of patients based on the OXY therapy. Trend lines represent all the time points score measured in patients of the validation cohort according to the OXY therapy. Red line is for “critical” OXY therapy, which is continuous positive airway pressure (CPAP) or mechanical ventilation; green line is for “severe” OXY therapy, which is Venturi mask or reservoir mask; light blue line is for “moderate” OXY therapy, which is nasal-cannula; and purple line is for absence of OXY therapy, which is “mild”.
Figure 4
Figure 4
Graphical representation of a COVID-19 patient over the time of 45 days of hospitalization that went through different phases of the disease severity according to the OXY therapy. The patient was considered to be in critical condition upon admission to the hospital and, according to this, supported by CPAP OXY therapy for 16 days (17 score time points—1 day had two BCC and then two scores). After clinical improvement, for the next 9 days (9 score time points), the OXY therapy was alternated between CPAP and a lower grade of support, as Venturi mask is. The patient further improved, and accordingly, the type of the OXY therapy changed to the nasal-cannula on day 28 till 5 days before the discharge when the patient did not require any OXY support. Score values are reported as labels. M. ventilation, mechanical ventilation; CPAP, continuous positive airway pressure.
Figure 5
Figure 5
Graphical representation of the entire logical hypothesis of the study starting from the typical abnormal scattergram of a COVID-19-positive patient from which have been selected the 5 predictors of the score. The analysis of data of the five parameters gave the moving averages of median that can clearly show differences between survivors and non-survivors. The accurate statistical analysis provided the final score that has been combined to the severity of patients according to the symptomatic OXY therapy administered. Finally, the combination of all what above described into the graphical representation of a COVID-19 patient over the time of 45 days of hospitalization that went through different phases of the disease severity according to the OXY therapy that show the solid power of the score in representing, preceding, and explaining the course of the disease from the immunological point of view.

References

    1. World Health Organization . Coronavirus Disease (COVID-19) Dashboard. Data as Received by WHO From National Authorities.Available at: WHO Coronavirus (COVID-19) Dashboard | WHO Coronavirus (COVID-19) Dashboard With Vaccination Data (Accessed Accessed: Jan 6, 2022).
    1. Zhu N, Zhang D, Wang W, Li X, Yang B, Song J, et al. . A Novel Coronavirus From Patients With Pneumonia in China, 2019. N Engl J Med (2020) 382:727–33. doi: 10.1056/NEJMoa2001017 - DOI - PMC - PubMed
    1. Guan W-J, Z-y NI, Hu Y, Liang W-h, Ou C-q, He J-x, et al. . Clinical Characteristics of Coronavirus Disease 2019 in China. N Engl J Med (2020) 382:1708–20. doi: 10.1056/NEJMoa2002032 - DOI - PMC - PubMed
    1. Huang C, Wang Y, Li X, Ren L, Zhao J, Hu Y, et al. . Clinical Features of Patients Infected With 2019 Novel Coronavirus in Wuhan, China [Published Correction Appears in Lancet 2020 Jan 30]. Lancet (2020) 395:497–506. doi: 10.1016/S0140-6736(20)30183-5 - DOI - PMC - PubMed
    1. Giacomelli A, Pezzati L, Conti F, Bernacchia D, Siano M, Oreni L, et al. . Self-Reported Olfactory and Taste Disorders in SARS-CoV-2 Patients: A Cross-Sectional Study. Clin Infect Dis (2020) 71:889–90. doi: 10.1093/cid/ciaa330 - DOI - PMC - PubMed

Publication types