. 2022 Mar 16:13:829126.
doi: 10.3389/fimmu.2022.829126. eCollection 2022.

HLA-B*13, B*35 and B*39 Alleles Are Closely Associated With the Lack of Response to ART in HIV Infection: A Cohort Study in a Population of Northern Brazil

Affiliations

HLA-B*13, B*35 and B*39 Alleles Are Closely Associated With the Lack of Response to ART in HIV Infection: A Cohort Study in a Population of Northern Brazil

Leonn Mendes Soares Pereira et al. Front Immunol. .

Abstract

Introduction: Immune reconstitution failure after HIV treatment is a multifactorial phenomenon that may also be associated with a single polymorphism of human leukocyte antigen (HLA); however, few reports include patients from the Brazilian Amazon. Our objective was to evaluate the association of the immunogenic profile of the "classical" HLA-I and HLA-II loci with treatment nonresponse in a regional cohort monitored over 24 months since HIV diagnosis.

Materials and methods: Treatment-free participants from reference centers in the state of Pará, Brazil, were enrolled. Infection screening was performed using enzyme immunoassays (Murex AG/AB Combination DiaSorin, UK) and confirmed by immunoblots (Bio-Manguinhos, FIOCRUZ). Plasma viral load was quantified by real-time PCR (ABBOTT, Chicago, Illinois, USA). CD4+/CD8+ T lymphocyte quantification was performed by immunophenotyping and flow cytometry (BD Biosciences, San Jose, CA, USA). Infection was monitored via test and logistics platforms (SISCEL and SICLOM). Therapeutic response failure was inferred based on CD4+ T lymphocyte quantification after 1 year of therapy. Loci A, B and DRB1 were genotyped using PCR-SSO (One Lambda Inc., Canoga Park, CA, USA). Statistical tests were applied using GENEPOP, GraphPad Prism 8.4.3 and BioEstat 5.3.

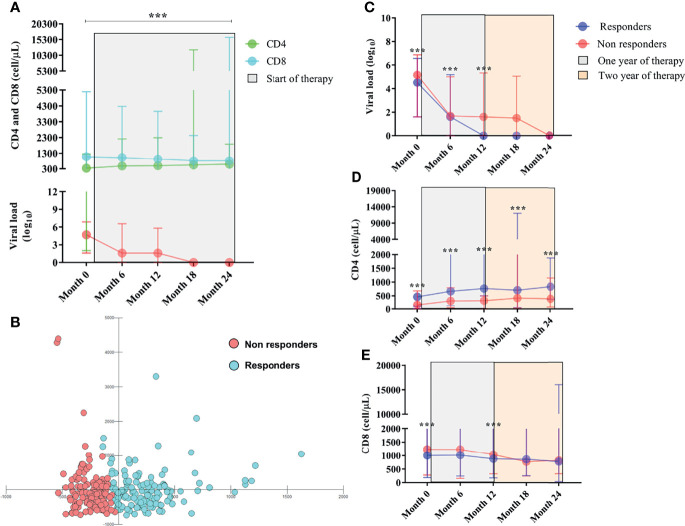
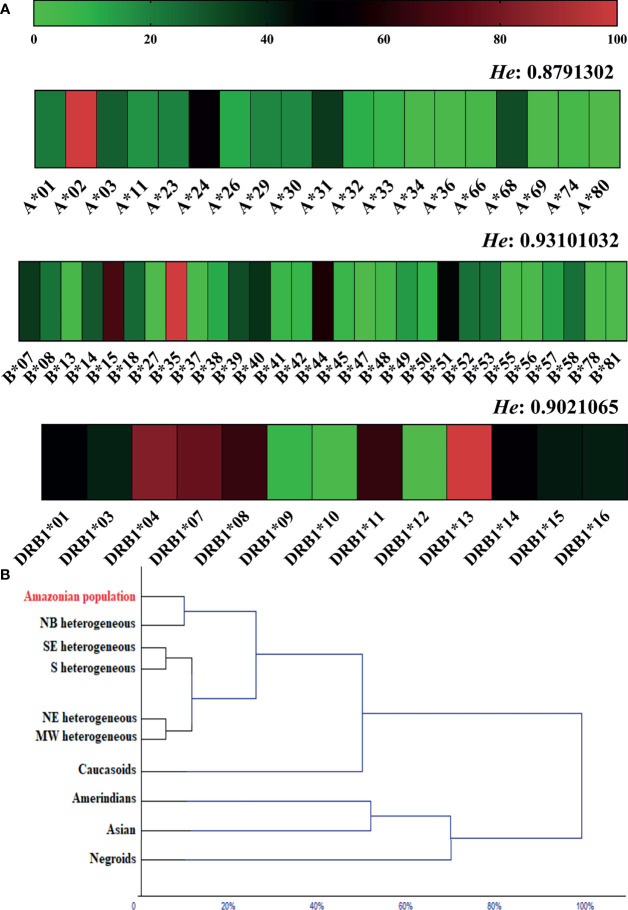
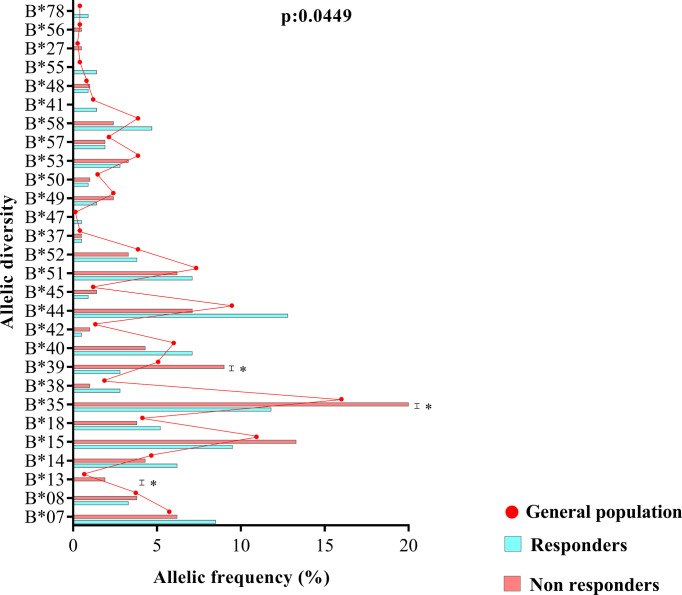
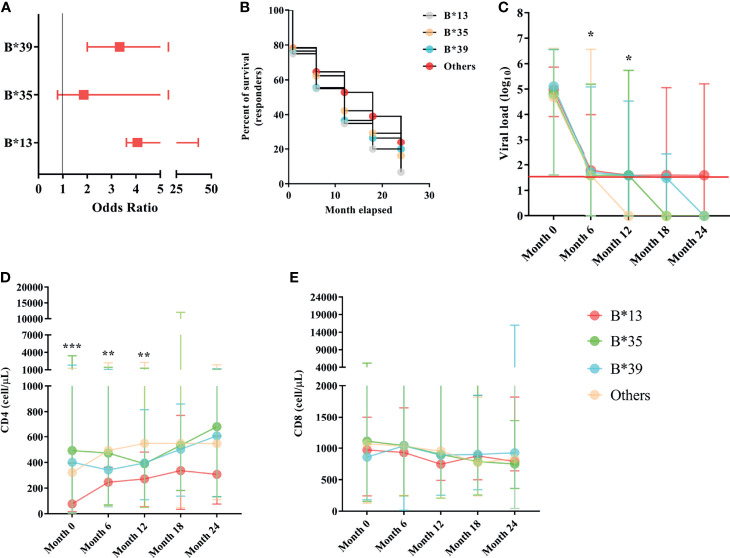
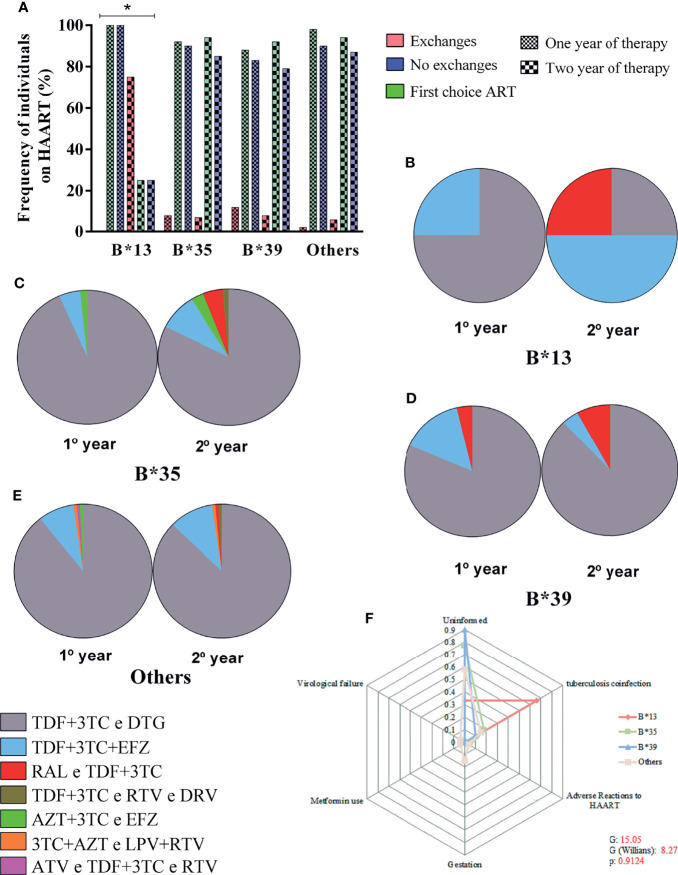
Results: Of the 270 patients monitored, 134 responded to treatment (CD4+ ≥ 500 cells/µL), and 136 did not respond to treatment (CD4+ < 500 cells/µL). The allele frequencies of the loci were similar to heterogeneous populations. The allelic profile of locus B was statistically associated with treatment nonresponse, and the B*13, B*35 and B*39 alleles had the greatest probabilistic influence. The B*13 allele had the highest risk of treatment nonresponse, and carriers of the allele had a detectable viral load and a CD4+ T lymphocyte count less than 400 cells/µL with up to 2 years of therapy. The B*13 allele was associated with a switch in treatment regimens, preferably to efavirenz (EFZ)-based regimens, and among those who switched regimens, half had a history of coinfection with tuberculosis.

Conclusions: The allelic variants of the B locus are more associated with non-response to therapy in people living with HIV (PLHIV) from a heterogeneous population in the Brazilian Amazon.

Keywords: B*13; HIV; HLA; immunogenetics; therapeutic response.


Conflict of interest statement

The authors declare that the research was conducted in the absence of any commercial or financial relationships that could be construed as a potential conflict of interest.

Figures

Figure 1
Figure 1
(A) Longitudinal immunovirological evaluation of PLHIVs before and throughout ART during the two-year treatment period. Viral load is in red. (B) Scatter plot of multivariate discriminant analysis of viral load and CD4+ T and CD8+ T lymphocyte counts showing the groups of therapeutic responders and nonresponders categorized based on CD4+ T lymphocyte count ≥ or < 500 cells/µL. (C) Longitudinal evaluation of viral load. (D) CD4+ T lymphocyte count and (E) CD8+ T lymphocyte count between responders and nonresponders before and after the start of therapy. ***: p < 0.0001.
Figure 2
Figure 2
(A) Heatmap of the allelic frequency and expected heterozygosity (He) of loci A, B and DRB1 in the general population. (B) Dendrogram of the multivariate cluster analysis showing proximity due to allele frequency similarity of the studied population (Amazonian population) with other ethnic groups. NB, Northern Brazil; NE, Northeast Brazil; MW, Brazilian Midwest; SE, Southeast Brazil; S, Southern Brazil.
Figure 3
Figure 3
Allele diversity of the HLA-B locus between treatment responders, treatment nonresponders and the entire study population (general population). The B*13, B*35 and B*39 alleles were more common in nonresponders (p = 0.0449).
Figure 4
Figure 4
(A) Box plot graph showing the odds ratio values for the risk of therapeutic nonresponse associated with the B*13, B*35 and B*39 alleles. The horizontal bars are the statistical confidence interval for each odds ratio. (B) Kaplan–Meier and Mantel-Cox survival curve models for alleles B*13, B*35, B*39 and other alleles related to the proportion of ART responders across 24 months of observation; the proposed curves were significant (x2 = 9.923; p = 0.0192); the B*13 allele occurred in the lowest proportion of responders over the study period (6.67%). (C) Longitudinal evaluation of viral load. The red line represents the detection limit of the kit used. (D) CD4+ T lymphocyte count and (E) CD8+ T lymphocyte count among carriers of alleles B*13, B*35, B*39 and other alleles in the 24-month period; ***: p < 0.0001; **: 0.005 ≥ p < 0.0001; *: 0.05 ≤ p > 0.0001.
Figure 5
Figure 5
(A) Frequency plot of the rate of maintenance of therapeutic regimens among carriers of alleles B*13, B*35, B*39 and other alleles in the 24-month period; the treatment switching rate was associated with allele B*13; *: 0.05 ≤ p > 0.0001. (B–E) Diversity of therapeutic regimens administered in 1- and 2-year periods in carriers of alleles B*13 (B), B*35 (C), B*39 (D) and other alleles (E). (F) Radar chart showing the reasons for switching therapy between carriers of alleles B*13, B*35, B*39 and other alleles; each equiangular spoke represents a reason for switching therapy; approximately 66% of B*13 allele carriers switched treatments due to coinfection with tuberculosis. TDF, tenofovir; 3TC, lamivudine; DTG, dolutegravir; EFZ, efavirenz; RAL, raltegravir; RTV, ritonavir; DRV, darunavir; AZT, zidovudine; LPV, lopinavir.
Figure 6
Figure 6
Heatmap showing the matrix of correlations between the immunovirological and genetic variables. Each square represents the Spearman coefficient of the correlation between two variables. Negative and strong correlations have a coefficient between -1.0 and -0.5; negative and weak correlations have a coefficient between -0.5 and 0; positive and weak correlations have a coefficient between 0 and 0.5; and positive and strong correlations have a coefficient between 0.5 and 1.0.

References

    1. Yang X, Su B, Zhang X, Liu Y, Wu H, Zhang T. Incomplete Immune Reconstitution in HIV/AIDS Patients on Antiretroviral Therapy: Challenges of Immunological Nonresponders. J Leukoc Biol (2020) 107(4):597–612. doi: 10.1002/JLB.4MR1019-189R - DOI - PMC - PubMed
    1. Lewden C, Chene G, Morlat P, Raffi F, Dupon M, Dellamonica P, et al. . HIV-Infected Adults With a CD4 Cell Count Greater Than 500 Cells/Mm3 on Long-Term Combination Antiretroviral Therapy Reach Same Mortality Rates as the General Population. J Acquir Immune Defic Syndr (2007) 46(1):72–7. doi: 10.1097/QAI.0b013e318134257a - DOI - PubMed
    1. Tanaskovic S, Fernandez S, French MA, Price RI, Song S, Robins PD, et al. . Thymic Tissue Is Not Evident on High-Resolution Computed Tomography and [¹⁸F]fluoro-Deoxy-Glucose Positron Emission Tomography Scans of Aviraemic HIV Patients With Poor Recovery of CD4⁺ T Cells. AIDS (2011) 25(9):1235–7. doi: 10.1097/QAD.0b013e3283474155 - DOI - PubMed
    1. Shive CL, Freeman ML, Younes SA, Kowal CM, Canaday DH, Rodriguez B, et al. . Markers of T Cell Exhaustion and Senescence and Their Relationship to Plasma TGF-β Levels in Treated HIV+ Immune Nonresponders. Front Immunol (2021) 12:638010. doi: 10.3389/fimmu.2021.638010 - DOI - PMC - PubMed
    1. Soria A, Guerini FR, Bandera A, Bolognesi E, Uglietti A, Fusco C, et al. . NK-HLA Genotypes in HIV-Infected Patients Lacking Immunological Recovery Despite Effective Antiretroviral Therapy. PloS One (2011) 6(11):e27349. doi: 10.1371/journal.pone.0027349 - DOI - PMC - PubMed