

Deep Learning in Plant Phenological Research: A Systematic Literature Review
- PMID: 35371160
- PMCID: PMC8969581
- DOI: 10.3389/fpls.2022.805738
Deep Learning in Plant Phenological Research: A Systematic Literature Review
Abstract
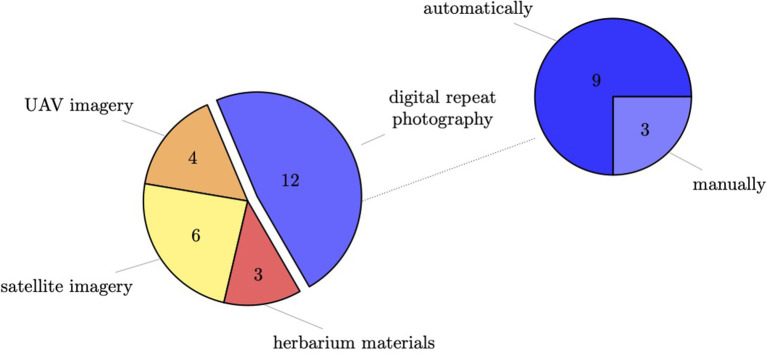
Climate change represents one of the most critical threats to biodiversity with far-reaching consequences for species interactions, the functioning of ecosystems, or the assembly of biotic communities. Plant phenology research has gained increasing attention as the timing of periodic events in plants is strongly affected by seasonal and interannual climate variation. Recent technological development allowed us to gather invaluable data at a variety of spatial and ecological scales. The feasibility of phenological monitoring today and in the future depends heavily on developing tools capable of efficiently analyzing these enormous amounts of data. Deep Neural Networks learn representations from data with impressive accuracy and lead to significant breakthroughs in, e.g., image processing. This article is the first systematic literature review aiming to thoroughly analyze all primary studies on deep learning approaches in plant phenology research. In a multi-stage process, we selected 24 peer-reviewed studies published in the last five years (2016-2021). After carefully analyzing these studies, we describe the applied methods categorized according to the studied phenological stages, vegetation type, spatial scale, data acquisition- and deep learning methods. Furthermore, we identify and discuss research trends and highlight promising future directions. We present a systematic overview of previously applied methods on different tasks that can guide this emerging complex research field.
Keywords: PhenoCams; deep learning; drones; herbarium specimen; machine learning; phenology; phenology monitoring; remote sensing.
Copyright © 2022 Katal, Rzanny, Mäder and Wäldchen.
Conflict of interest statement
The authors declare that the research was conducted in the absence of any commercial or financial relationships that could be construed as a potential conflict of interest.
Figures


References
-
- Berra E. F., Gaulton R. (2021). Remote sensing of temperate and boreal forest phenology: a review of progress, challenges and opportunities in the intercomparison of in-situ and satellite phenological metrics. Forest Ecol. Manag. 480, 118663. 10.1016/j.foreco.2020.118663 - DOI
-
- Brown T. B., Hultine K. R., Steltzer H., Denny E. G., Denslow M. W., Granados J., et al. . (2016). Using PhenoCams to monitor our changing earth: toward a global phenocam network. Front. Ecol. Environ. 14, 84–93. 10.1002/fee.1222 - DOI
Publication types
LinkOut - more resources
Full Text Sources