Different Susceptibilities of Human Melanoma Cell Lines to G2/M Blockage and Cell Death Activation in Response to the Estrogen Receptor β agonist LY500307
- PMID: 35371312
- PMCID: PMC8965114
- DOI: 10.7150/jca.65425
Different Susceptibilities of Human Melanoma Cell Lines to G2/M Blockage and Cell Death Activation in Response to the Estrogen Receptor β agonist LY500307
Abstract
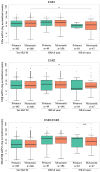
Background: Gender differences in melanoma incidence, metastasis formation and disease progression are increasingly evident in epidemiological studies, with women showing significantly better survival than men. Among factors possibly underlying the disparities, sex hormones seem to play a key role. Nonetheless, functional mechanisms are still unclear, except for the antitumor ability of Estrogen Receptor (ER) β, whose expression determination has often been suggested for melanoma prognosis. In this study, we aimed at evaluating the molecular mechanisms and functional effects associated with ERβ signaling by using its agonist LY500307. Methods: We evaluated the antitumor effect of the specific synthetic ERβ agonist LY500307 on some human melanoma cell lines, selected for different genetic background, expression levels of ERs and tumor progression. The expression of α and β estrogen receptors was investigated taking advantage of The Cancer Genome Atlas database and confirmed on some selected melanoma cell lines. The biological effects of LY500307 were determined in vitro looking at melanoma cell proliferation, cell cycle profiles and migration demonstrating by western blot the involvement of some pathway specific markers. The LY500307-dependent induction of cell death was also analyzed by flow cytometry and western blot analysis of caspase 3 and poly adenosine diphosphate-ribose polymerase (PARP). Results: A significant decrease in the expression of both ERs, even more pronounced for ERα, has been found in patients with metastatic NRAS mutation. Treatment with LY500307 significantly reduced the proliferation of melanoma cells showing a cell cycle arrest at the G2/M boundary phase and promoting apoptosis with different sensitivities associated with disease stage and mutation. Indeed, the ERβ agonist affects melanoma migration, inducing a reversion of the epithelial-mesenchymal transition, more evident in a low aggressive primary melanoma cell line. Conclusion: These results demonstrate the capability of LY500307 to reduce melanoma malignancy, counteracting cell viability and dissemination, overall suggesting a possible future use of LY500307 in personalized combined therapy.
Keywords: Estrogen Receptors; LY500307; apoptosis.; cell cycle; melanoma.
© The author(s).
Conflict of interest statement
Competing Interests: The authors have declared that no competing interest exists.
Figures


Similar articles
-
Pharmacological activation of estrogen receptor beta augments innate immunity to suppress cancer metastasis.Proc Natl Acad Sci U S A. 2018 Apr 17;115(16):E3673-E3681. doi: 10.1073/pnas.1803291115. Epub 2018 Mar 28. Proc Natl Acad Sci U S A. 2018. PMID: 29592953 Free PMC article.
-
Therapeutic Targeting of Ovarian Cancer Stem Cells Using Estrogen Receptor Beta Agonist.Int J Mol Sci. 2022 Jun 28;23(13):7159. doi: 10.3390/ijms23137159. Int J Mol Sci. 2022. PMID: 35806169 Free PMC article.
-
Activity of Estrogen Receptor β Agonists in Therapy-Resistant Estrogen Receptor-Positive Breast Cancer.Front Oncol. 2022 Apr 25;12:857590. doi: 10.3389/fonc.2022.857590. eCollection 2022. Front Oncol. 2022. PMID: 35574319 Free PMC article.
-
Estrogen Receptor β in Melanoma: From Molecular Insights to Potential Clinical Utility.Front Endocrinol (Lausanne). 2016 Oct 26;7:140. doi: 10.3389/fendo.2016.00140. eCollection 2016. Front Endocrinol (Lausanne). 2016. PMID: 27833586 Free PMC article. Review.
-
Estrogens, estrogen receptors and melanoma.Expert Rev Anticancer Ther. 2011 May;11(5):739-47. doi: 10.1586/era.11.42. Expert Rev Anticancer Ther. 2011. PMID: 21554049 Review.
Cited by
-
Estrogen receptor β stimulation as a possible novel therapeutic target for cutaneous T-cell lymphoma.Blood Adv. 2025 Jun 10;9(11):2651-2662. doi: 10.1182/bloodadvances.2024015132. Blood Adv. 2025. PMID: 40020159 Free PMC article.
-
Estrogen Signals through ERβ in Breast Cancer; What We Have Learned since the Discovery of the Receptor.Receptors (Basel). 2024 Jun;3(2):182-200. doi: 10.3390/receptors3020010. Epub 2024 May 3. Receptors (Basel). 2024. PMID: 39175529 Free PMC article.
References
-
- Italian Association of Medical Oncology (AIOM) The Numbers of Cancer in Italy 2020. https://www.aiom.it/i-numeri-del-cancro-in-italia/
-
- Stevanato Filho PR, Aguiar Júnior S, Begnami MD. et al. Estrogen Receptor β as a Prognostic Marker of Tumor Progression in Colorectal Cancer with Familial Adenomatous Polyposis and Sporadic Polyps. Pathol Oncol Res. 2018;24:533–40. - PubMed
-
- de Giorgi V, Mavilia C, Massi D. et al. Estrogen receptor expression in cutaneous melanoma: a real-time reverse transcriptase-polymerase chain reaction and immunohistochemical study. Arch Dermatol. 2009;145:30–6. - PubMed
LinkOut - more resources
Full Text Sources
Research Materials
Miscellaneous

