

Differential Expression of Steroid Hormone Receptors and Ten Eleven Translocation Proteins in Endometrial Cancer Cells
- PMID: 35372016
- PMCID: PMC8966408
- DOI: 10.3389/fonc.2022.763464
Differential Expression of Steroid Hormone Receptors and Ten Eleven Translocation Proteins in Endometrial Cancer Cells
Abstract
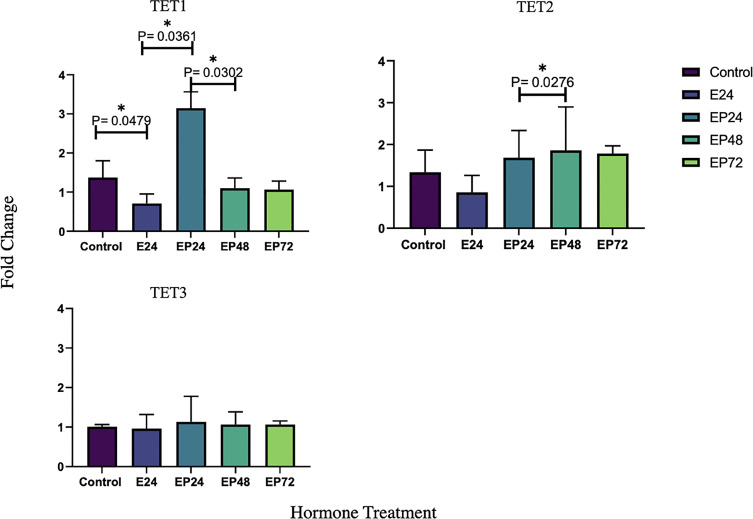
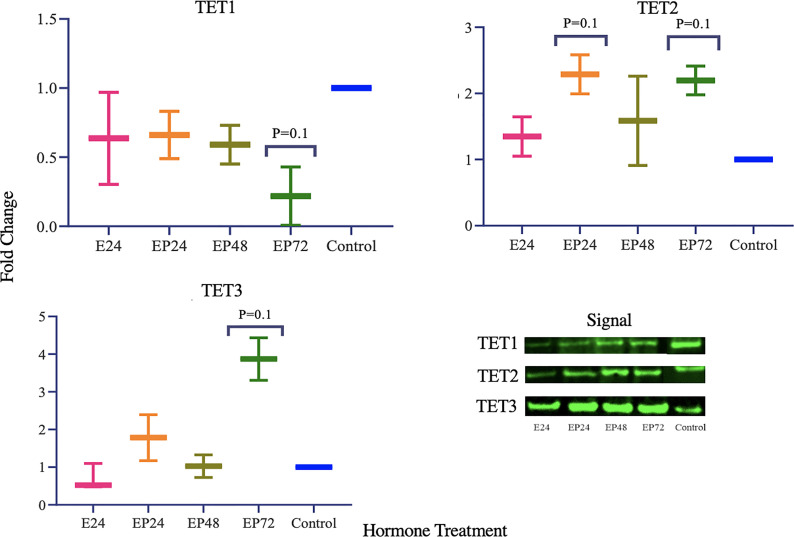
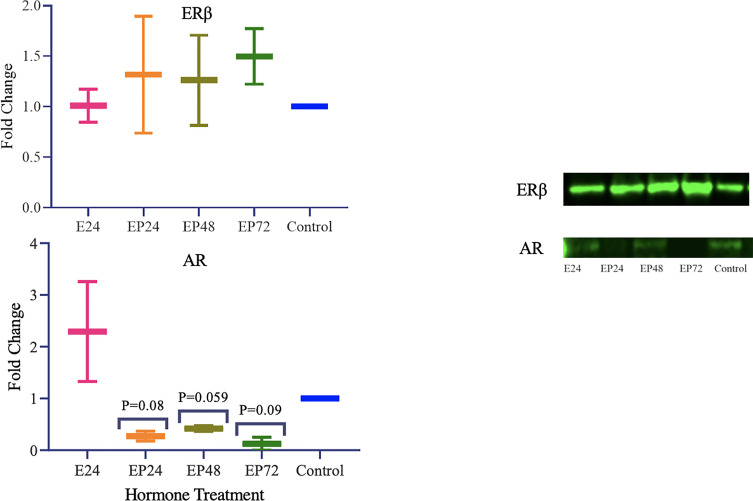
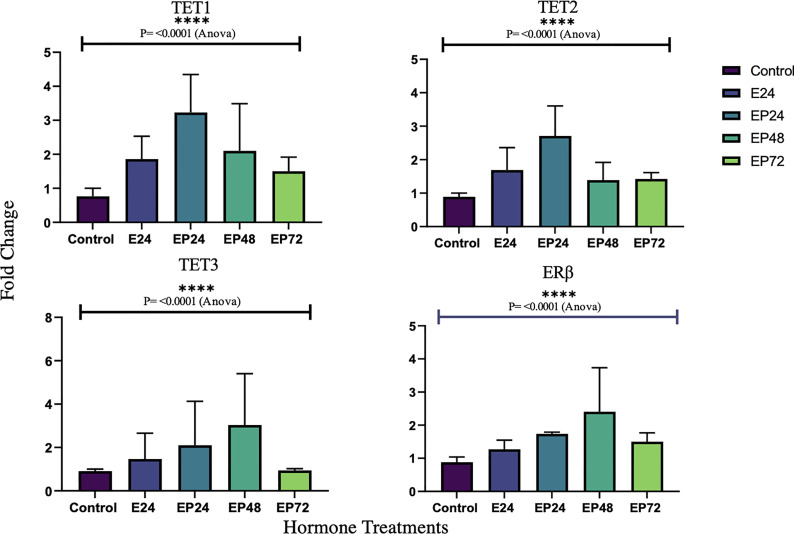
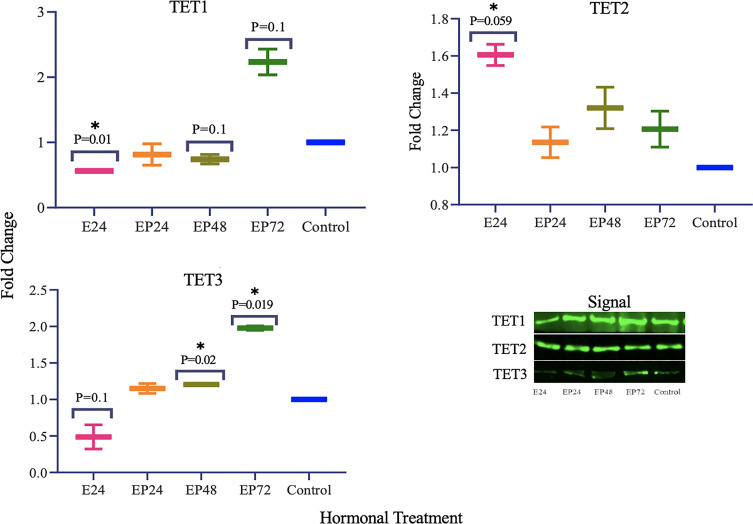
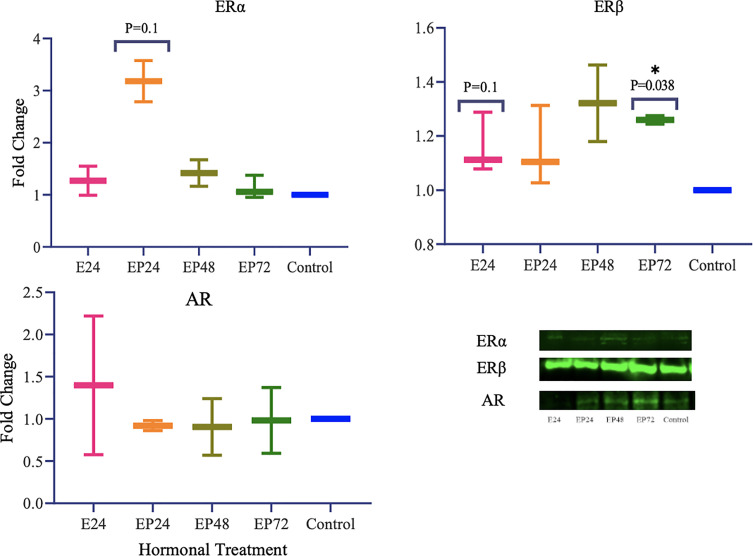
Steroid hormones govern the complex, cyclic changes of the endometrium, predominantly through their receptors. An interplay between steroid hormones and epigenetic mechanisms controls the dynamic endometrial gene regulation. Abnormalities in expression of genes and enzymes associated with steroid hormone signaling, contribute to a disturbed hormonal equilibrium. Limited evidence suggests the involvement of TET (Ten Eleven Translocation)-mediated DNA hydroxymethylation in endometrial cancer, with some data on the use of TET1 as a potential prognostic and diagnostic biomarker, however the mechanisms guiding it and its regulation remains unexplored. This study aims to explore the changes in the expressions of TETs and steroid hormone receptors in response to estrogen and progesterone in endometrial cancer cells. Gene expression was examined using real-time PCR and protein expression was quantified using fluorescent western blotting in endometrial cancer cell lines (AN3 and RL95-2). Results indicate that TET1 and TET3 gene and protein expression was cell-specific in cancer cell-lines. Protein expression of TET1 was downregulated in AN3 cells, while TET1 and TET3 expressions were both upregulated in RL95-2 cells in response to estrogen-progesterone. Further, a decreased AR expression in AN3 cells and an increased ERα and ERβ protein expressions in RL95-2 cells was seen in response to estrogen-progesterone. PR gene and protein expression was absent from both cancer cell-lines. Overall, results imply that expressions of steroid hormones, steroid-hormone receptors and TETs are co-regulated in endometrial cancer-cells. Further studies are needed to interpret how these mechanisms fit in with DNMTs and DNA methylation in regulating endometrial biology. Understanding the role of TETs and hydroxymethylation in steroid hormone receptor regulation is crucial to comprehend how these mechanisms work together in a broader context of epigenetics in the endometrium and its pathologies.
Keywords: DNA hydroxymethylation (5hmC); endometrial cancer cells; gene expression; steroid hormones and receptors; ten eleven translocation (TET proteins).
Copyright © 2022 Mahajan, Gujral, Jain and Ponnampalam.
Conflict of interest statement
The authors declare that the research was conducted in the absence of any commercial or financial relationships that could be construed as a potential conflict of interest.
Figures
Similar articles
-
The interplay of sex steroid hormones and microRNAs in endometrial cancer: current understanding and future directions.Front Endocrinol (Lausanne). 2023 Apr 21;14:1166948. doi: 10.3389/fendo.2023.1166948. eCollection 2023. Front Endocrinol (Lausanne). 2023. PMID: 37152960 Free PMC article. Review.
-
Expression and steroid hormone regulation of TETs and DNMTs in human endometrium.Reproduction. 2020 Aug;160(2):247-257. doi: 10.1530/REP-19-0562. Reproduction. 2020. PMID: 32422604
-
Could DNA hydroxymethylation be crucial in influencing steroid hormone signaling in endometrial biology and endometriosis?Mol Reprod Dev. 2020 Jan;87(1):7-16. doi: 10.1002/mrd.23299. Epub 2019 Nov 20. Mol Reprod Dev. 2020. PMID: 31749216 Review.
-
Genes targeted by the estrogen and progesterone receptors in the human endometrial cell lines HEC1A and RL95-2.Reprod Biol Endocrinol. 2009 Dec 24;7:150. doi: 10.1186/1477-7827-7-150. Reprod Biol Endocrinol. 2009. PMID: 20034404 Free PMC article.
-
Differential expression of ten-eleven translocation genes in endometrial cancers.Tumour Biol. 2017 Mar;39(3):1010428317695017. doi: 10.1177/1010428317695017. Tumour Biol. 2017. PMID: 28349832
Cited by
-
The interplay of sex steroid hormones and microRNAs in endometrial cancer: current understanding and future directions.Front Endocrinol (Lausanne). 2023 Apr 21;14:1166948. doi: 10.3389/fendo.2023.1166948. eCollection 2023. Front Endocrinol (Lausanne). 2023. PMID: 37152960 Free PMC article. Review.
-
Selective Estrogen Receptor Modulators' (SERMs) Influence on TET3 Expression in Breast Cancer Cell Lines with Distinct Biological Subtypes.Int J Mol Sci. 2024 Aug 6;25(16):8561. doi: 10.3390/ijms25168561. Int J Mol Sci. 2024. PMID: 39201247 Free PMC article.
-
The level of active DNA demethylation compounds in leukocytes and urine samples as potential epigenetic biomarkers in breast cancer patients.Sci Rep. 2024 Mar 18;14(1):6481. doi: 10.1038/s41598-024-56326-5. Sci Rep. 2024. PMID: 38499584 Free PMC article.
-
FGFR families: biological functions and therapeutic interventions in tumors.MedComm (2020). 2023 Sep 23;4(5):e367. doi: 10.1002/mco2.367. eCollection 2023 Oct. MedComm (2020). 2023. PMID: 37750089 Free PMC article. Review.
-
Active Estrogen-Succinate Metabolism Promotes Heme Accumulation and Increases the Proliferative and Invasive Potential of Endometrial Cancer Cells.Biomolecules. 2023 Jul 10;13(7):1097. doi: 10.3390/biom13071097. Biomolecules. 2023. PMID: 37509133 Free PMC article.
References
LinkOut - more resources
Full Text Sources
Research Materials