Changes in Gut Microbiota by the Lactobacillus casei Anchoring the K88 Fimbrial Protein Prevented Newborn Piglets From Clinical Diarrhea
- PMID: 35372106
- PMCID: PMC8972131
- DOI: 10.3389/fcimb.2022.842007
Changes in Gut Microbiota by the Lactobacillus casei Anchoring the K88 Fimbrial Protein Prevented Newborn Piglets From Clinical Diarrhea
Abstract
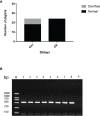
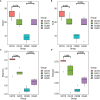
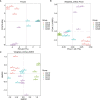
In the last 20 years, accumulating evidence indicates that the gut microbiota contribute to the development, maturation, and regulation of the host immune system and mediate host anti-pathogen defenses. Lactobacillus casei (L.casei) is a normal flora of the gastrointestinal tract in mammals and, as a great mucosal delivery vehicle, has wide use in bioengineering. However, the diarrhea prevention role of commensal intestinal microbiota interfered by the recombinant L.casei (rL.casei) in newborn piglets is not well understood. In our study, newborn piglets orally fed with the rL.casei surface displayed the fimbrial protein K88 of enterotoxigenic Escherichia coli (ETEC) and their feces were collected for a period of time after feeding. The next-generation sequencing of these fecal samples showed that the relative abundance of L.casei was significantly increased. The oral administration of rL.casei altered the intestinal microbial community as evidenced by altered microbial diversity and microbial taxonomic composition. Remarkably, the functional enhancing of the intestinal bacterial community by rL.casei was positively correlated with membrane transport, replication, and repair (p < 0.05). The specific antibody detection indicates that high levels of anti-K88 secretory immunoglobulin A (sIgA) were induced in fecal samples and systemic immunoglobulin G was produced in serum. The diarrhea rate in piglets caused by ETEC K88 was decreased by about 24%. Thus, the oral administration of rL.casei not only activated the mucosal and humoral immune responses in vivo but also contributed to shape the intestinal probiotics in newborn piglets and to significantly reduce the diarrhea rates of newborn piglets.
Keywords: 16S rRNA sequencing; ETEC K88; diarrhea; gut microbiota; newborn piglets; rLactobacillus casei.
Copyright © 2022 Qin, Bai, Li, Huang, Li, Wang, Qu, Wang, Yu and Hou.
Conflict of interest statement
The authors declare that the research was conducted in the absence of any commercial or financial relationships that could be construed as a potential conflict of interest.
Figures



Similar articles
-
Contribution of Lactobacilli on Intestinal Mucosal Barrier and Diseases: Perspectives and Challenges of Lactobacillus casei.Life (Basel). 2022 Nov 16;12(11):1910. doi: 10.3390/life12111910. Life (Basel). 2022. PMID: 36431045 Free PMC article. Review.
-
Dietary fermented soybean meal replacement alleviates diarrhea in weaned piglets challenged with enterotoxigenic Escherichia coli K88 by modulating inflammatory cytokine levels and cecal microbiota composition.BMC Vet Res. 2020 Jul 14;16(1):245. doi: 10.1186/s12917-020-02466-5. BMC Vet Res. 2020. PMID: 32664940 Free PMC article.
-
Effect of Lactobacillus plantarum on diarrhea and intestinal barrier function of young piglets challenged with enterotoxigenic Escherichia coli K88.J Anim Sci. 2014 Apr;92(4):1496-503. doi: 10.2527/jas.2013-6619. Epub 2014 Feb 3. J Anim Sci. 2014. PMID: 24492550 Clinical Trial.
-
Lactobacillus casei Zhang Prevents Jejunal Epithelial Damage to Early-Weaned Piglets Induced by Escherichia coli K88 via Regulation of Intestinal Mucosal Integrity, Tight Junction Proteins and Immune Factor Expression.J Microbiol Biotechnol. 2019 Jun 28;29(6):863-876. doi: 10.4014/jmb.1903.03054. J Microbiol Biotechnol. 2019. PMID: 31091863
-
Intestinal receptors for adhesive fimbriae of enterotoxigenic Escherichia coli (ETEC) K88 in swine--a review.Appl Microbiol Biotechnol. 2000 Sep;54(3):311-8. doi: 10.1007/s002530000404. Appl Microbiol Biotechnol. 2000. PMID: 11030565 Review.
Cited by
-
Lactobacillus salivarius WZ1 Inhibits the Inflammatory Injury of Mouse Jejunum Caused by Enterotoxigenic Escherichia coli K88 by Regulating the TLR4/NF-κB/MyD88 Inflammatory Pathway and Gut Microbiota.Microorganisms. 2023 Mar 3;11(3):657. doi: 10.3390/microorganisms11030657. Microorganisms. 2023. PMID: 36985229 Free PMC article.
-
Swine enteric colibacillosis: Current treatment avenues and future directions.Front Vet Sci. 2022 Oct 28;9:981207. doi: 10.3389/fvets.2022.981207. eCollection 2022. Front Vet Sci. 2022. PMID: 36387374 Free PMC article. Review.
-
Berberine alleviates ETEC-induced intestinal inflammation and oxidative stress damage by optimizing intestinal microbial composition in a weaned piglet model.Front Immunol. 2024 Sep 16;15:1460127. doi: 10.3389/fimmu.2024.1460127. eCollection 2024. Front Immunol. 2024. PMID: 39351242 Free PMC article.
-
Dietary Supplementation with Probiotic Bacillus licheniformis S6 Improves Intestinal Integrity via Modulating Intestinal Barrier Function and Microbial Diversity in Weaned Piglets.Biology (Basel). 2023 Feb 2;12(2):238. doi: 10.3390/biology12020238. Biology (Basel). 2023. PMID: 36829515 Free PMC article.
-
Contribution of Lactobacilli on Intestinal Mucosal Barrier and Diseases: Perspectives and Challenges of Lactobacillus casei.Life (Basel). 2022 Nov 16;12(11):1910. doi: 10.3390/life12111910. Life (Basel). 2022. PMID: 36431045 Free PMC article. Review.
References
-
- Breiman L. (2001). Random Forests. Mach. Learn 45, 5–32. doi: 10.1023/A:1010933404324 - DOI
Publication types
MeSH terms
LinkOut - more resources
Full Text Sources
Medical

