Review
. 2022 Mar 15:10:856591.
doi: 10.3389/fbioe.2022.856591. eCollection 2022.

Raman Spectroscopy: A Novel Technology for Gastric Cancer Diagnosis

Affiliations
Review

Raman Spectroscopy: A Novel Technology for Gastric Cancer Diagnosis

Kunxiang Liu et al. Front Bioeng Biotechnol. .

Abstract

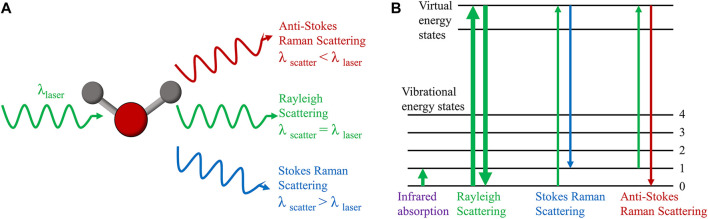
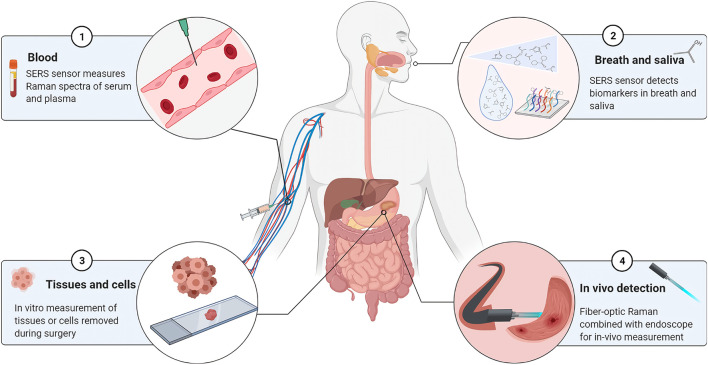
Gastric cancer is usually diagnosed at late stage and has a high mortality rate, whereas early detection of gastric cancer could bring a better prognosis. Conventional gastric cancer diagnostic methods suffer from long diagnostic times, severe trauma, and a high rate of misdiagnosis and rely heavily on doctors' subjective experience. Raman spectroscopy is a label-free molecular vibrational spectroscopy technique that identifies the molecular fingerprint of various samples based on the inelastic scattering of monochromatic light. Because of its advantages of non-destructive, rapid, and accurate detection, Raman spectroscopy has been widely studied for benign and malignant tumor differentiation, tumor subtype classification, and section pathology diagnosis. This paper reviews the applications of Raman spectroscopy for the in vivo and in vitro diagnosis of gastric cancer, methodology related to the spectroscopy data analysis, and presents the limitations of the technique.

Keywords: Raman spectroscopy; clinical diagnostics; gastric cancer; machine learning; on-site applications.


Conflict of interest statement

The authors declare that the research was conducted in the absence of any commercial or financial relationships that could be construed as a potential conflict of interest.

Figures

FIGURE 1
FIGURE 1
Principle of Raman scattering. (A) Raman scattering and Rayleigh scattering. (B) Energy level diagram of Raman scattering, Rayleigh scattering and infrared absorption.
FIGURE 2
FIGURE 2
Sample types for Raman spectroscopy in gastric cancer diagnostic studies. ① Blood samples. Diagnostic analysis of serum, serum protein, serum RNA, or plasma by SERS sensor. ② Breath and saliva. SERS coupled with mass spectrometry to detect biomarkers in the sample. ③ Tissue or cell. Detection of isolated tissue samples by spontaneous Raman or confocal Raman spectroscopy. ④ In vivo detection. Raman in vivo measurements using fiber optic Raman in combination with endoscopy.
FIGURE 3
FIGURE 3
Micrographs of gastric cancer cells with Raman spectra. (A) Images of gastric carcinoma cells observed by differential interference contrast (DIC) microscope with the ×100 objective lens. (B) Raman spectra of untreated gastric carcinoma cells (curve a) and apoptotic cells (curve b). Curve c was the difference spectrum between a and b. The position of Raman bands at 782, 934, 1,001, 1,092, 1,156, 1,298, 1,340, 1,446, 1,523, 1,576, 1,615, and 1,655 cm−1 were marked. Reproduced from permission (Yao et al., 2009). Copyright (2009), with permission from Elsevier.
FIGURE 4
FIGURE 4
The contrast of SERS spectrum of gastric cancer and normal with Au/SiNWA substrate. Reproduced from permission (Wei et al., 2016). Copyright (2016), with permission from Elsevier.
FIGURE 5
FIGURE 5
In vivo mean Raman spectra ±1 standard deviations (SD) of normal (n = 934), and cancer (n = 129) gastric tissue, as well as the corresponding white-light reflectance (WLR) image and narrow-band image (NBI) acquired during clinical gastroscopic examination. Reproduced from permission (Huang et al., 2010b). Copyright (2010), with permission from Elsevier.

Similar articles

Cited by

References

    1. Acquarelli J., van Laarhoven T., Gerretzen J., Tran T. N., Buydens L. M. C., Marchiori E. (2017). Convolutional Neural Networks for Vibrational Spectroscopic Data Analysis. Analytica Chim. Acta 954, 22–31. 10.1016/j.aca.2016.12.010 - DOI - PubMed
    1. Allegrini F., Olivieri A. C. (2013). An Integrated Approach to the Simultaneous Selection of Variables, Mathematical Pre-processing and Calibration Samples in Partial Least-Squares Multivariate Calibration. Talanta 115 (17), 755–760. 10.1016/j.talanta.2013.06.051 - DOI - PubMed
    1. Amal L., Ding L., Liu B. B., Tisch U., Xu Z. Q., Shi D. Y., et al. (2012). The Scent Fingerprint of Hepatocarcinoma: In-Vitro Metastasis Prediction with Volatile Organic Compounds (VOCs). Int. J. Nanomedicine 7, 4135–4146. 10.2147/IJN.S32680 - DOI - PMC - PubMed
    1. Atkins C. G., Buckley K., Blades M. W., Turner R. F. B. (2017). Raman Spectroscopy of Blood and Blood Components. Appl. Spectrosc. 71 (5), 767–793. 10.1177/0003702816686593 - DOI - PubMed
    1. Auner G. W., Koya S. K., Huang C., Broadbent B., Trexler M., Auner Z., et al. (2018). Applications of Raman Spectroscopy in Cancer Diagnosis. Cancer Metastasis Rev. 37 (4), 691–717. 10.1007/s10555-018-9770-9 - DOI - PMC - PubMed

LinkOut - more resources