. 2022 Mar 10:9:814219.
doi: 10.3389/fmed.2022.814219. eCollection 2022.

Accessory and Expiratory Muscles Activation During Spontaneous Breathing Trial: A Physiological Study by Surface Electromyography

Affiliations

Accessory and Expiratory Muscles Activation During Spontaneous Breathing Trial: A Physiological Study by Surface Electromyography

Matteo Pozzi et al. Front Med (Lausanne). .

Abstract

Background: The physiological and prognostical significance of accessory and expiratory muscles activation is unknown during a spontaneous breathing trial (SBT). We hypothesized that, in patients experiencing weaning failure, accessory and expiratory muscles are activated to cope with an increased respiratory workload.

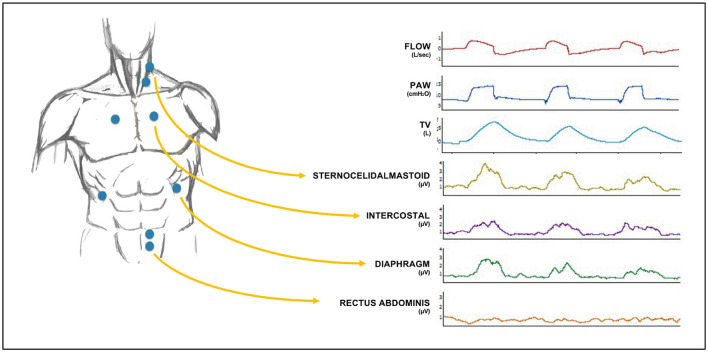
Purpose: To describe accessory and expiratory muscle activation non-invasively by surface electromyography (sEMG) during an SBT and to assess differences in electrical activity (EA) of the inspiratory and expiratory muscles in successful vs. failing weaning patients.

Methods: Intubated patients on mechanical ventilation for more than 48 h undergoing an SBT were enrolled in a medical and surgical third-level ICU of the University Teaching Hospital. Baseline characteristics and physiological variables were recorded in a crossover physiologic prospective clinical study.

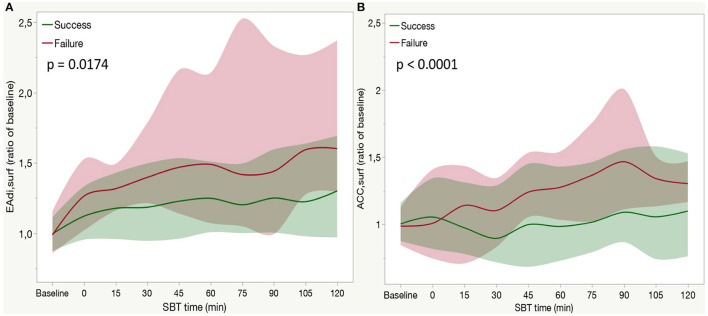
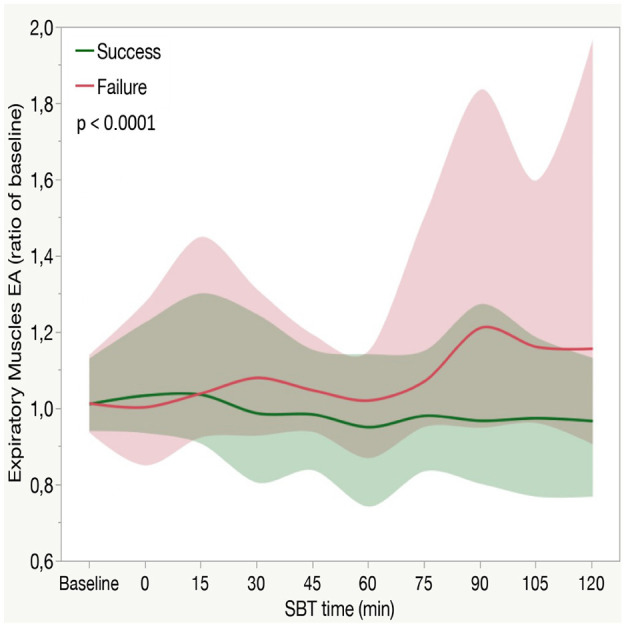
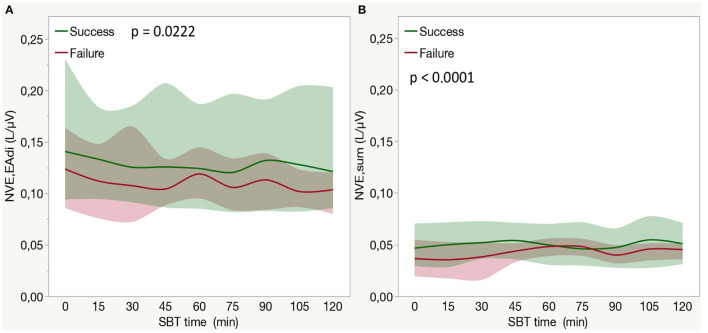
Results: Of 37 critically ill mechanically ventilated patients, 29 (78%) patients successfully passed the SBT. Rapid shallow breathing index (RSBI) was higher in patients who failed SBT compared with the successfully weaned patients at baseline and over time (group-by-time interaction p < 0.001). EA of both the diaphragm (EAdisurf) and of accessory muscles (ACCsurf) was higher in failure patients compared with success (group-by-time interaction p = 0.0174 and p < 0.001, respectively). EA of expiratory muscles (ESPsurf) during SBT increased more in failure than in weaned patients (group-by-time interaction p < 0.0001).

Conclusion: Non-invasive respiratory muscle monitoring by sEMG was feasible during SBT. Respiratory muscles EA increased during SBT, regardless of SBT outcome, and patients who failed the SBT had a higher increase of all the inspiratory muscles EA compared with the patients who passed the SBT. Recruitment of expiratory muscles-as quantified by sEMG-is associated with SBT failure.

Keywords: electrical activity; expiratory muscles; inspiratory muscles; non-invasive surface electromyography; spontaneous breathing trial (SBT); weaning.


Conflict of interest statement

GB was employed by Draeger Medical Italy, Draeger Medical Germany, and Pfizer. The remaining authors declare that the research was conducted in the absence of any commercial or financial relationships that could be construed as a potential conflict of interest.

Figures

Figure 1
Figure 1
Electrode positioning on the chest wall (left) and general setup of the channel recordings (right) along with sample ventilatory waveforms and surface electromyography (sEMG) traces. The four pairs of electrodes were positioned (1) on the lower coastal margin, bilaterally on the midclavicular line, for diaphragm electrical activity (EAdisurf), (2) on the second intercostal space, bilaterally on the parasternal line, for parasternal external intercostal muscles EA, (3) on the middle third of the sternocleidomastoid muscle, for sternocleidomastoid EA and (4) on the left midclavicular line, at the level of the umbilicus, for rectus abdominis muscles EA. PAW, Airway Pressure; TV, Tidal Volume.
Figure 2
Figure 2
Time course of the diaphragm electrical activity [EADIsurf (A)] accessory muscle electrical activity [ACCsurf, (B)] during a spontaneous breathing trial (SBT) in weaning failure (red line) or success (green line) patients. Each line indicates the median value at each time point with bands indicating interquartile range (IQR). A P-value refers to the between-group comparison performed with the use of the two-factor analysis of variance to test time (from baseline to 120 min of SBT) and group effects (SBT failure or success). In a post-hoc analysis median EAdisurf at each time point was higher than baseline (p < 0.05) both in the failure and success group. In a post-hoc analysis median ACCsurf was higher than baseline in the success group at 75 (p = 0.0093), 90 (p < 0.0001), 105 (p < 0.0001), and 120 min (p < 0.0001) and at 75 (p = 0.0003), 90 (p < 0.0001), and 105 min (p < 0.0035) in the failure group.
Figure 3
Figure 3
Expiratory muscles electrical activity (EXPsurf) in patients who fail or succeed weaning attempt along with aSBT. Each line indicates the median value with bands indicating IQR. The P-value expressed in the figure is for the between-group comparison performed with the use of the two-factor analysis of variance to test time (from baseline to 120 min of SBT) and group effects (SBT failure or success). In a posthoc analysis median EXPsurf at each time point (from 0 to 120 min) was not different than baseline (p > 0.05) in the success group, while it was higher than baseline in the failure group from 75 to 120 min (p < 0.0001). At each time point, EXPsurf was higher in the failure group compared with the success group from 75 to 120 min (p < 0.0001).
Figure 4
Figure 4
(A) Neuroventilatory efficiency for diaphragm surface electrical activity (NVEEAdi) in patients who fail or success weaning attempts among the entire duration of a SBT. Each line indicates the median value with bands indicating IQR. The P-value is for the between-group comparison performed with the use of the two-factor analysis of variance to test time (from 0 to 120 min of SBT with the exclusion of baseline step) and group effects (SBT failure or success). In a post-hoc analysis median NVEEAdi at each time point (from 0 to 120 min) was not different from baseline (p > 0.05) both in the success and failure group. (B) Neuroventilatory efficiency for sum of inspiratory muscles surface electrical activity (NVEsum) in patients who fail or succeed weaning attempt during the entire duration of a SBT. Each bar indicates the median value with bands indicating IQR. The P-value is for the between-group comparison performed with the use of the two-factor analysis of variance to test time (from 0 to 120 min of SBT with the exclusion of baseline step) and group effects (SBT failure or success). In a post-hoc analysis comparing median NVEsum at each time point with the beginning of SBT (0 min) NVEsum was higher at 30 min (p < 0.0001), 45 min (p < 0.0001), and 105 min (p = 0.0006) in the success group, while it was higher at 60 min (p = 0.005) but lower at 90 min (p < 0.0001). NVEEAdi, neuroventilatory efficiency for diaphragm surface electrical activity; NVEsum, neuroventilatory efficiency for sum of inspiratory muscles surface electrical activity; SBT, spontaneous breathing trial.
Figure 5
Figure 5
For two representative patients (A,B on the left) the diaphragm Electrical Activity (EAdisurf), accessory muscles Electrical Activity (ACCsurf), Neuroventilatory Efficiency of the diaphragm (NVEEAdi), and of the whole inspiratory muscles (NVEsum) is shown during SBT. Lines indicated median values with bands indicating IQR. On the right side, a little time frame is sampled and Eadisurf, NVEEadi, ACCsurf, and NVEsum are added stepwise (from frames 1 to 3) to illustrate the different behavior of this variable, in particular of NVEEAdi and NVEsum. (A). In this representative patient who fails SBT, a progressive increase in NVEEAdi (red line) together with a stable EAdisurf (blue line) is observed at the beginning of the trial (Panel 1). This can be interpreted with a prognostically good improvement of the diaphragm mechanical properties since it can produce more mL of tidal volume (TV) for each microV of EA. But if we look at panel 2, we see as accessory muscles EA increases (green line). The accessory muscles hiddenly ≪help≫ the diaphragm and this results in a larger TV. If we compute NVE taking into account all inspiratory muscles, it remains stable (panel 3). This is a case in which an apparent improvement in the neuromechanical properties of the diaphragm is falsely observed in presence of accessory muscles recruitment when it is calculated with the only diaphragm EA. (B) In this representative patient who success SBT, a steep increase in diaphragm EA (EAdisurf, blue line) is observed at the end of the CPAP trial (panel 1), together with a reduction in NVEEAdi (red line). This circumstance can be interpreted as a worsening in the diaphragmatic performance at the end of SBT, eventually because of the muscle fatigue and exhaustion, leading to a reduction in force (and tidal) generating capacity of the diaphragm. If we take into account accessory muscles, we can see as their EA increases parallel to the diaphragm (green line, panel 2). So, if NVE is calculated taking into account all inspiratory muscles (NVEsum, purple line) it decreases in the same way as that calculated only for the diaphragm (panel 3). In this case, EA and mechanical properties of the diaphragm and accessory muscles vary in the same manner, and diaphragm monitoring can be representative of the whole respiratory muscles. EAdisurf, diaphragm surface electrical activity; ACCsurf, accessory muscles surface electrical activity; NVEEAdi, neuroventilatory efficiency for EAdisurf; NVEsum, neuroventilatory efficiency for ACCsurf.

References

    1. Béduneau G, Pham T, Schortgen F, Piquilloud L, Zogheib E, Jonas M, et al. . Epidemiology of weaning outcome according to a new definition. The WIND Study Am J Respir Crit Care Med. (2017) 195:772–83. 10.1164/rccm.201602-0320OC - DOI - PubMed
    1. Goligher EC, Dres M, Fan E, Rubenfeld GD, Scales DC, Herridge MS, et al. . Mechanical ventilation-induced diaphragm atrophy strongly impacts clinical outcomes. Am J Respir Crit Care Med. (2018) 197:204–13. 10.1164/rccm.201703-0536OC - DOI - PubMed
    1. Schepens T, Fard S, Goligher EC. Assessing diaphragmatic function. Respir Care. (2020) 65:807–19. 10.4187/respcare.07410 - DOI - PubMed
    1. Butler JE. Drive to the human respiratory muscles. Respir Physiol Neurobiol. (2007) 159:115–26. 10.1016/j.resp.2007.06.006 - DOI - PubMed
    1. Doorduin J, Roesthuis LH, Jansen D, van der Hoeven JG, van Hees HWH, Heunks LMA. Respiratory muscle effort during expiration in successful and failed weaning from mechanical ventilation. Anesthesiology. (2018) 129:490–501. 10.1097/ALN.0000000000002256 - DOI - PubMed