. 2022 Mar 17:9:819018.
doi: 10.3389/fsurg.2022.819018. eCollection 2022.

The Prognostic Significance and Gene Expression Characteristics of Gastric Signet-Ring Cell Carcinoma: A Study Based on the SEER and TCGA Databases

Affiliations

The Prognostic Significance and Gene Expression Characteristics of Gastric Signet-Ring Cell Carcinoma: A Study Based on the SEER and TCGA Databases

Junren Ma et al. Front Surg. .

Abstract

Purpose: This study is based on the Surveillance, Epidemiology, and End Results (SEER) program to explore the prognostic differences between signet-ring cell carcinoma (SRC) and intestinal-type gastric carcinoma (ITGC). This study is also based on gene sequencing data from The Cancer Genome Atlas (TCGA) to identify unique genetic contributions to the prognostic differences between the two subtypes of gastric cancer.

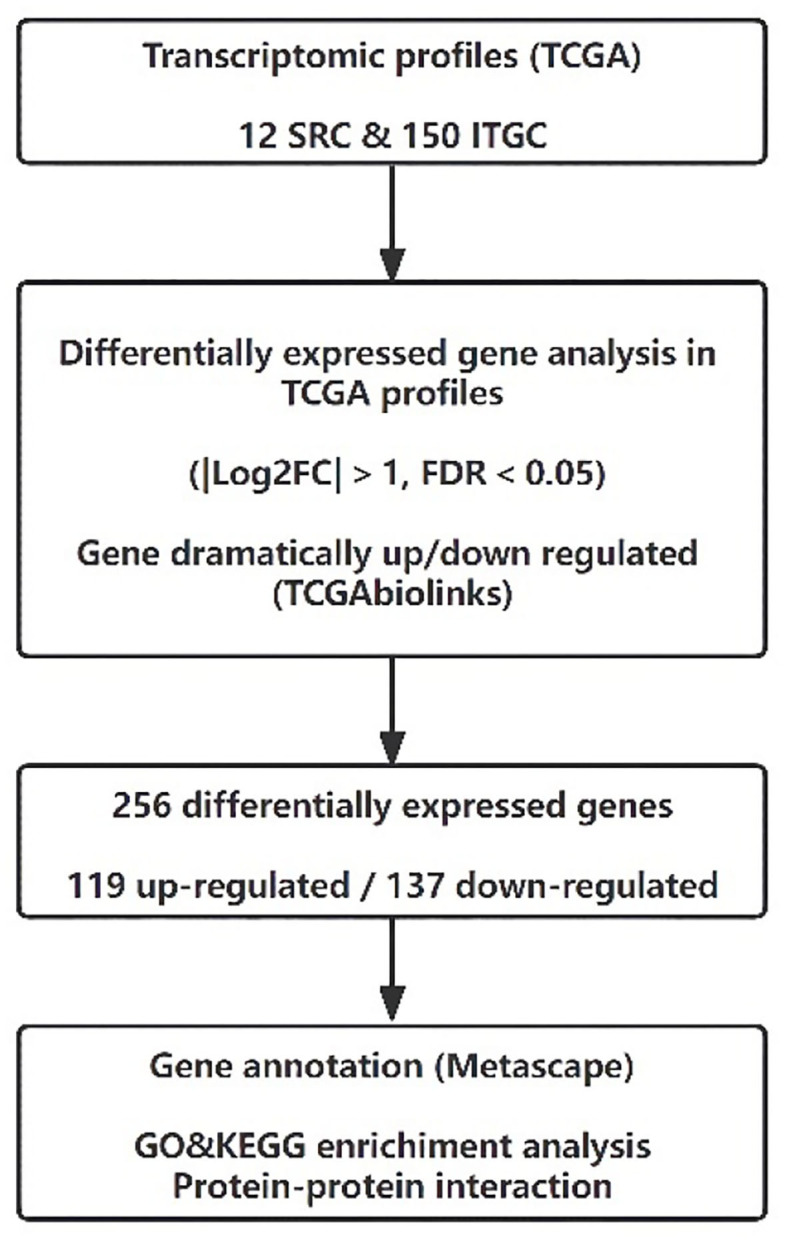
Patients and methods: The clinical data were based on the SEER database from 2004 to 2015. Kaplan-Meier (KM) curves were used to compare 5-year overall survival (OS), and Cox regression was used for univariate and multivariate analyses. Gene expression profiles were obtained from TCGA database, and differentially expressed genes (DEGs) were screened. Functional enrichment analysis, protein interaction and survival analysis will be further carried out. Genes of interest were verified by the Human Protein Atlas, immunohistochemistry, and encyclopedia of Cancer Cell Lines (CCLE). The relationship between genes of interest and immune cell infiltration was also analyzed by Tumor Immune Estimation Resource (TIMER).

Results: Compared with ITGC patients, SRC patients were more likely to be female, tended to be younger, and have a greater tumor distribution in the middle and lower stomach (p < 0.01). SRCs showed a significantly better prognosis than ITGCs (p < 0.01) in early gastric cancer (EGC), while the prognosis of SRCs was significantly worse than ITGCs (p < 0.05) in advanced gastric cancer (AGC). A total of 256 DEGs were screened in SRCs compared to ITGCs, and the enrichment analysis and protein interactions revealed that differential genes were mainly related to extracellular matrix organization. Thrombospondin1 (THBS1) and serpin peptidase inhibitor, clade E, member 1 (SERPINE1) are significantly differentially expressed between SRC and ITGC, which has been preliminarily verified by immunohistochemistry and open-source databases. THBS1 and SERPINE1 are also associated with multiple immune cell infiltrates in gastric cancer.

Conclusions: There were significant differences in the clinicopathological features and prognosis between SRC and ITGC. These results suggest that SRC and ITGC may be two distinct types of tumors with different pathogeneses. We found many codifferentially expressed genes and important pathways between SRC and ITGC. THBS1 and SERPINE1 were significantly differentially expressed in the two types of gastric cancer, and may have potentially important functions.

Keywords: clinical stages; genomic profile; intestinal-type gastric cancer; prognostic factor; signet-ring cell carcinoma.


Conflict of interest statement

The authors declare that the research was conducted in the absence of any commercial or financial relationships that could be construed as a potential conflict of interest.

Figures

Figure 1
Figure 1
Flow diagram of selected cases in the surveillance, epidemiology, and end results database.
Figure 2
Figure 2
Flow diagram of transcriptomic profiles in The Cancer Genome Atlas database.
Figure 3
Figure 3
Kaplan–Meier survival curves comparing overall survival in signet-ring cell carcinoma and non-signet-ring cell carcinoma are shown for (A) all stages, (B) early gastric cancer, and (C) advanced gastric cancer.
Figure 4
Figure 4
(A) Volcano map of differentially expressed genes. Bar graph of enriched terms across differentially expressed genes are shown for (B) up-regulate, (D) down-regulate, and (C) network of enriched terms colored by cluster ID, each node represents an enriched term. Nodes that share the same cluster ID are typically close to each other and terms with a similarity >0.3 are connected by edges.
Figure 5
Figure 5
Protein–protein interaction network is shown for: (A) MCODE 1, (B) MCODE 2, (C) MCODE 3, and (D) MCODE 4. The resultant network contains the subset of proteins that form physical interactions with at least one other member in the list. If the network contains between 3 and 500 proteins, the Molecular Complex Detection (MCODE) algorithm has been applied to identify densely connected network components. Gene ontology enrichment analysis was applied to each MCODE network for (E).
Figure 6
Figure 6
Survival analysis are shown for (A) THBS1, (B) SERPINE1, (C) FGF2, and (D) VTN.
Figure 7
Figure 7
Correlation analysis is shown for (A) THBS1 and SERPINE1, (B) THBS1 and FGF2, (C) SERPINE1 and FGF2, (D) THBS1 and VTN, (E) SERPINE1 and VTN, and (F) VTN and FGF2.
Figure 8
Figure 8
THBS1 showed moderate to strong membranous staining in malignant tumor cells, with occasional cytoplasmic staining. SERPINE1 was negatively expressed in all tumor tissues via The Human Protein Atlas.
Figure 9
Figure 9
Gene expression in different cancer cell lines for (A) THBS1 and (B) SERPINE1. The black dotted lines represent the average expression of all tumors, and the horizontal lines in the middle of each boxplot represent the median expression of individual tumors.
Figure 10
Figure 10
Gene expression levels in different gastric cancer cell lines for (A) THBS1 in primary cancer cell, (B) SERPINE1 in primary cancer cell, (C) THBS1 in metastasis cancer cell, and (D) SERPINE1 in metastasis cancer cell.
Figure 11
Figure 11
Immunohistochemical staining of SRC and intestinal-type gastric carcinoma (ITGC) samples for (A) THBS1 and (B) SERPINE1. The blue color stood for nuclear staining and the yellow color for target protein staining (scale bars: 100 μm).
Figure 12
Figure 12
(A) Kaplan–Meier curves of gastric cancer stratified by immune cell abundance. Correlation with levels of immune infiltration (purity, B cells, CD8+ T cells, CD4+ T cells, macrophages, neutrophils, and dendritic cells) for (B) THBS1 and (C) SERPINE1. The correlation measurement is indicated by the partial correlation value using Spearman's partial rho and the statistical significance of the p-value.

References

    1. Lee YC, Chiang TH, Chou CK, Tu YK, Liao WC, Wu MS, et al. . Association between helicobacter pylori eradication and gastric cancer incidence: a systematic review and meta-analysis. Gastroenterology. (2016) 150:1113–24.e5. 10.1053/j.gastro.2016.01.028 - DOI - PubMed
    1. Henson DE, Dittus C, Younes M, Nguyen H, Albores-Saavedra J. Differential trends in the intestinal and diffuse types of gastric carcinoma in the United States, 1973-2000: increase in the signet ring cell type. Arch Pathol Lab Med. (2004) 128:765–70. 10.5858/2004-128-765-DTITIA - DOI - PubMed
    1. Nagtegaal ID, Odze RD, Klimstra D, Paradis V, Rugge M, Schirmacher P, et al. . The 2019 WHO classification of tumours of the digestive system. Histopathology. (2020) 76:182–8. 10.1111/his.13975 - DOI - PMC - PubMed
    1. Kim JP, Kim SC, Yang HK. Prognostic significance of signet ring cell carcinoma of the stomach. Surg Oncol. (1994) 3:221–7. 10.1016/0960-7404(94)90037-X - DOI - PubMed
    1. Piessen G, Messager M, Leteurtre E, Jean-Pierre T, Mariette C. Signet ring cell histology is an independent predictor of poor prognosis in gastric adenocarcinoma regardless of tumoral clinical presentation. Ann Surg. (2009) 250:878–87. 10.1097/SLA.0b013e3181b21c7b - DOI - PubMed