. 2022 Mar 16;25(4):104097.
doi: 10.1016/j.isci.2022.104097. eCollection 2022 Apr 15.

High-resolution Slide-seqV2 spatial transcriptomics enables discovery of disease-specific cell neighborhoods and pathways

Affiliations

High-resolution Slide-seqV2 spatial transcriptomics enables discovery of disease-specific cell neighborhoods and pathways

Jamie L Marshall et al. iScience. .

Abstract

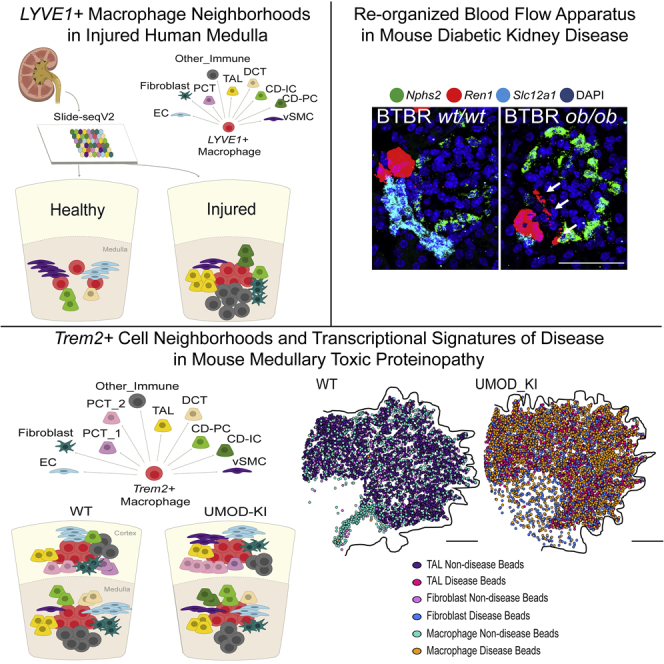
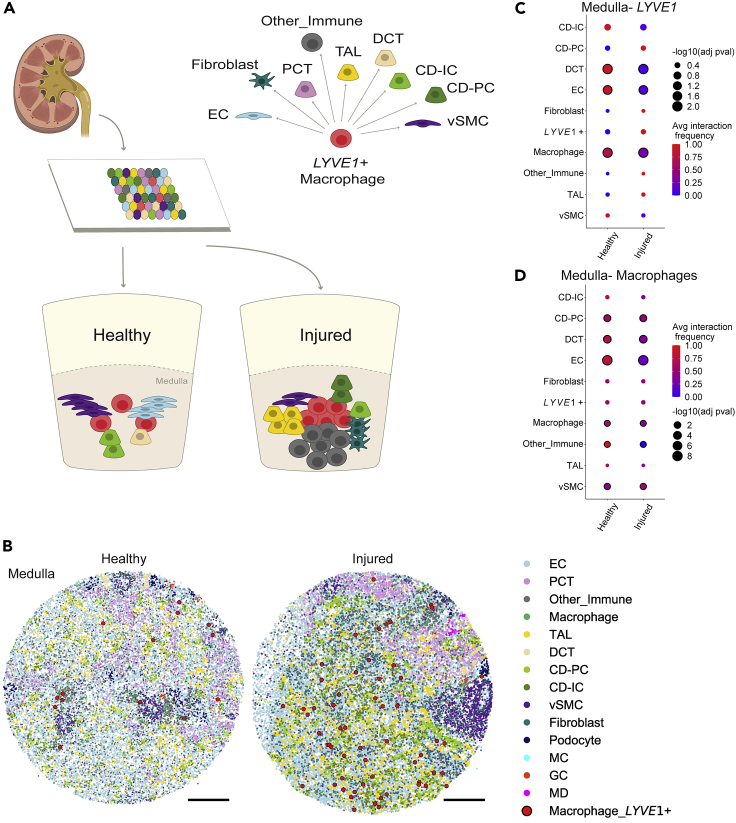
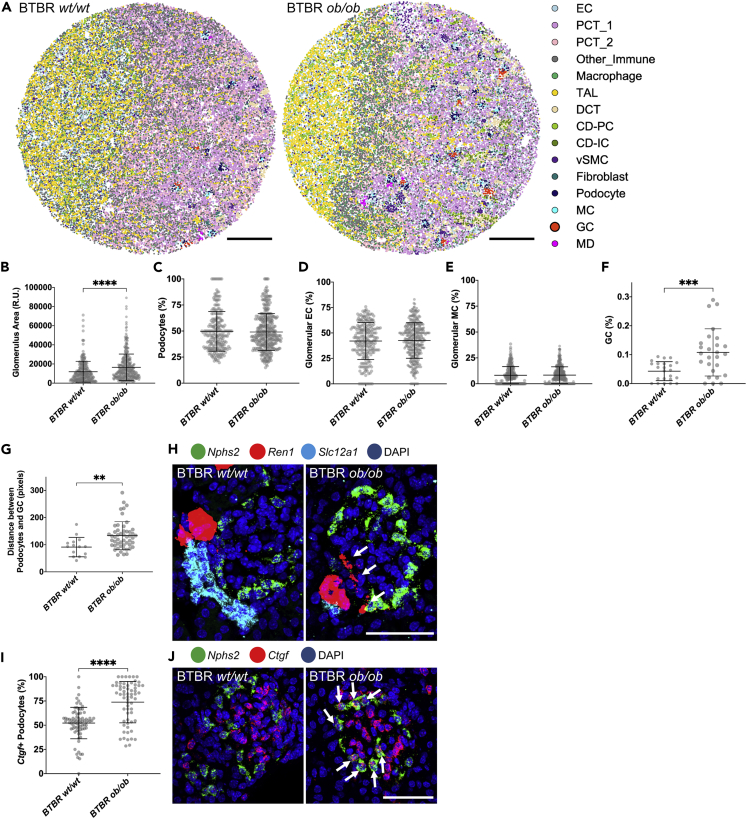
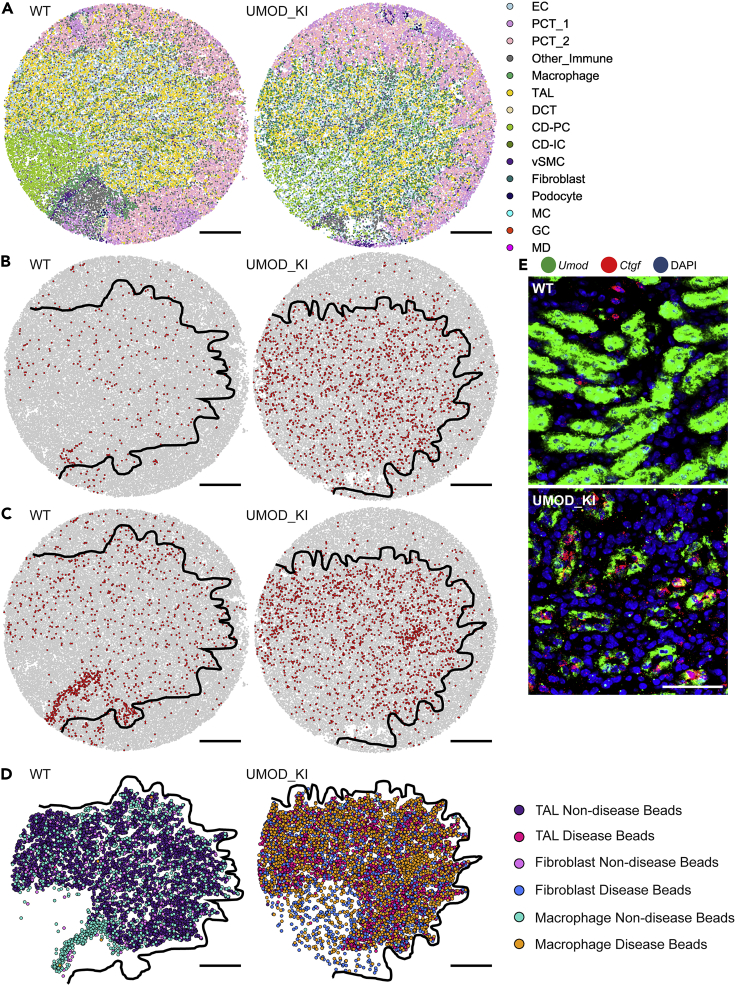
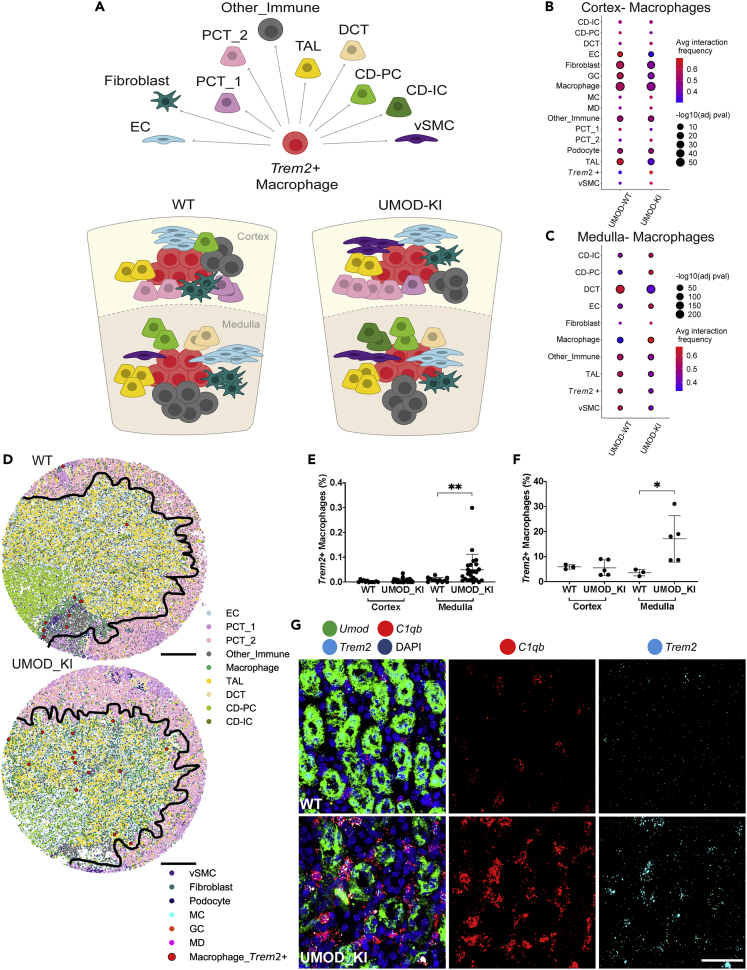
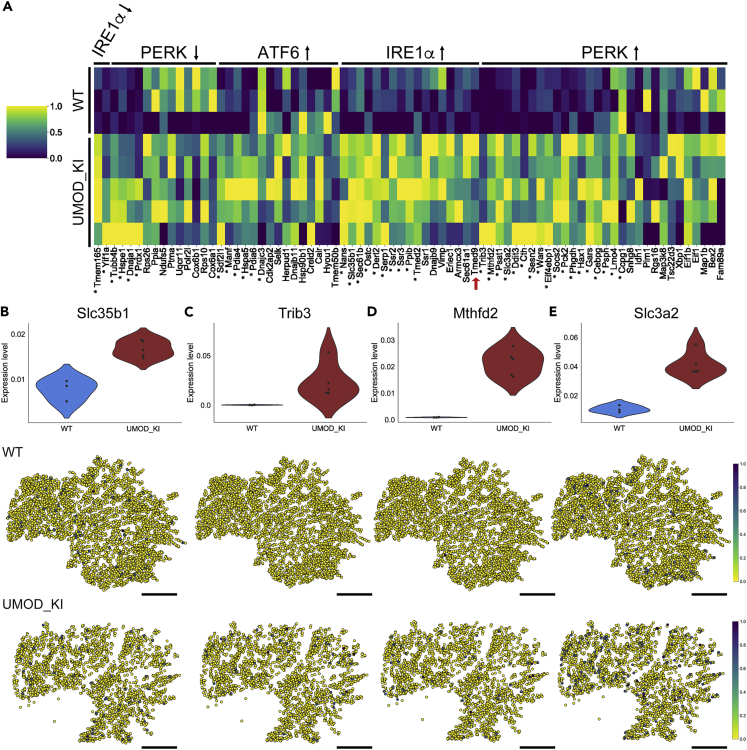
High-resolution spatial transcriptomics enables mapping of RNA expression directly from intact tissue sections; however, its utility for the elucidation of disease processes and therapeutically actionable pathways remains unexplored. We applied Slide-seqV2 to mouse and human kidneys, in healthy and distinct disease paradigms. First, we established the feasibility of Slide-seqV2 in tissue from nine distinct human kidneys, which revealed a cell neighborhood centered around a population of LYVE1+ macrophages. Second, in a mouse model of diabetic kidney disease, we detected changes in the cellular organization of the spatially restricted kidney filter and blood-flow-regulating apparatus. Third, in a mouse model of a toxic proteinopathy, we identified previously unknown, disease-specific cell neighborhoods centered around macrophages. In a spatially restricted subpopulation of epithelial cells, we discovered perturbations in 77 genes associated with the unfolded protein response. Our studies illustrate and experimentally validate the utility of Slide-seqV2 for the discovery of disease-specific cell neighborhoods.

Keywords: Cell biology; Pathophysiology; Transcriptomics.


Conflict of interest statement

AG serves as a founding advisor to Goldfinch Biopharma and to a new Atlas Ventures funded company, with respective agreements reviewed and managed by Mass General Brigham (MGB) and the Broad Institute of MIT and Harvard in accordance with their conflict of interest policies. RRS, FC, and EZM are inventors on a pending patent application related to the development of Slide-seq. EZM is an advisor to Curio Biosciences, Inc. FC is a paid consultant for Atlas Bio. KAV is currently an employee and shareholder of Q32 Bio, Inc. JLM is currently an employee and shareholder of Solid Biosciences, Inc.

Figures

None
Graphical abstract
Figure 1
Figure 1
Slide-seqV2 spatial transcriptomics in human kidney informs methods to identify and quantify cell-cell interactions frequency and cell neighborhoods (A) Schematic demonstrating the Slide-seqV2 method. A 10 μm sagittal section of kidney is placed onto a Slide-seqV2 array. The arrays bind to RNA in the tissue and result in a spatial transcriptome with cDNA containing a barcode from each bead. (B) Medulla arrays showing all cell mappings and spatial locations of LYVE1+ macrophages in large red circles. Images of individual cell populations are plotted in Figures S61 and S62. Scale bars, 500 μm. (C and D) Uniquely enabled by the spatial resolution, we identified neighboring cell types in the medulla of healthy and injured human kidney. LYVE1+ macrophages interact with endothelial cells (ECs) and distal convoluted tubular epithelial cells (DCTs) in healthy human medulla. These interactions are decreased in injured medulla. Dot plot shows the interaction frequency of (C) LYVE1+ macrophages and (D) all macrophages versus every other cell type in the tissue array. The color of the dots indicates the intensity of the interaction (red, increased; blue, decreased interaction). The size of the dots indicates the adjusted p value for cell-cell interactions, and significance is shown by a black outline around the dot (adjusted p value < 0.05). Cell types not represented in the dot plot had no interactions with macrophages of interest.
Figure 2
Figure 2
Near-single-cell spatial resolution in diabetic mouse kidney reveals an expansion of granular cells and a disrupted blood flow regulating apparatus (A) Arrays displaying cell types in BTBR w/w (left) and BTBR ob/ob diabetic mice (right). Images of individual cell populations are plotted in Figure S64. Scale bars, 500 μm. (B–F) Plots from Slide-seq arrays showing (B) average area of glomeruli (p value <0.0001), (C) percentage of beads classified as podocytes, (D) percentage of beads classified as glomerular endothelial cells, (E) percentage of beads classified as glomerular mesangial cells, (F) percentage of beads classified as granular cells (p value 0.0009) in BTBR w/w and BTBR ob/ob mice. (G) Plot from Slide-seq arrays showing the average distance between the center of glomerulus and granular cell cluster in BTBR w/w and BTBR ob/ob mice (p value 0.0018). Data were obtained from cross-sections of four mice per genotype. (H) HCR validation images, showing Nphs2+ podocytes, Ren1+ granular cells, Slc12a1+ TAL, and all cells in DAPI. Scale bar, 50 μm. Disorganized Ren1+ cells are denoted with white arrows. (I and J) HCR quantification of (p value <0.0001) and (J) HCR images of Ctgf + Nphs2+ injured podocytes (arrows). Scale bar, 50 μm. Data obtained from entire cross sections of a kidney from four mice per genotype. All error bars represent standard deviation of the mean.
Figure 3
Figure 3
Slide-seqV2 reveals disease-specific, medulla-restricted cell neighborhoods and injured epithelial cells in a mouse model of a toxic proteinopathy due to Umod mutations (A–C) Arrays displaying all cell types in WT (left) and UMOD-KI mice (right). Images of individual cell populations are plotted in Figure S65. Arrays showing delineation of cortex vs medulla in WT and UMOD-KI arrays where red beads show the spatial location and quantity of (B) fibroblasts and (C) macrophages. (D) Based on unbiased DGE, array plots show spatial mapping of TAL (non-disease in purple; disease in red), fibroblast (non-disease in pink; disease in blue), and macrophage beads (non-disease in green; disease in orange) in WT and UMOD-KI tissue. Beads classified by DGE as “disease” map primarily onto the medulla of UMOD-KI arrays, compared with beads classified as “nondisease” that map primarily onto the medulla of WT arrays (Fisher exact test p < 10ˆ-100). Scale bars, 500 μm. (E) HCR images of Umod + Ctgf + double-positive injured TALs. Scale bar, 50 μm.
Figure 4
Figure 4
Rare Trem2+ macrophage expansion associated with disease and localized specifically to kidney medulla (A) Schematic showing location, cortex versus medulla, of Trem2+ macrophages and immediately adjacent neighboring cell types. (B and C) Uniquely enabled by high spatial resolution, we quantified macrophage-neighbor cell interactions. Dot plots show average cell-cell interaction frequencies (relative proportions) for all macrophages in (B) cortex and (C) medulla. Significant interactions are displayed with a black border around colored circles. Cell types not represented in the dot plot had no interactions with macrophages of interest. (D) Arrays showing all cell mappings, cortex and medulla delineation, and spatial localization of Trem2+ macrophages in large red circles. Scale bars, 500 μm. (E) Plots from Slide-seqV2 arrays showing percentage of beads classified as Trem2+ macrophages (p value 0.003). Each point represents an array from 3 WT to 5 UMOD-KI mice. Error bars represent SD of the mean. (F) Plots generated from HCR validation showing percentage of cells that are Trem2+ macrophages (p value 0.0357). Each point represents a mouse. Error bars represent SD of the mean. (G) HCR images from two different WT and UMOD-KI mice showing Trem2+ C1qb + macrophages in the medulla (Umod). Scale bar, 50 μm.
Figure 5
Figure 5
Spatially restricted, cell-specific, and disease-associated perturbations in 77 genes associated with the UPR in medullary TAL epithelial cells uniquely revealed by Slide-seqV2 (A–E) Heatmap showing relative expression level of 77 UPR genes averaged across arrays in WT and UMOD-KI mice from medullary TAL beads. Tmed9 is indicated with a red arrow. Significant genes are denoted with an asterisk (Benjamani-Hochberg-corrected p < 0.05). Violin plots showing expression level in medulla TAL (top) and all medulla TAL beads in arrays (middle, bottom) are shown with expression level for notable genes in (B) IRE1ɑ upregulated pathway gene, Slc35b1 and PERK upregulated pathway genes, (C) Trib3, (D) Mthfd2, and (E) Slc3a2. Scale bars, 500 μm.

Similar articles

Cited by

References

    1. Adamson B., Norman T.M., Jost M., Cho M.Y., Nuñez J.K., Chen Y., Villalta J.E., Gilbert L.A., Horlbeck M.A., Hein M.Y., et al. A multiplexed single-cell CRISPR screening platform enables systematic dissection of the unfolded protein response. Cell. 2016;167:1867–1882.e21. - PMC - PubMed
    1. Alon S., Goodwin D.R., Sinha A., Wassie A.T., Chen F., Daugharthy E.R., Bando Y., Kajita A., Xue A.G., Marrett K., et al. Expansion sequencing: spatially precise in situ transcriptomics in intact biological systems. Science. 2021;371:eaax2656. doi: 10.1126/science.aax2656. - DOI - PMC - PubMed
    1. Bachmann S., Oberbäumer I. Structural and molecular dissection of the juxtaglomerular apparatus: new aspects for the role of nitric oxide. Kidney Int. Suppl. 1998;67:S29–S33. - PubMed
    1. Carlberg K., Korotkova M., Larsson L., Catrina A.I., Ståhl P.L., Malmström V. Exploring inflammatory signatures in arthritic joint biopsies with spatial transcriptomics. Sci. Rep. 2019;9:18975. - PMC - PubMed
    1. Chen H., Murray E., Laumas A., Li J., Nie X., Hotaling J., Guo J., Cairns B.R., Macosko E.Z., Cheng C.Y., Chen F. Dissecting mammalian spermatogenesis using spatial transcriptomics. Cell Rep. 2021;37:109915. doi: 10.1101/2020.10.17.343335. - DOI - PMC - PubMed