PLETHORA-WOX5 interaction and subnuclear localization control Arabidopsis root stem cell maintenance
- PMID: 35373503
- PMCID: PMC9171415
- DOI: 10.15252/embr.202154105
PLETHORA-WOX5 interaction and subnuclear localization control Arabidopsis root stem cell maintenance
Abstract
Maintenance and homeostasis of the stem cell niche (SCN) in the Arabidopsis root is essential for growth and development of all root cell types. The SCN is organized around a quiescent center (QC) maintaining the stemness of cells in direct contact. The key transcription factors (TFs) WUSCHEL-RELATED HOMEOBOX 5 (WOX5) and PLETHORAs (PLTs) are expressed in the SCN where they maintain the QC and regulate distal columella stem cell (CSC) fate. Here, we describe the concerted mutual regulation of the key TFs WOX5 and PLTs on a transcriptional and protein interaction level. Additionally, by applying a novel SCN staining method, we demonstrate that both WOX5 and PLTs regulate root SCN homeostasis as they control QC quiescence and CSC fate interdependently. Moreover, we uncover that some PLTs, especially PLT3, contain intrinsically disordered prion-like domains (PrDs) that are necessary for complex formation with WOX5 and its recruitment to subnuclear microdomains/nuclear bodies (NBs) in the CSCs. We propose that this partitioning of PLT-WOX5 complexes to NBs, possibly by phase separation, is important for CSC fate determination.
Keywords: differentiation; nuclear bodies; prion-like domains; root stem cells; transcription factor complexes.
© 2022 The Authors. Published under the terms of the CC BY 4.0 license.
Figures

- A
Schematic representation of the Arabidopsis root meristem. The QC cells (red) maintain the surrounding stem cells (initials) outlined in black together building the root stem cell niche (SCN). The different cell types are color coded. QC = quiescent center (red); CSC = columella stem cells (yellow); CC = columella cells (green); LRC = lateral root cap (light purple); ep = epidermis (purple); c = cortex (light turquoise); en = endodermis (dark turquoise); bright turquoise = cortex/endodermis initials; dark purple = epidermis/lateral root cap initials; dark orange = stele initials; stele = light orange; grey dots = starch granules.
- B, C
Representative images of pPLT3::erCFP (cyan) expressing and PI‐stained (red) Arabidopsis roots in Col or wox5 background, respectively.
- D
Mean fluorescence intensities of the pPLT3::erCFP roots summarized in box and scatter plots. The mean fluorescence intensity of the CFP signal in Col roots was to set to 100%.
- E, F
Representative images of pPLT3::PLT3‐YFP (yellow) expressing and FM4‐64‐stained (red) Arabidopsis roots in Col or wox5 mutant background, respectively.
- G
Mean fluorescence intensities of the pPLT3::PLT3‐YFP expressing roots summarized in box and scatter plots. The mean fluorescence intensity of the YFP signal in Col roots was to set to 100%.

- A–F
Representative FM4‐64‐stained Arabidopsis roots (grey) expressing pWOX5::mVenus‐NLS (green) in Col, plt2, plt3, and plt2, plt3 double mutant background in longitudinal (A‐D), or transversal (E‐F) optical sections. (E′, F′) Analysis of representative images in (E) and (F) in Imaris to detect and count individual expressing nuclei. (E″, F″) Overlay of 10 roots (biological replicates) showing the area of detected fluorescence (high levels in red, low levels in blue) in Col and plt2, plt3 double mutant roots.
- G
Number of nuclei (biological replicates) expressing pWOX5::mVenus‐NLS in Col and plt2, plt3 double mutant roots summarized in box and scatter plots.
- H
Area of WOX5 expression in µm2 in Col and plt2, plt3 double mutant roots summarized in box and scatter plots.

- A
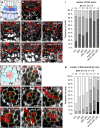
Schematic representation of a longitudinal section of an Arabidopsis RM. QC cells are marked in red, CSCs are marked in dark blue, CCs in light blue. Combined mPSPI (grey) and EdU (red) staining for 24 h (SCN staining) to analyze the CSC (A‐I) and QC division phenotype (J‐R) within the same roots are shown.
- B–H
Representative images of the SCN staining in Col, and the indicated single, double, and triple mutant roots. QC positions are marked by yellow arrowheads.
- I
Analyses of the SCN staining for CSC phenotypes. Frequencies of roots showing 0, 1, 2, or 3 CSC layers are plotted as bar graphs.
- J
Schematic representation of a transversal section of an Arabidopsis RM. QC cells are marked in red, CEI initials are marked in turquoise.
- K–Q
Representative images of transversal sections with QC cells outlined in yellow.
- R
Analyses of the SCN staining for QC division phenotypes. Frequencies of roots showing 0, 1, 2, 3 or ≥ 4 dividing QC cells are plotted as bar graphs.

- A
Representative figure of an Arabidopsis wild‐type root SCN staining. QC cells are outlined in yellow. Scale bars represent 10 µm.
- B
Representative figure of an Arabidopsis plt2, plt3 double mutant root SCN staining showing a periclinal cell division (PCD) in the QC (arrow). QC cells are outlined in yellow. Scale bars represent 10 µm.
- C
Analysis of the PCD phenotype. The frequency of roots (in percent) showing at least one PCD in the QC is plotted as a bar graph. Number of analyzed roots (n) (biological replicates) is indicated for each genotype and results from 2 to 5 technical replicates. PCD = periclinal cell division.

- A–G
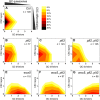
The combined results of the SCN staining in Fig 3 are shown as 2D plots to visualize the correlation of the CSC layer and QC division phenotypes. Number of CSC layers are shown on the y axis and the QC division phenotype is shown on the x‐axis. The darker the color, the more roots show the respective phenotype (see color gradient top right indicating the frequencies in percent). Col wild‐type roots show one layer of CSCs and no EdU stained cells (no QC division) after 24 h EdU staining. Number of analyzed roots (n) (biological replicates) is indicated for each genotype and results from 2 to 5 technical replicates per genotype.

- A–I
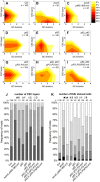
The combined results of the SCN staining are shown as 2D plots. Number of CSC layers is shown on the y axis and the QC division phenotype is shown on the x‐axis. The darker the color, the more roots show the respective phenotype (see color gradient on the right indicating the frequencies).
- J, K
Analyses of the SCN staining for CSC layer (J) or QC division (K) phenotypes. The frequencies of roots showing 0–3 CSC layers, or 0–4 dividing QC cells are plotted as bar graphs. Number of analyzed roots (n) (biological replicates) is indicated for each genotype and results from 2 to 4 technical replicates. EdU = 5‐ethynyl‐2′‐deoxyuridine; CSC = columella stem cell; QC = quiescent center; W5 = WOX5, P3 = PLT3.

- A–C′
PLT3‐mV expression driven by the PLT3 endogenous promoter in LRP (A) and primary root SCN (B‐C′) in plt3 mutant Arabidopsis roots. (A) Representative image of PLT3‐mV expression (yellow) in an LRP showing the subnuclear localization to NBs. Transmitted light image in grey. (B, B′) SCN of an PLT3‐mV expressing FM4‐64‐stained (red) Arabidopsis primary root. The magnification of the CSC layer (B′) shows the subnuclear localization of PLT3 to NBs in a CSC. White arrowhead points at a NB. (C, C’) SCN of an PLT3‐mV expressing Arabidopsis primary root. NBs are visible in the CSC layer in (C, also in the transversal view of the CSC layer C′). Arrowheads in B and C point at the QC (magenta) and CSC (cyan) positions. mV = mVenus; LRP = lateral root primordium; SCN = stem cell niche; NBs = nuclear bodies; CSC = columella stem cell. Scale bars represent 10 µm.

- A
Schematic representation of PLT3 protein domains. The areas in red are predicted prion‐like domains (PrDs) and were deleted in PLT3ΔPrD‐mV. The areas highlighted in yellow contain polyQ‐stretches and were deleted in PLT3ΔQ‐mV.
- B–D
Representative images of PLT3‐mV (B), PLT3ΔQ‐mV (C) and PLT3ΔPrD‐mV (D) in transiently expressing N. benthamiana leaf epidermal cells.
- E, F
PLT3‐mV (E) and PLT3ΔPrD‐mV (F) expression driven by the PLT3 endogenous promoter in lateral root primordia of plt2, plt3 double mutant Arabidopsis roots.
- G‐I″
Co‐expression of PLT3‐mV (G), PLTΔQ‐mV (H) and PLT3ΔPrD‐mV (I) with WOX5‐mCh (G′, H′, I′) in transiently expressing N. benthamiana leaf epidermal cells.
- J–J‴
Expression of PLT3‐mV (J) in transiently expressing N. benthamiana leaf epidermal cells in combination with RNA staining with EU (18 h), visualized by click‐reaction with Alexa Fluor® 555 (J′) and a DNA staining with DAPI (J″).

- A, D, G, J, M
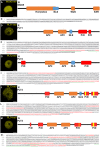
Representative images of (sub‐)nuclear localization of WOX5‐mV (A), PLT1‐mV(D), PLT2‐mV (G), PLT3‐mV (J) and PLT4‐mV (m) in transiently expressing N. benthamina epidermal cells. Scale bars represent 5 µm.
- B, E, H, K, N
Schematic representation of WOX5 (B), PLT1 (E) PLT2 (H), PLT3 (K), and PLT4 (N) protein domains. The areas in red are predicted prion‐like domains (PrDs), analyzed using the PLAAC prediction tool. Yellow areas are polyQ stretches (defined as more than three Qs in a row) in the PLT3 and PLT4 amino acid sequence.
- C, F, I, L, O
Protein sequences of WOX5 (C) PLT1 (F), PLT2 (I), PLT3 (L), and PLT4 (O). The red highlighted sequences are the predicted prion‐like domains (PrDs). mV = mVenus fluorescent protein; PrD = prion‐like domain; EAR = Ethylene‐responsive binding factor‐associated repression domain; WUS = WUSCHEL box; AP2 = APETALA2 domain; NLS = nuclear localization signal.

- A–H
Fluorescence Lifetime Imaging (FLIM) results of transiently expressing N. benthamiana leaf epidermal cells. Representative FLIM images of WOX5‐mVenus (donor only) plus the indicated acceptors after a pixel‐wise mono‐exponential fit of the mVenus fluorescence signal. The fluorescence lifetime of WOX5‐mVenus in ns is color‐coded. Low lifetimes (blue) due to FRET indicate strong interaction of the two proteins and high lifetimes (red) indicate weaker or no interaction. Scale bars represent 5 µm.
- I
Fluorescence lifetimes in ns are summarized in combined jitter and box plots. The dashed line represents the fluorescence lifetime mean value of the WOX5‐mV co‐expressed with free mCh as negative control. The one‐way ANOVA and Holm–Sidak post‐hoc multiple comparisons test was used to test for statistical significance. Samples with identical letters do not show significant differences (α = 0.01). Number of nuclei analyzed (n) (biological replicates) is indicated and results from 2 to 9 technical replicates. Box = 25–75% of percentile, whisker = 1.5 interquartile range, − = median, ▪ = mean value.
- J
Representative FLIM image of WOX5‐mVenus plus the indicated acceptor after a pixel‐wise mono‐exponential fit of the mVenus fluorescence signal. The fluorescence lifetime of WOX5‐mVenus in ns is color‐coded. Low lifetimes (blue) due to FRET indicate strong interaction of the two proteins and high lifetimes (red) indicate weaker or no interaction. Scale bars represent 5 µm.
- K
Individual nuclei showing nuclear bodies during co‐expression of WOX5‐mV and PLT3‐mCh were analyzed for WOX5‐mV lifetime in the nuclear bodies or nucleoplasm separately (n = 7 (biological replicates), from four technical replicates. mCh = mCherry. mV = mVenus.

- A–A′
Representative image of the SCN in a lateral root of an Arabidopsis reporter line expressing WOX5‐mV (A) and PLT3‐mCh (A′) in Col‐0 background driven by their respective endogenous promoters. The TFs localize to overlapping domains (A″). Blue arrowheads mark QC cells, green arrowheads mark CSCs. Scalebars represent 10 µm.
- B
Fluorescence Lifetime Imaging (FLIM) results of experiments performed in the SCN of lateral Col‐0 roots expressing either only WOX5‐mV (donor‐only) or both WOX5‐mV and PLT3‐mCh driven by their respective endogenous promoters. Number of analyzed roots (n) (biological replicates) is indicated for each genotype and results from 4 technical replicates. Donor fluorescence lifetimes in ns are summarized in combined scatter and box plots. Box = 25–75% of percentile, whisker = 1.5 interquartile range, − = median, □ = mean value, X = minimum/maximum value. The Kruskal–Wallis ANOVA with subsequent Dunn’s test was used to test for statistical significance. Asterisk indicates statistical significance (α = 0.01). mV = mVenus; mCh = mCherry; SCN = stem cell niche.

- A–C
Representative images of low (A), medium (B), and high (C) PLT3‐mVenus expressing nuclei in transiently expressing N. benthamiana leaf epidermal cells are shown. Scale bars represent 5 µm.
- D–G
Analyses of intensities, numbers, and average volume of PLT3 NBs in individual nuclei, n = 37 (biological replicates).

Transcriptional regulation of WOX5 (red) and PLT (green) expression by negative feedback regulation in the Arabidopsis RAM. WOX5 is expressed in the QC and indirectly promotes PLT expression (dashed arrow), whereas PLT expression is directly regulating WOX5 expression confining it to the QC position (solid barred lines).
Both WOX5 (red) and PLT3 (green) are present homogenously within the nuclei of the QC cells. WOX5 can move to the CSCs and is recruited there by PLT3 to NBs (yellow), where interaction takes place and RNA is present (grey in magnification). This maintains the stem cell character of the CSCs (arrow) but already leads to a determination to subsequent CC fate. Gray dots represent starch granules.
Similar articles
-
WOX5 suppresses CYCLIN D activity to establish quiescence at the center of the root stem cell niche.Curr Biol. 2014 Aug 18;24(16):1939-44. doi: 10.1016/j.cub.2014.07.019. Epub 2014 Aug 7. Curr Biol. 2014. PMID: 25127220 Free PMC article.
-
Mathematical modelling of WOX5- and CLE40-mediated columella stem cell homeostasis in Arabidopsis.J Exp Bot. 2015 Aug;66(17):5375-84. doi: 10.1093/jxb/erv257. Epub 2015 May 26. J Exp Bot. 2015. PMID: 26019259 Free PMC article.
-
WOX5 is Shining in the Root Stem Cell Niche.Trends Plant Sci. 2015 Oct;20(10):601-603. doi: 10.1016/j.tplants.2015.08.009. Trends Plant Sci. 2015. PMID: 26440429
-
Hydrogen Peroxide Signaling in the Maintenance of Plant Root Apical Meristem Activity.Antioxidants (Basel). 2024 Apr 30;13(5):554. doi: 10.3390/antiox13050554. Antioxidants (Basel). 2024. PMID: 38790659 Free PMC article. Review.
-
Hormonal orchestration of root apical meristem formation and maintenance in Arabidopsis.J Exp Bot. 2021 Oct 13;72(19):6768-6788. doi: 10.1093/jxb/erab360. J Exp Bot. 2021. PMID: 34343283 Review.
Cited by
-
The plant stem-cell niche and pluripotency: 15 years of an epigenetic perspective.Front Plant Sci. 2022 Oct 31;13:1018559. doi: 10.3389/fpls.2022.1018559. eCollection 2022. Front Plant Sci. 2022. PMID: 36388540 Free PMC article.
-
Come together now: Dynamic body-formation of key regulators integrates environmental cues in plant development.Front Plant Sci. 2022 Nov 14;13:1052107. doi: 10.3389/fpls.2022.1052107. eCollection 2022. Front Plant Sci. 2022. PMID: 36452084 Free PMC article.
-
CmWOX2 modulates somatic embryogenesis in Chinese chestnut (Castanea mollissima Blume).Plant Biotechnol (Tokyo). 2024 Dec 25;41(4):375-385. doi: 10.5511/plantbiotechnology.24.0527a. Plant Biotechnol (Tokyo). 2024. PMID: 40083577 Free PMC article.
-
Transcriptional landscapes of de novo root regeneration from detached Arabidopsis leaves revealed by time-lapse and single-cell RNA sequencing analyses.Plant Commun. 2022 Jul 11;3(4):100306. doi: 10.1016/j.xplc.2022.100306. Epub 2022 Feb 25. Plant Commun. 2022. PMID: 35605192 Free PMC article.
-
Root stem cell homeostasis in Arabidopsis involves cell-type specific transcription factor complexes.EMBO Rep. 2025 May;26(9):2323-2346. doi: 10.1038/s44319-025-00422-8. Epub 2025 Mar 19. EMBO Rep. 2025. PMID: 40108407 Free PMC article.
References
-
- Aguzzi A, Nuvolone M, Zhu C (2013) The immunobiology of prion diseases. Nat Rev Immunol 13: 888–902 - PubMed
-
- Aida M, Beis D, Heidstra R, Willemsen V, Blilou I, Galinha C, Nussaume L, Noh Y‐S, Amasino R, Scheres B (2004) The PLETHORA genes mediate patterning of the Arabidopsis root stem cell niche. Cell 119: 109–120 - PubMed
-
- Atanesyan L, Günther V, Dichtl B, Georgiev O, Schaffner W (2012) Polyglutamine tracts as modulators of transcriptional activation from yeast to mammals. Biol Chem 393: 63–70 - PubMed
-
- Bailey CH, Kandel ER, Si K (2004) The persistence of long‐term memory: a molecular approach to self‐sustaining changes in learning‐induced synaptic growth. Neuron 44: 49–57 - PubMed
Publication types
MeSH terms
Substances
LinkOut - more resources
Full Text Sources
Other Literature Sources
Molecular Biology Databases
Research Materials
Miscellaneous

