. 2022 Jul;70(7):1337-1358.
doi: 10.1002/glia.24177. Epub 2022 Apr 4.

Survival motor neuron protein deficiency alters microglia reactivity

Affiliations

Survival motor neuron protein deficiency alters microglia reactivity

Guzal Khayrullina et al. Glia. 2022 Jul.

Abstract

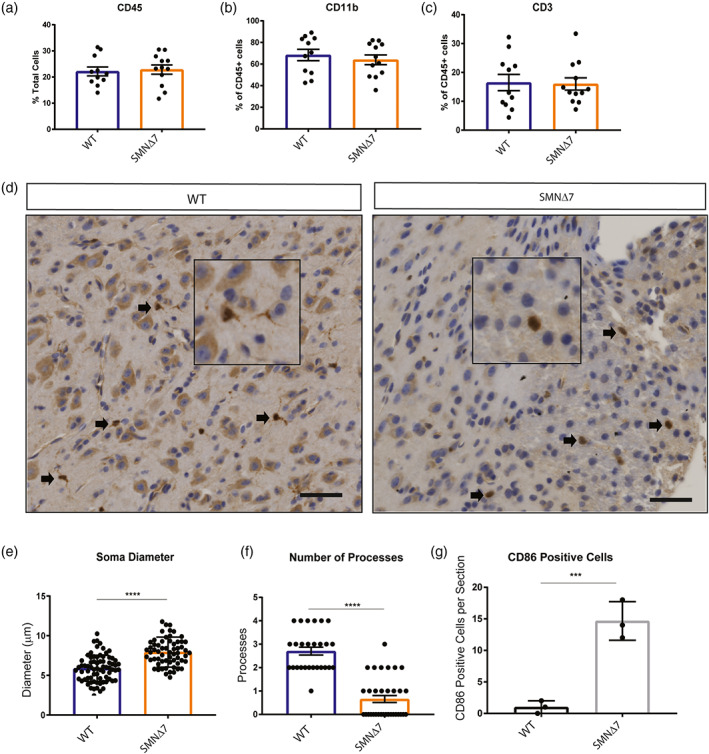
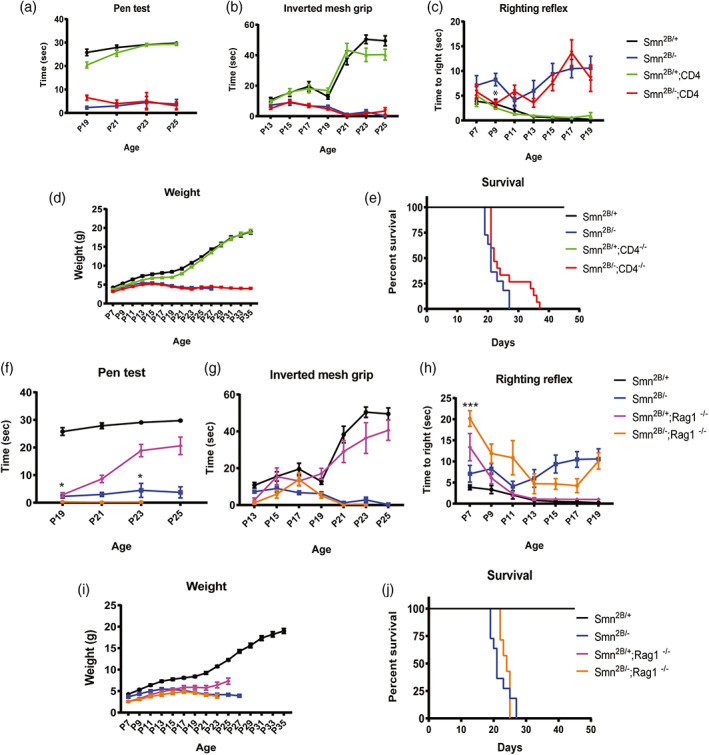
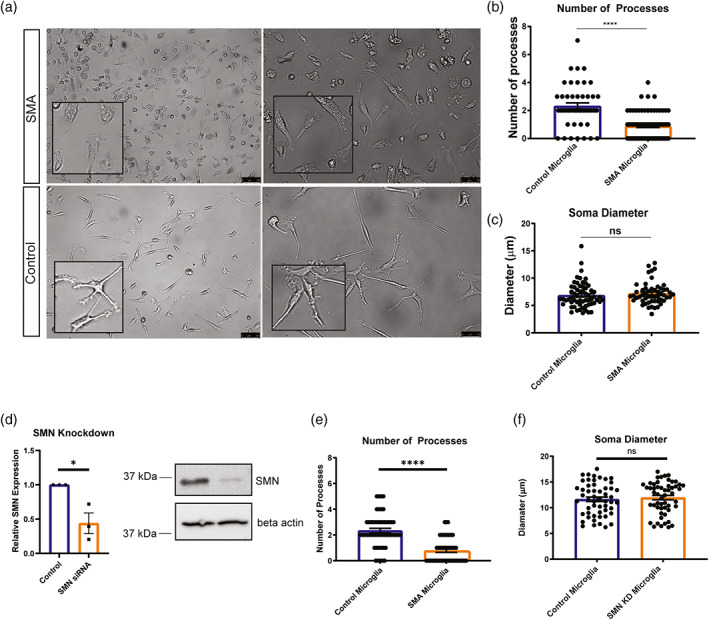
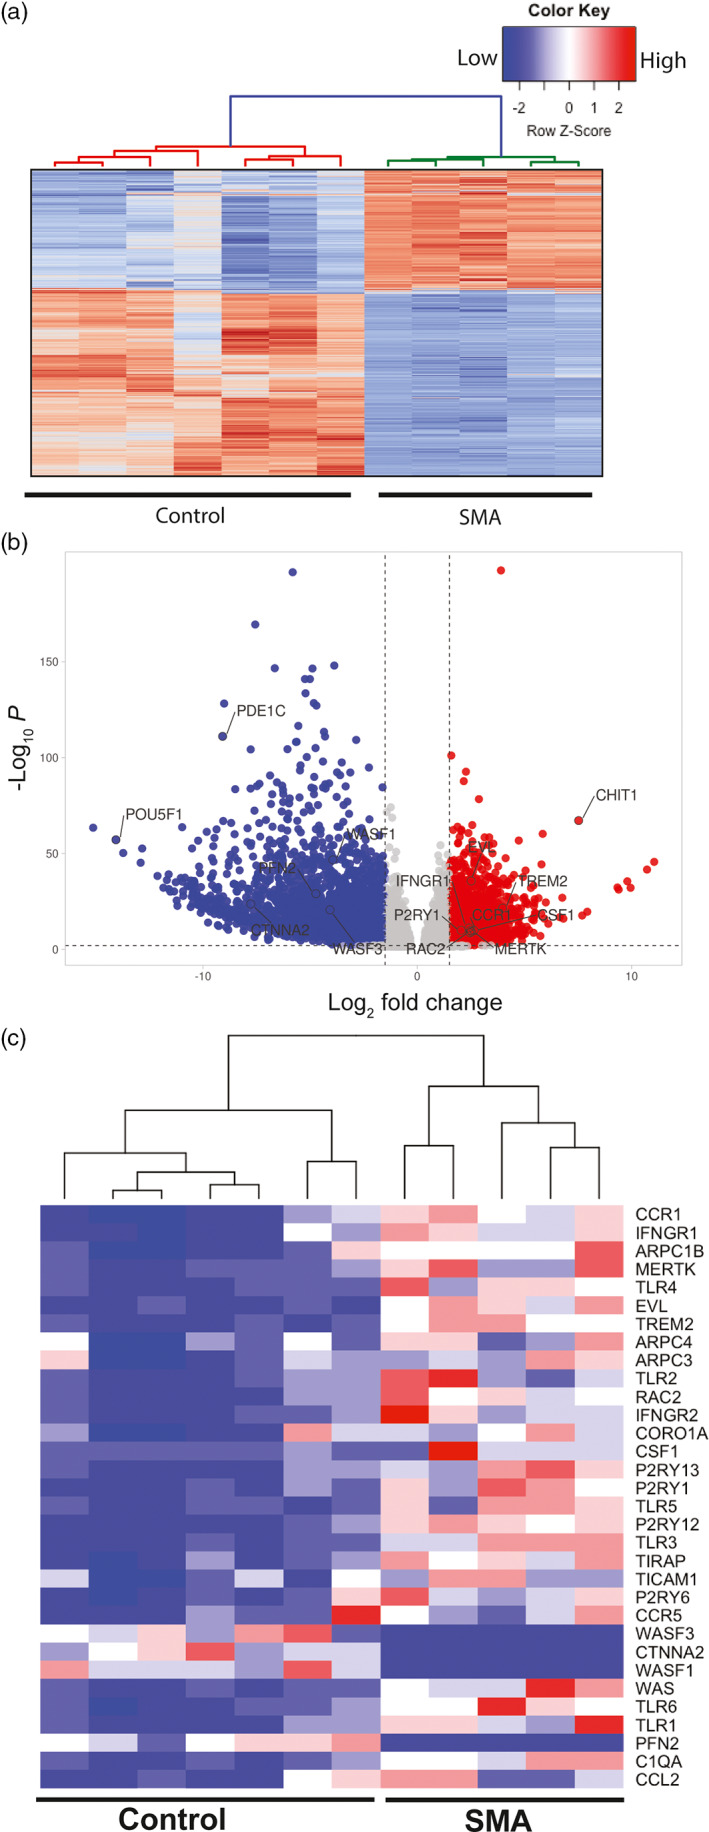
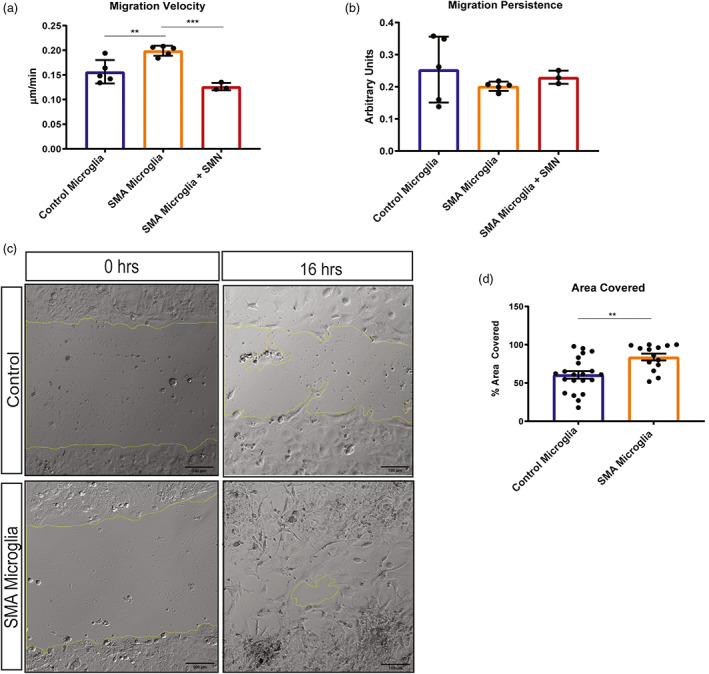
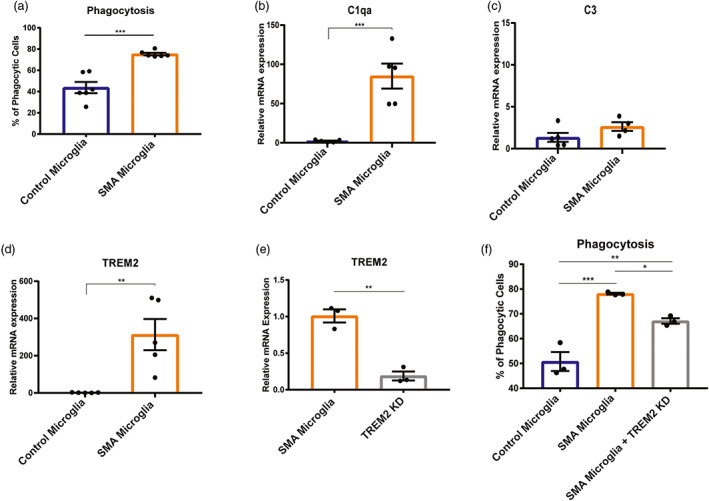
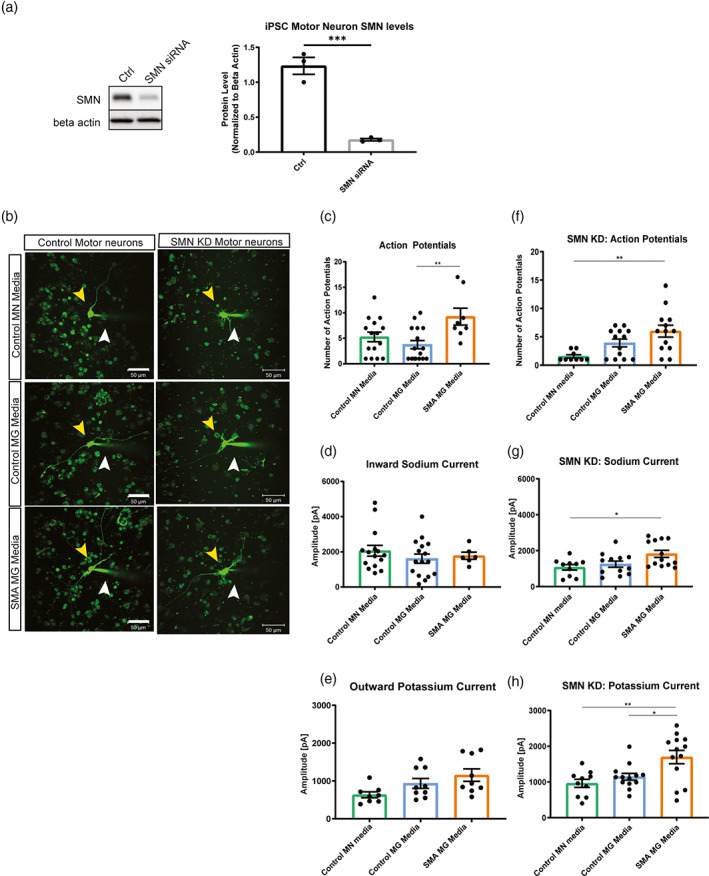
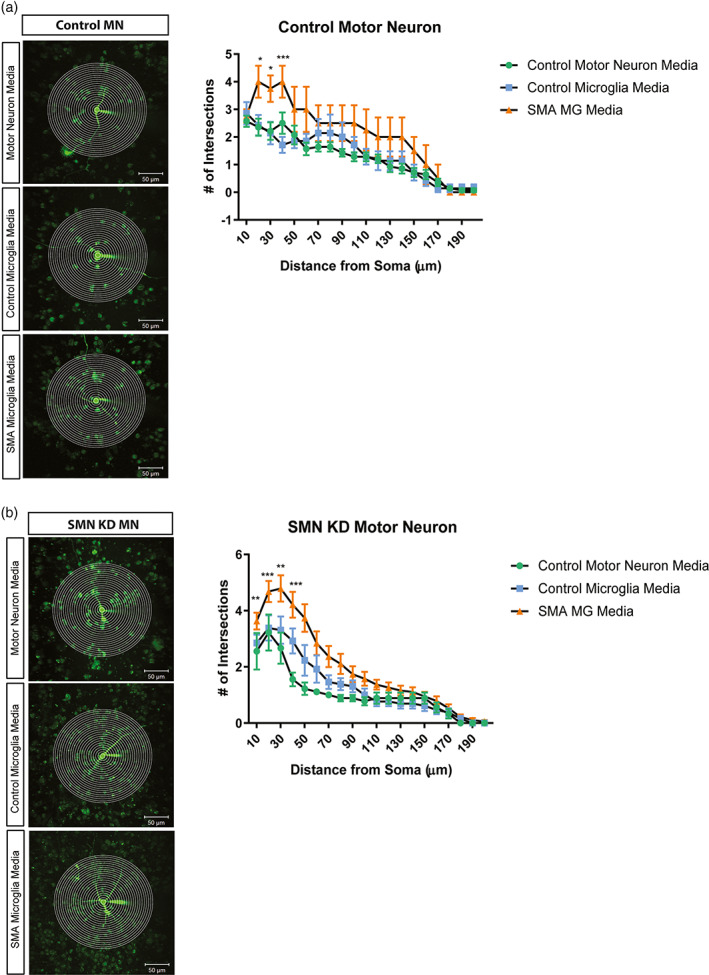
Survival motor neuron (SMN) protein deficiency results in loss of alpha motor neurons and subsequent muscle atrophy in patients with spinal muscular atrophy (SMA). Reactive microglia have been reported in SMA mice and depleting microglia rescues the number of proprioceptive synapses, suggesting a role in SMA pathology. Here, we explore the contribution of lymphocytes on microglia reactivity in SMA mice and investigate how SMN deficiency alters the reactive profile of human induced pluripotent stem cell (iPSC)-derived microglia. We show that microglia adopt a reactive morphology in spinal cords of SMA mice. Ablating lymphocytes did not alter the reactive morphology of SMA microglia and did not improve the survival or motor function of SMA mice, indicating limited impact of peripheral immune cells on the SMA phenotype. We found iPSC-derived SMA microglia adopted an amoeboid morphology and displayed a reactive transcriptome profile, increased cell migration, and enhanced phagocytic activity. Importantly, cell morphology and electrophysiological properties of motor neurons were altered when they were incubated with conditioned media from SMA microglia. Together, these data reveal that SMN-deficient microglia adopt a reactive profile and exhibit an exaggerated inflammatory response with potential impact on SMA neuropathology.

Keywords: induced pluripotent stem cell; inflammation; microglia; spinal muscular atrophy; survival motor neuron.


Conflict of interest statement

The authors declare no conflicts of interest.

Figures

FIGURE 1
FIGURE 1
Microglia adopt a reactive morphology in SMA mouse spinal cords. Monocytes were isolated from PND10 WT and SMNΔ7 mouse spinal cords (WT n = 11, SMNΔ7 n = 12). Total (a) monocytes (CD45+), (b) microglia (CD11b+), and (c) T‐cells (CD3+) populations were quantified by flow cytometry. Error bars represent mean ± SEM. (d) Spinal cord sections from L1‐L5 of PND10 SMNΔ7 and WT mice were immuno‐stained for Iba1. DAB staining was used to visualize antibody. Scale bars = 50 μm. (e) Soma diameter, and (f) number of branches were analyzed using image J. (g) Histological quantification of the number of microglia per section co‐staining with Iba1 and CD86 (L1‐L5 spinal cord). Values represent mean ± SEM.**p = .0081, ****p = <.0001, t‐test, Iba1+ cells were evaluated from 3 wild type and 3 SMA mice
FIGURE 2
FIGURE 2
Depleting mature lymphocytes does not improve survival and motor function of Smn 2B/− mice. (a) Inverted mesh grip (starting at PND13), (b) pen test (starting at PND19), and (c) righting reflex (starting at PND7) motor function tests were assessed in Smn 2B/+ (black), Smn 2B/− (blue), Smn 2B/+ ;CD4 /− (green), Smn 2B/− ,CD4 −/− (red) mice (n 11/group) (d) Mice were weighed to assess changes in body weight. (e) Kaplan–Meier survival analysis of Smn 2B/+ (black), Smn 2B/− (blue), Smn 2B/+ ;CD4 /− (green), Smn 2B/− ,CD4 −/− (red). Motor function was assessed in Smn 2B/+ (black), Smn 2B/− (blue), Smn 2B/+ ;Rag1 −/− (pink), Smn 2B/− ;Rag1 −/− (yellow) mice (n 7/group) by (f) inverted mesh grip (starting at PND13), (g) pen test (starting at PND19), and (h) Righting reflex (starting at PND7). (i) SMA mice were weighed every other day to assess changes in body weight. (j) Kaplan–Meier survival analysis of assessed. Survival curves were analyzed using a log‐rank (Mantel–Cox) test. A P value <.05 was considered statistically significant. Significance of behavior data was determined by two‐way ANOVA. Mantel‐Cox and Gehan Breslow‐Wilcoxon analyses were performed to determine significance between groups for all significant main effects and interactions. The same group for Smn 2B/+ and Smn 2B/− control animal were used to measure the effect of CD4 and Rag1 KO on the Smn 2B/+ mutant and do not represent two different set of controls
FIGURE 3
FIGURE 3
Microglia processes are retracted in iPSC derived SMA microglia. (a) Representative bright field images show control and SMA patient iPSC‐derived microglia at 10 days post differentiation. Scale bars = 100 μm (left panel) and 50 μm (right panel). (b) Number of processes (3 independent experiments were performed; a minimum of 45 microglia were counted per group). (c) Soma diameter (3 independent experiments were performed; a minimum of 50 Iba1+ microglia were counted per group) were analyzed using ImageJ. (d) Microglia derived from control cells were treated with siRNA to SMN and SMN knockdown confirmed by RT‐PCR and western blots. (e) Number of processes (3 independent experiments were performed; a minimum of 45 microglia were counted per group) following SMN knockdown in control cells. (f) Soma diameter (3 independent experiments were performed; a minimum of 50 Iba1+ microglia were counted per group) were analyzed using ImageJ following SMN knockdown in control cells. All groups were analyzed by unpaired t‐test. ****p < .0001. Values represent mean ± SEM
FIGURE 4
FIGURE 4
The transcriptome profile of SMA microglia is altered compared to controls. (a) Heatmap of the of the RNA‐seq data based on global mRNA expression from one SMA and one control line. Each column represents an independent differentiation (7 control and 6 SMA). Expression values were standardized and depicted on a z‐scale with red indicating high and blue indicating low expression, respectively. (b) Volcano plots illustrating fold‐change (log base 2) plotted against FDR‐adjusted p value (− log base 10) of genes differentially expressed between SMA and control microglia. A fold change of 1.5 or greater was used as the initial selection criteria. A total of 3664 transcripts were up‐ or down‐regulated in SMA microglia compared to controls. Dashed lines represent filter cutoff values for log two‐fold change of >1.5 (vertical) and FDR‐adjusted P value <.01 (horizontal). Transcripts with greater expression in SMA as compared with control are on the right of the plot (red dots). (c) Heat map of relative gene expression of select genes involved in cell migration, phagocytosis, and inflammation
FIGURE 5
FIGURE 5
Cell velocity is increased in SMA patient iPSC derived microglia compared to control. Velocity and persistence of control (n = 5; minimum of 14 cells per group) and SMA patient iPSC derived microglia (n = 5; minimum of 14 cells per group) was performed using video analysis over 16 h, with images taken every 10 min. (a) Velocity was significantly increased, **p = .0061. SMN levels were restored in SMA microglia (n = 3; minimum of 50 cells per group) and velocity and analyzed. Transiently expressing SMN restored the cell velocity of SMA microglia to control cell levels. ****p = <.0001. (b) No change in persistence was detected in SMA versus control microglia. Restoring SMN levels did not alter persistence. All groups were analyzed by unpaired t‐test. Values represent mean ± SEM. (c) Representative photomicrographs depicting unaffected and SMA iPSC‐derived microglia plated in a monolayer following a scratch wound. A single wound was administered, and cell chamber was imaged every 10 min for 16 h and (d) total area occupied by migrating cells and, (e) total distance covered over time (rate) was quantified using ImageJ. (area covered **p = .0024; rate **p = .0051). Significance was determined by one‐way ANOVA followed by post hoc Tukey's test for multiple comparisons. Values represent mean ± SEM
FIGURE 6
FIGURE 6
Phagocytosis is upregulated in SMA iPSC derived microglia compared to control. (a). Phagocytosis was analyzed by flow cytometry. (n = 6) ***p = .002. Gene expression analysis of (b) C1qa, (c) C3, and (d) TREM2 were determined by qRT‐PRC. (control n = 5, SMA n = 5) **p = .0058, ***p = .0008 (e) TREM2 was knocked down using siRNA (control n = 3, SMA n = 3) and gene knockdown validated by qRT‐PCR. (f) Phagocytosis of TREM2 knockdown (control n = 3, SMA n = 3) was analyzed by flow cytometry. *p = .0443, **p = .0073, ***p = .0005. All groups were analyzed by one‐way ANOVA followed by post hoc Tukey's test for multiple comparisons. Values represent mean ± SEM
FIGURE 7
FIGURE 7
SMA microglia alter motor neuron excitability. (a) SMN knockdown in iPSC motor neurons was validated by western blot (n = 3). Analyzed by t‐test, **p = .0087 (b) control and SMN knock down motor neurons were exposed for 24 h to conditioned media. Representative images of each group were taken. Yellow arrow indicates the motor neuron that was patched. White arrow denotes glass capillary used for recording and to inject dye for visualization. Scale bar = 50 μm. (c) Number of action potentials was recorded in control motor neurons (control motor neuron media n = 15, control microglia media n = 16, and SMA iPSC derived microglia conditioned media n = 8). **p = .0053. (d) Inward sodium current was recorded in control motor neurons exposed 24 h to conditioned media (control motor neuron media n = 15, control microglia media n = 16, and SMA microglia media n = 6). (e) Outward potassium current was recorded in control motor neurons exposed for 24 h to conditioned media (control motor neuron media n = 8, control microglia media n = 9, and SMA microglia media n = 9). (f) Number of action potentials were recorded in SMN knock down motor neurons (control motor neuron media n = 10, control microglia media n = 13, and SMA microglia media n = 13). **p = .0026. (g) Inward sodium current was recorded in SMN knock down motor neurons exposed to conditioned media for 24 h (control motor neuron media n = 10, control microglia media n = 12, and SMA iPSC derived microglia conditioned media n = 13). *p = .0205 (h) outward potassium current was recorded in SMN knockdown motor neurons exposed 24 h to conditioned media (control motor neuron media n = 10, control microglia media n = 13, and SMA microglia media n = 13). *p = .0213 **p = .0034. All groups analyzed by one‐way ANOVA. Values represent mean ± SEM
FIGURE 8
FIGURE 8
Motor neurons treated with SMA iPSC derived microglia conditioned media result in increased branching. Representative images and plot of Sholl analysis of motor neurons treated with microglia conditioned media. Total number of crossings was counted at start radius of 10 μm, with a step radius 10 μm. Branching was recorded up to 200 μm for all groups. Control motor neurons (a) and SMN deficient motor neurons (b) were treated for 24 h in control motor neuron media (green), unaffected iPSC derived microglia media (blue), and SMA iPSC derived microglia media (orange). Two‐way ANOVA was used followed by post hoc Bonferroni for multiple comparisons to analyze the Sholl plots between groups. Significance was determined when comparing unaffected iPSC derived microglia media to SMA iPSC derived microglia media. (a) *p = .0131, *p = .0108, ***p = <.001 (left to right). (b) **p = .0037, ***p = .0007, **p = .041, ***p = .0006, left to right. Values represent mean ± SEM

References

    1. Akten, B. , Kye, M. J. , Hao le, T. , Wertz, M. H. , Singh, S. , Nie, D. , & Sahin, M. (2011). Interaction of survival of motor neuron (SMN) and HuD proteins with mRNA cpg15 rescues motor neuron axonal deficits. Proceedings of the National Academy of Sciences of the United States of America, 108(25), 10337–10342. - PMC - PubMed
    1. Alliot, F. , Godin, I. , & Pessac, B. (1999). Microglia derive from progenitors, originating from the yolk sac, and which proliferate in the brain. Brain Research. Developmental Brain Research, 117(2), 145–152. - PubMed
    1. Ando, S. , Osanai, D. , Takahashi, K. , Nakamura, S. , Shimazawa, M. , & Hara, H. (2020). Survival motor neuron protein regulates oxidative stress and inflammatory response in microglia of the spinal cord in spinal muscular atrophy. Journal of Pharmacological Sciences, 144(4), 204–211. - PubMed
    1. Arumugam, S. , Garcera, A. , Soler, R. M. , & Tabares, L. (2017). Smn‐deficiency increases the intrinsic excitability of motoneurons. Frontiers in Cellular Neuroscience, 11, 269. - PMC - PubMed
    1. Blanquie, O. , & Bradke, F. (2018). Cytoskeleton dynamics in axon regeneration. Current Opinion in Neurobiology, 51, 60–69. - PubMed

Publication types

MeSH terms

Substances