

The HSP40 chaperone Ydj1 drives amyloid beta 42 toxicity
- PMID: 35373908
- PMCID: PMC9081910
- DOI: 10.15252/emmm.202113952
The HSP40 chaperone Ydj1 drives amyloid beta 42 toxicity
Abstract
Amyloid beta 42 (Abeta42) is the principal trigger of neurodegeneration during Alzheimer's disease (AD). However, the etiology of its noxious cellular effects remains elusive. In a combinatory genetic and proteomic approach using a yeast model to study aspects of intracellular Abeta42 toxicity, we here identify the HSP40 family member Ydj1, the yeast orthologue of human DnaJA1, as a crucial factor in Abeta42-mediated cell death. We demonstrate that Ydj1/DnaJA1 physically interacts with Abeta42 (in yeast and mouse), stabilizes Abeta42 oligomers, and mediates their translocation to mitochondria. Consequently, deletion of YDJ1 strongly reduces co-purification of Abeta42 with mitochondria and prevents Abeta42-induced mitochondria-dependent cell death. Consistently, purified DnaJ chaperone delays Abeta42 fibrillization in vitro, and heterologous expression of human DnaJA1 induces formation of Abeta42 oligomers and their deleterious translocation to mitochondria in vivo. Finally, downregulation of the Ydj1 fly homologue, Droj2, improves stress resistance, mitochondrial morphology, and memory performance in a Drosophila melanogaster AD model. These data reveal an unexpected and detrimental role for specific HSP40s in promoting hallmarks of Abeta42 toxicity.
Keywords: Alzheimer’s disease; HSP40; amyloid beta 42; heat shock proteins; oligomers.
© 2022 The Authors. Published under the terms of the CC BY 4.0 license.
Figures
- A
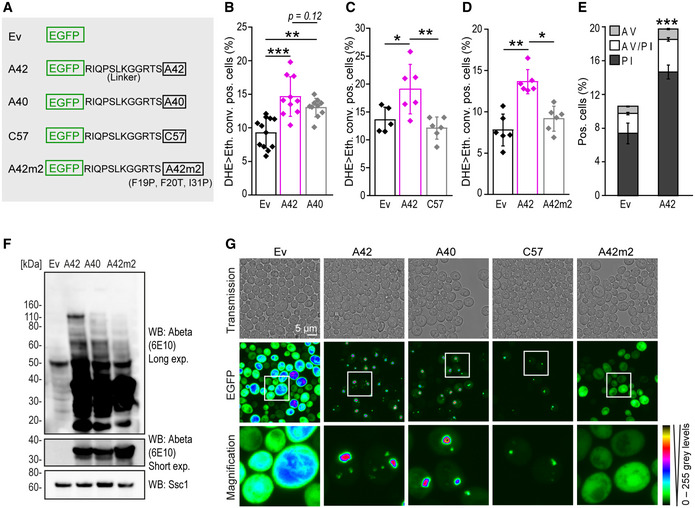
Schematic illustration of EGFP‐linker‐A42 fusion protein (A42) and corresponding controls: EGFP empty vector (ev), EGFP‐A40 (A40), EGFP‐C57 (C57), and EGFP‐A42m2 (A42m2) containing three‐point mutations as indicated.
- B–D
Flow cytometric quantification of DHE>Eth. positive wild‐type yeast cells (allowing the detection of both dead cells and cells exhibiting sub‐lethal oxidative stress) after 42 h (B) or 66 h (C, D) expressing Abeta constructs. Dot plots show all data points along with the mean (bar) ± SD n = 5–12 biologically independent cultures. ***P < 0.001, **P < 0.01, *P < 0.05. ANOVA with Tukey’s post hoc test.
- E
Annexin V (AV)/PI co‐staining to assess cell death in yeast‐expressing A42 after 48 h. Data represent means ± SD n = 6 biologically independent cultures. ***P < 0.001 (comparing PI positive populations). Unpaired, two‐tailed t‐test.
- F
Immunoblot of whole‐cell extract (WCE) of wild‐type yeast cells after 16 h expression of Abeta constructs. For western blot (WB) Abeta‐specific antibody (Abeta) 6E10 was used showing long (Long exp.) and short time exposure (Short exp.). Ssc1 was used as a loading control. See also Appendix Fig S1D.
- G
Confocal microscopy of wild‐type yeast cells after 18 h of Abeta expression. Colors indicate fluorescence intensity.

- A
Immunoblot of total cytoplasmic post‐nuclear supernatant (PNS), mitochondrial, microsomal, and cytosolic fractions of wild‐type yeast cells after 18 h expression of EGFP‐C57 (C57) using EGFP‐specific antibody (GFP). Purity of fractions was tested with antibodies against Tom22 (mitochondria) and Pgk1 (cytosol).
- B
Immunoblot of whole‐cell extract (WCE) of wild‐type (WT) yeast cells after 16 h of expression of EGFP‐A42. Samples were either kept at RT or heated to 95°C before loading on the SDS gel. Abeta‐specific antibody (Abeta) 6E10 and EGFP antibody (GFP) were used for immunoblotting. GAPDH was used as a loading control.
- C
Fluorescence microscopy of wild‐type (WT) yeast cells after 18 h of expression of EGFP‐A42 (A42) and co‐overexpressing Ydj1‐FLAG (Ydj1) or EGFP empty vector (ev). Mitochondria were visualized with MitoTracker Red (magenta).
- D, E
Quantification of DHE>Eth. positive cells at indicated time points during chronological aging of wild‐type (WT) cells and cells lacking mitochondrial DNA (Rho0), expressing EGFP‐A42 (A42) or EGFP only (ev). Mean ± SD n = 4–6 biologically independent cultures. P‐values by two‐way repeated measures ANOVA followed by simple main effects (***P < 0.001; **P < 0.01, versus control).
- F
Quantification of intensities of Ydj1‐specific antibody (Ydj1) bands of the immunoblot representatively shown in G and Appendix Fig S1B, normalized to intensities of Pgk1‐specific antibody bands (Pgk1). Dot plots show all data points along with the mean (line) ± SD n = 3 biologically independent cultures. **P < 0.01; *P < 0.05. ANOVA with Tukey’s post hoc test.
- G
Immunoblot of whole‐cell extract (WCE) of wild‐type yeast cells after 16 h of expression of EGFP‐A42. Pgk1 was used as a loading control. See also Appendix Fig S1B.
- H
Immunoblot of whole‐cell extract (WCE) of wild‐type and Δydj1 yeast cells after 16 h of expression of EGFP‐A42 and co‐overexpressing Ydj1‐FLAG (Ydj1) or harboring the corresponding vector controls. DnaJA1‐ and Abeta‐specific (6E10) antibodies were used for immunoblots. GAPDH was used as a loading control.
- I
Quantification of PI positive wild‐type (WT) and Δydj1 cells after 42 h of expressing alpha‐synuclein or harboring the empty vector control (ev). Dot plots show all data points along with the mean (bar) ± SD n = 6 biologically independent cultures. ***P < 0.001. ANOVA with Tukey’s post hoc test.
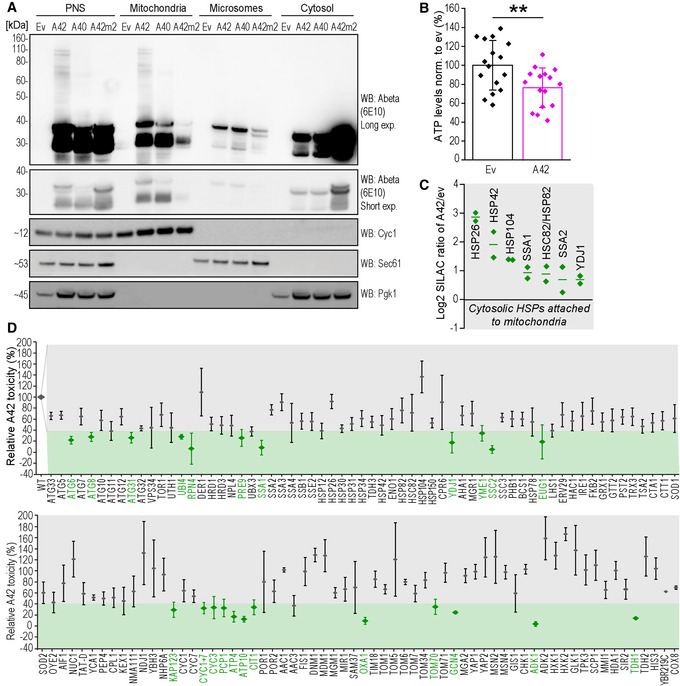
Immunoblot of total cytoplasmic post‐nuclear supernatant (PNS), mitochondrial, microsomal, and cytosolic fractions of wild‐type yeast cells after 18 h expression of EGFP‐Abeta42 (A42), EGFP‐Abeta40 (A40), and EGFP empty vector (ev) using Abeta‐specific antibody (Abeta) 6E10 with long (Long exp.) and short time exposure (Short exp.). Purity of fractions was tested with antibodies against Cyc1 (mitochondria), Sec61 (microsomes), and Pgk1 (cytosol).
Cellular ATP content of wild‐type yeast cells after 42 h expression of EGFP‐A42 (A42) or EGFP empty vector (ev). Dot plots show all data points along with the mean (bar) ± SD n = 16 biologically independent cultures. **P < 0.01. Unpaired, two‐tailed t‐test.
Relative protein abundance of EGFP‐Abeta42 (A42) versus empty vector (ev)‐expressing wild‐type yeast cells. The significant subset of cytosolic heat shock proteins (HSP) detected in a proteomics analysis of isolated mitochondria is depicted. Log2 SILAC ratios of A42/ev of two independent proteome measurements are shown. Dot plots show all data points along with the mean (line). Significance was determined using an outlier test (Significance A, P < 0.003). See also Appendix Table S3.
Screen of 123 deletion strains assessing Abeta42 (A42)‐induced toxicity (assessed by DHE>Eth. positive cells indicative of the sum of sub‐lethal oxidative stress and cell death) in yeast. Relative A42 toxicity normalized to wild‐type (WT) cells is depicted. Potential hits (mutants that reduce A42 toxicity) are shown in green. Data represent means ± SD n ≥ 3 biologically independent cultures. See methods section for details on screening and hit criteria.
- A, B
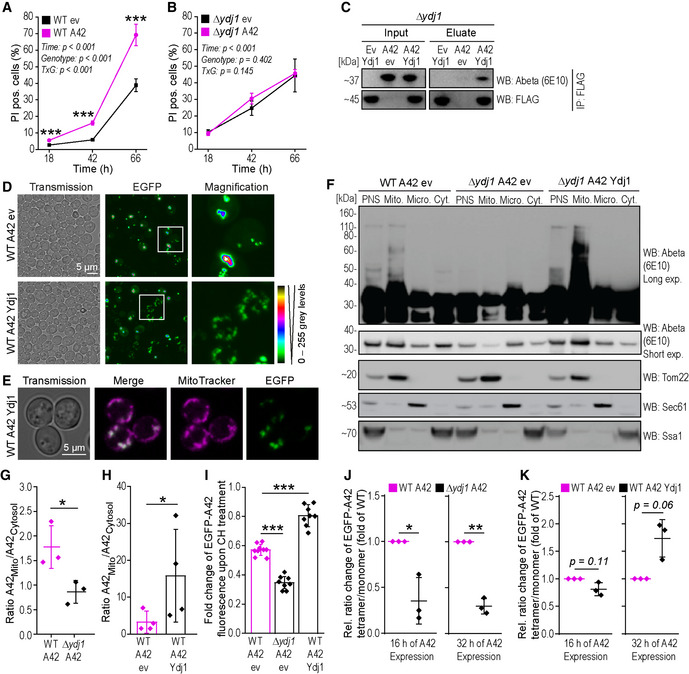
Quantification of cells positive for propidium iodide (PI)‐staining indicating cell death at indicated time points after start of expression of EGFP‐A42 (A42) or EGFP empty vector (ev) of wild‐type (WT) (A) and YDJ1‐deleted (Δydj1) cells (B). Mean ± SD n = 5 biologically independent cultures. Comparisons by two‐way ANOVA (mixed‐design) followed by simple main effects (***P < 0.001, versus control).
- C
Immunoblot (WB) of whole‐cell extract (Input) and eluate of FLAG‐tagged Ydj1. Immunoprecipitation (IP: FLAG) of YDJ1 deletion strain (Δydj1) cells expressing EGFP‐A42 (A42) or EGFP empty vector (ev) and co‐overexpressing Ydj1‐FLAG (Ydj1) using Abeta‐specific antibody (6E10) and FLAG antibody (FLAG).
- D
Confocal microscopy of wild‐type (WT) yeast cells expressing EGFP‐A42 (A42) only and co‐overexpressing Ydj1‐FLAG (Ydj1) or with the corresponding vector control after 18 h of expression. Colors indicate fluorescence intensity.
- E
Confocal microscopy of wild‐type (WT) yeast cells expressing EGFP‐A42 (A42) and co‐overexpressing Ydj1‐FLAG (Ydj1) after 18 h of expression. Mitochondria were visualized with MitoTracker Red (magenta). See also Figs EV2J and EV1C.
- F
Immunoblot (WB) of total cytoplasmic post‐nuclear supernatant (PNS), mitochondrial (Mito.), microsomal (Micro.), and cytosolic (Cyt.) fractions of wild‐type (WT) and YDJ1 deletion strain (Δydj1) cells after 18 h of expression of EGFP‐A42 (A42) and co‐overexpressing Ydj1‐FLAG (Ydj1) or corresponding empty vector controls (ev) using Abeta‐specific antibody (Abeta) 6E10 with long (Long exp.) and short time exposure (Short exp.). Tom22‐specific antibody is a marker for mitochondria, Sec61 for microsomes, and Ssa1 was used to verify cytosolic fraction.
- G, H
Ratio of full‐length EGFP‐A42 in the mitochondrial fraction / cytosolic fraction, using densitometry quantification of the immunoblot representatively shown in Fig 3F and Appendix Fig S1C from three or four independent experiments. Dot plots show all data points along with the mean (line/bar) ± SD n = 3–4 biologically independent cultures. *P < 0.05. Unpaired, two‐tailed t‐test.
- I
Assay for protein degradation using cycloheximide (CH) to stall protein translation. EGFP fluorescence intensity was measured at two time points (t0 and t2, 2 h after CH administration) and normalized to t0 in wild‐type (WT) and YDJ1 deletion strain (Δydj1) cells after 18 h of expression of EGFP‐A42 (A42) and co‐overexpressing Ydj1‐FLAG (Ydj1) or corresponding empty vector controls (ev). Dot plots show all data points along with the mean (bar) ± SD n = 8 biologically independent cultures. ***P < 0.001. ANOVA with Tukey’s post hoc. See also Appendix Fig S2C.
- J, K
Quantification of the ratio between EGFP‐A42 tetramer and monomer in wild‐type (WT) and YDJ1 deletion strain (Δydj1) expressing EGFP‐A42 (J) as well as between WT expressing EGFP‐A42 only and co‐overexpressing Ydj1‐FLAG (Ydj1) (K) at indicated time points. Dot plots show all data points along with the mean (line) ± SD n = 3(J) n = 3(K) biologically independent cultures. **P < 0.01; *P < 0.05. One sample t‐test against 1. See also Appendix Fig S2A and B.

- A, B
Quantification of PI positive cells at indicated time points during chronological aging of wild‐type (WT) (A) and Δydj1 (B) cells expressing Kar2‐A42 or harboring the empty vector control (ev). Mean ± SD n = 6 biologically independent cultures. P‐values by two‐way repeated measures ANOVA followed by simple main effects (***P < 0.001; **P < 0.01, versus control).
- C
Immunoblot of whole‐cell extract (WCE) of wild type (WT) after 16 h of expression of Kar2‐A42 and expressing Ydj1‐FLAG (Ydj1) or harboring the corresponding vector control (ev). Samples were either kept at RT or heated to 95°C before loading on the 4–12% NuPage Bis–Tris gel. Abeta‐specific antibody (Abeta) 6E10 was used for immunoblotting. GAPDH was used as a loading control.
- D
Quantification of the ratio between A42 low‐n oligomers and high‐n oligomers in wild‐type (WT) and YDJ1 deletion strain (Δydj1) expressing Kar2‐A42 as well as between wild‐type (WT) expressing Kar2‐A42 only or co‐overexpressing Ydj1‐FLAG (Ydj1) after 16 h of expression from immunoblots representatively shown in (C). Dot plots show all data points along with the mean (bar) ± SD n = 6 biologically independent cultures. ***P < 0.001. ANOVA with Tukey’s post hoc test.
- E
Immunoblot of total cytoplasmic post‐nuclear supernatant (PNS), mitochondrial, microsomal, and cytosolic fractions of wild‐type yeast cells after 18 h expression of Kar2‐Abeta42 (A42) and empty vector (ev) using Abeta‐specific antibody (WB: Abeta) 6E10. Purity of fractions was tested with antibodies against Tom22 (mitochondria), Sss1 (microsomes), and Pgk1 (cytosol).
- F, G
Quantification of PI positive cells at indicated time points during chronological aging of wild‐type (WT) cells expressing EGFP‐A42 or harboring the empty vector control (ev) upon treatment with Hsp70/Hsp40 interaction inhibitor 116‐9e (G) or corresponding DMSO control (F). Mean ± SD n = 6 biologically independent cultures. P‐values by two‐way repeated measures ANOVA followed by simple main effects (**P < 0.01; *P < 0.05, versus control).
- H
Immunoblot of whole‐cell extract (WCE), supernatant, and eluate of FLAG‐tagged Ydj1. Immunoprecipitation (IP: FLAG) of wild‐type (WT) cells expressing EGFP‐C57 (C57) or EGFP only (ev) and co‐overexpressing Ydj1‐FLAG (Ydj1) using EGFP antibody (GFP) and FLAG antibody (FLAG).
- I
Immunoblot of whole‐cell extract (WCE), eluate, and supernatant of FLAG‐tagged Ydj1. Immunoprecipitation (IP: FLAG) of wild‐type (WT) cells expressing EGFP‐A42 (A42), A42m2, or EGFP only (ev) and co‐overexpressing Ydj1‐FLAG (Ydj1) using Abeta‐specific antibody (Abeta) 6E10 and FLAG antibody (FLAG).
- J
Confocal microscopy of wild‐type (WT) yeast cells expression of EGFP‐A42 (A42) after 18 h of expression. Mitochondria were visualized with MitoTracker Red (magenta).

- A–D
Immunoblot of time series of whole‐cell extract (WCE) of wild‐type (WT) and YDJ1 deletion (Δydj1) cells expressing Ydj1 or harboring the corresponding empty vector control (ev) after indicated hours (h) of expression of EGFP‐A42 using Abeta‐specific antibody (Abeta) 6E10. Star* indicates the tetramer.
- E
Immunoblot of time series of Abeta42 expression in YDJ1 deletion (Δydj1) cells co‐expressing DnaJA1 after indicated hours (h) of expression of EGFP‐A42 using Abeta‐specific antibody (6E10). Star* indicates the tetramer.
- F
Quantification of DHE>Eth. positive wild type (WT) after 66 h of expressing EGFP‐A42 (A42) and Hsp104 or harboring the corresponding empty vector controls (ev). Dot plots show all data points along with the mean (bar) ± SD n = 12 biologically independent cultures. ***P < 0.001. ANOVA with Tukey’s post hoc test.
- G
Quantification of PI positive wild‐type (WT), Δydj1, Δhsp104, and Δydj1Δhsp104 cells after 66 h of expressing EGFP‐A42 (A42) or harboring the corresponding empty vector controls (ev). Dot plots show all data points along with the mean (bar) ± SD n = 6 biologically independent cultures. ***P < 0.001. ANOVA with Tukey’s post hoc test.
- H
Immunoblot of whole‐cell extract (WCE) of wild‐type (WT) yeast cells after 16 h of expression of EGFP‐A42 and Hsp104‐FLAG using FLAG antibody (FLAG) and corresponding vector controls (ev). The Hsp104‐FLAG is ~102 kDa. GAPDH is used as a loading control. Green star marks an unspecific band.
- I
Immunoblot of whole‐cell extract (WCE) of wild‐type and Δydj1 cells expressing EGFP‐A42 (A42), EGFP‐A42m2 (m2), or EGFP only (ev) using Hsp104‐specific antibody. Pgk1 is used as a loading control.
- A, B
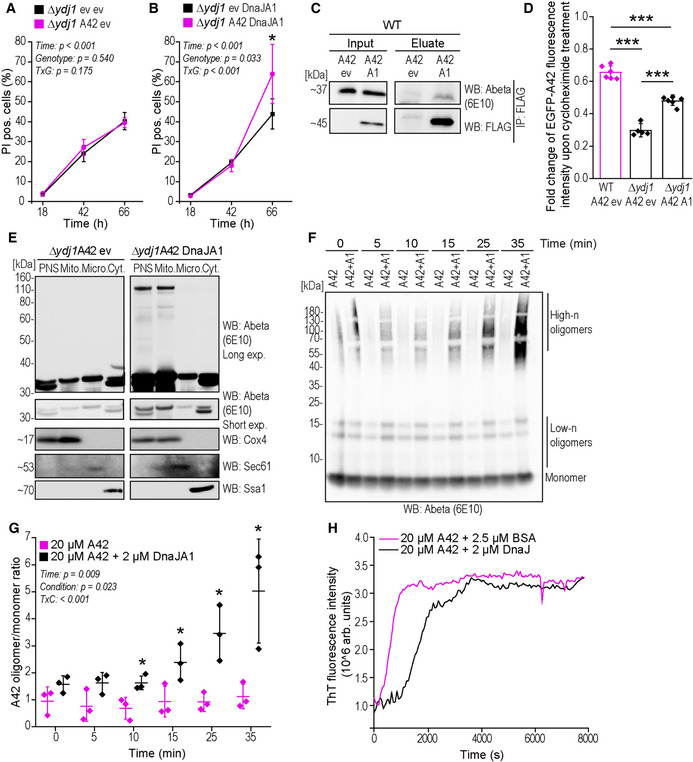
Quantification of propidium iodide (PI)‐staining positive cells indicating cell death at indicated time points of expression of EGFP‐A42 (A42) Δydj1 cells with co‐expression of DnaJA1‐FLAG (DnaJA1) (B) or corresponding empty vector controls (ev) (A). Mean ± SD n = 4–6 biologically independent cultures. Comparisons by two‐way ANOVA (mixed design) followed by simple main effects (*P < 0.05, versus control).
- C
Immunoblot (WB) of whole‐cell extract (Input) and eluate of FLAG‐tagged DnaJA1 immunoprecipitation (IP: FLAG) of wild‐type strain (WT) expressing EGFP‐A42 (A42) and co‐expressing DnaJA1‐FLAG (A1) using Abeta‐specific antibody (6E10) and FLAG antibody (FLAG).
- D
Assay for protein degradation using cycloheximide (CH) to stall protein translation. EGFP fluorescence intensity of YDJ1 deletion strain (Δydj1) and wild‐type (WT) cells expressing EGFP‐A42 (A42) only or co‐expressing DnaJA1‐FLAG (A1) was measured at two time points (t0 and t2, 2 h after CH administration) and normalized to t0. Dot plots show all data points along with the mean (bar) ± SD n = 6 biologically independent cultures. ***P < 0.001. ANOVA with Tukey’s post hoc test. See also Appendix Fig S2C.
- E
Immunoblot (WB) of total cytoplasmic post‐nuclear supernatant (PNS), mitochondrial (Mito.), microsomal (Micro.), and cytosolic (Cyt.) fractions of YDJ1‐deleted cells (Δydj1) after 18 h expression of EGFP‐A42 (A42) only or co‐expressing DnaJA1‐FLAG (DnaJA1) using Abeta‐specific antibody (Abeta) 6E10 with long (Long exp.) and short time (Short exp.) exposure (two sections from one immunoblot). Cox4‐specific antibody is a marker for mitochondria, Sec61 for microsomes and Ssa1 was used to verify cytosolic fraction.
- F
Representative immunoblot of synthetic Abeta42 oligomer formation monitored in vitro over the indicated time course with or without DnaJA1 (A1) and quantified by densitometry in (G).
- G
Quantification of the oligomer‐to‐monomer ratio of synthetic Abeta42 with or without DnaJA1 obtained from immunoblots representatively shown in (F). Dot plots show all data points along with the mean (line) ± SD n = 3 biologically independent cultures. P‐values by two‐way ANOVA (mixed design) followed by simple main effects (*P < 0.05, versus A42 control). See also Appendix Fig S2D.
- H
A42 beta‐sheet‐rich assembly formation monitored by increase in ThT fluorescence over time with BSA or with DnaJ. Data represent means of at least eight measurements. See also Appendix Fig S1E.

Immunoblot of cytosol‐enriched cerebral tissue homogenate (Input) and eluate of Abeta42 or DnaJA1 immunoprecipitation (IP) using Abeta‐specific antibody (6E10) and DnaJA1‐specific antibody (DnaJA1), respectively, showing optimal and long exposure (Long exp.). Immunoprecipitation was performed using magnetic beads without antibody, or with DnaJA1 or 6E10 antibody mixed with cytosol‐enriched brain homogenates obtained from female (15 months old) wild‐type (WT) or 3xTg (PS1M146V/APPSwe/tauP301L) mice. Sections showing monomer and low‐n oligomers (low‐n oligo), dodecamer, and full‐length amyloid precursor protein (APP) are from one immunoblot.
Representative immunoblot (WB) of DnaJA1 levels from the hippocampi of AD patients (AD) and aged non‐demented controls (ctrl). Ponceau S served as a loading control.
Quantification by densitometry of DnaJA1 normalized to Ponceau S from the hippocampi of AD patients (AD) and aged non‐demented controls (ctrl). Representative immunoblot is shown in (B). Dot plots show all data points along with the mean (bar) ± SD n = 4–5 independent patients. *P < 0.05. Unpaired, two‐tailed t‐test.
- A, B
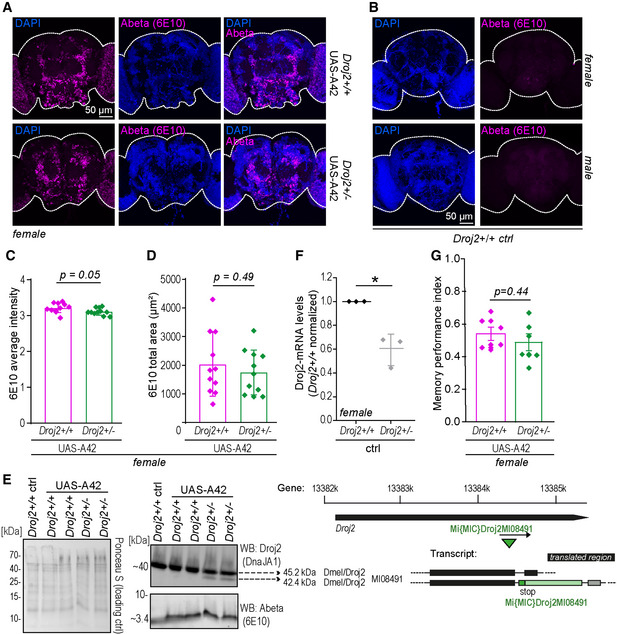
Representative confocal microscopy of (A) 10‐day‐old female fly brains immunostained with Abeta‐specific antibody (Abeta) (6E10) (magenta) and reference DNA staining with DAPI (blue) of Droj2 knockdown flies (Droj2 +/−) and corresponding isogenic w1118 wild‐type flies (Droj2 +/+) expressing human Abeta42 (UAS‐A42). (B) 10‐day‐old female and male fly brains immunostained with Abeta‐specific antibody (Abeta) (6E10) (red) and reference DNA staining with DAPI (blue) of corresponding isogenic w1118 wild‐type control flies (Droj2 +/+ ctrl) not expressing human Abeta42.
- C, D
Average intensity (C) and total area (D) of Abeta (6E10) signal from fly brain confocal images representatively shown in Fig EV4A from 12 brains of w1118 wild‐type (Droj2 +/+) and knockdown (Droj2 +/−) female flies. Dot plots show all data points along with the mean (bar) ± SD n = 12. Unpaired, two‐tailed t‐test.
- E
Fly Droj2 is recognized by specific antibody of the human homologue DnaJA1. Immunoblot analysis of fly heads using DnaJA1‐specific antibody (DnaJA1) and Abeta‐specific antibody (6E10) of 3‐ to 6‐day‐old Droj2 knockdown flies (Droj2 +/−) and corresponding isogenic w1118 wild‐type flies (Droj2 +/+) with expression of human Abeta42 (UAS‐A42) or without, control (ctrl). Ponceau S was used as a loading control. Scheme of the Droj2 locus with the position of the Mi{MIC}Droj2MI08491 transposon. In the transcript, black rectangles indicate translated regions, lines indicate introns, and dashed lines indicate untranslated regions. Data are adopted from FlyBase.
- F
qPCR analysis of Droj2‐mRNA levels of 3‐ to 6‐day‐old Droj2 knockdown female flies (Droj2 +/−) without expressing human Abeta42 (ctrl) normalized to corresponding isogenic w1118 wild‐type flies (Droj2 +/+). Reference gene is Rpl32. Dot plots show all data points along with the mean (line) ± SD n = 3 biologically independent experiments. *P < 0.05. One sample t‐test against 1.
- G
Aversive associative memory performance 2 min after training of aged (18 days old) female Droj2 knockdown flies (Droj2 +/−) and corresponding isogenic w1118 wild‐type flies (Droj2 +/+) both expressing human Abeta42 (UAS‐A42) of six independent biological replicates. Dot plots show all data points along with the mean (bar) ± SD n = 6. Unpaired, two‐tailed t‐test.
- A
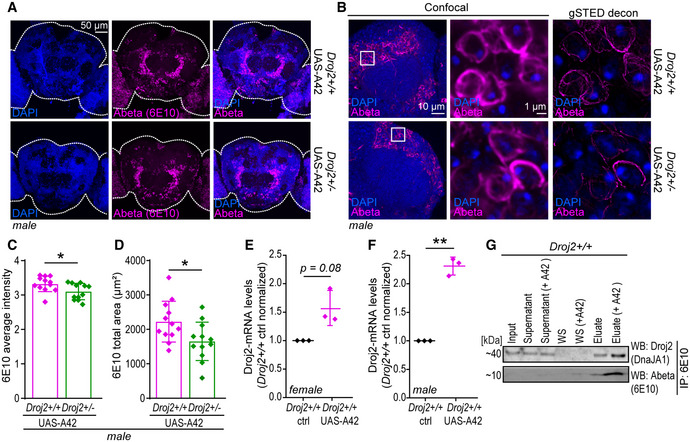
Representative confocal microscopy of 10‐day‐old male fly brains immunostained with Abeta‐specific antibody (Abeta) 6E10 (magenta) and reference nuclei staining with DAPI (blue) of Droj2 knockdown flies (Droj2 +/−) and corresponding isogenic w1118 wild‐type flies (Droj2 +/+) expressing human Abeta42 (UAS‐A42). See also Fig EV4A and B.
- B
Representative confocal and gSTED deconvolved (decon) images of Kenyon cells in 18‐day‐old male fly brains immunostained with Abeta‐specific antibody (Abeta) 6E10 (magenta) and reference nuclei staining with DAPI (blue) of Droj2 knockdown flies (Droj2 +/−) and corresponding isogenic w1118 wild‐type flies (Droj2 +/+) expressing human Abeta42 (UAS‐A42).
- C, D
Average intensity (C) and total area (D) of Abeta (6E10) signal from confocal images representatively shown in (A) from 12 brains of w1118 wild‐type (Droj2 +/+) and knockdown (Droj2 +/−) 10‐day‐old male flies. Dot plots show all data points along with the mean (bar) ± SD n = 12. *P < 0.05. Unpaired, two‐tailed t‐test. See also Fig EV4C and D.
- E, F
qPCR analysis of Droj2‐mRNA levels of 3‐ to 6‐day‐old female (E) and male (F) flies expressing human Abeta42 (UAS‐A42) of w1118 wild‐type flies (Droj2 +/+) normalized to corresponding isogenic w1118 wild‐type flies without Abeta42 expression (Droj2 +/+ ctrl). Reference gene is Rpl32. Dot plots show all data points along with the mean (line) ± SD n = 3. **P < 0.01. One sample t‐test against 1.
- G
Immunoprecipitation (IP: 6E10) of synthetic Abeta42 added to the fly head extract of w1118 wild‐type (Droj2+/+ ) flies (Input). Abeta‐specific antibody 6E10 was used for Abeta42‐ and DnaJA1‐specific antibody for Droj2 immunoblot (WB) detection. Showing input, supernatant, supernatant after washing step (WS), and eluate. See also Fig EV4E.

- A, B
Survival of female (A) and male (B) w1118 wild‐type flies (Droj2 +/+) and Droj2 knockdown flies (Droj2 +/−) with expression of human Abeta42 (UAS‐A42) or control flies without expression (ctrl), upon supplementation of sugar (10% sucrose) with 20 mM MnCl2. Survival was determined at indicated time points. n = 6 with 100–120 flies per experiment. The indicated P‐value refers to the interaction (int.) term of a Cox proportional hazards model comparing Abeta42 toxicity (UAS‐A42 versus ctrl) and Droj2 expression (Droj2 +/+ versus Droj2 +/−) as main factors. The following pairwise comparisons of the indicated groups survival were done by log rank test (****P < 0.0001; ns, P > 0.05). See also Appendix Fig S1I–K.
- C
Aversive associative memory performance 2 min after training of aged (18 days old) male Droj2 knockdown flies (Droj2 +/−) and corresponding isogenic w1118 wild‐type flies (Droj2 +/+) both expressing human Abeta42 (UAS‐A42) of six independent biological replicates. Dot plots show all data points along with the mean (bar) ± SD n = 6. *P < 0.05. Unpaired, two‐tailed t‐test. See also Fig EV4G.
- D
Representative gSTED deconvolved images of Kenyon cells in 15‐day‐old male fly brains immunostained with Abeta‐specific antibody (Abeta) 6E10 (magenta) and mitochondrial marker ATP5A‐specific antibody (ATP5A, green) of Droj2 knockdown flies (Droj2 +/−) and corresponding isogenic w1118 wild‐type flies (Droj2 +/+) expressing human Abeta42 (UAS‐A42).
- E, F
Solidity (E) and circularity (F) normalized to corresponding wild‐type Droj2+/+ control (without Abeta42 expression, dashed line) of ATP5A‐stained mitochondria from fly brain gSTED deconvolved images representatively shown in (D) from 8 to 10 brains of w1118 wild‐type (Droj2 +/+) and knockdown (Droj2 +/−) 15‐day‐old male flies expressing human Abeta42 (UAS‐A42). Dot plots show all data points along with the mean (bar) ± SD n = 8–10. *P < 0.05. Unpaired, two‐tailed t‐test. See also Fig EV5D–H.
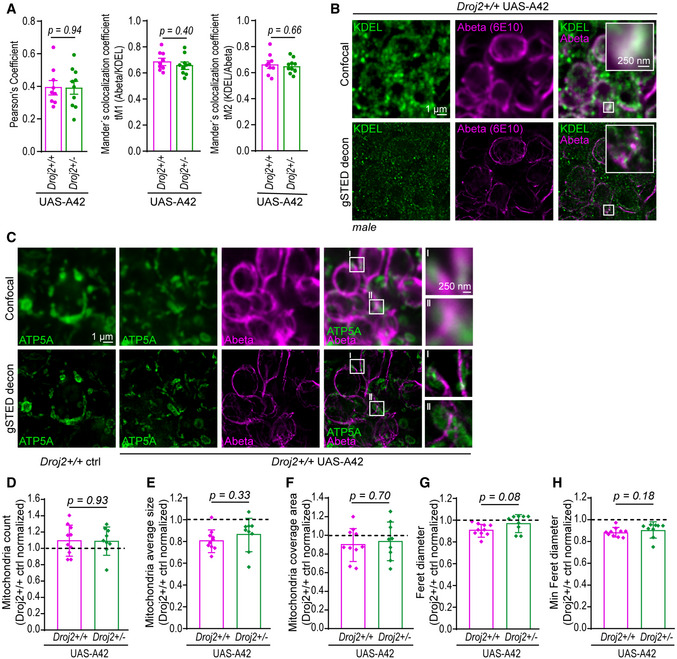
- A
Pearson’s correlation coefficient and Manders’ co‐localization Coefficients of endoplasmatic reticulum protein KDEL and Abeta analyzed on confocal images of Kenyon cells in 15‐day‐old male fly brains immunostained with Abeta‐specific antibody (Abeta) 6E10 and KDEL‐specific antibody in Droj2 knockdown flies (Droj2 +/−) and corresponding isogenic w1118 wild‐type flies (Droj2 +/+) with expression of human Abeta42 (UAS‐A42). Dot plots show all data points along with the mean (bar) ± SD n = 10. Unpaired, two‐tailed t‐test.
- B
Representative confocal and gSTED deconvolved (decon) images of Kenyon cells in 15‐day‐old male fly brains immunostained with Abeta‐specific antibody (Abeta) 6E10 (magenta) and endoplasmic reticulum protein KDEL‐specific antibody (KDEL, green) of Droj2 knockdown flies (Droj2 +/−) and corresponding isogenic w1118 wild‐type flies (Droj2 +/+) expressing human Abeta42 (UAS‐A42).
- C
Representative confocal and gSTED deconvolved (decon) microscopy of Kenyon cells in 15‐day‐old male fly brains immunostained with Abeta‐specific antibody (Abeta) 6E10 (magenta) and mitochondrial marker ATP5A‐specific antibody (ATP5A, green) of w1118 wild‐type flies (Droj2 +/+) expressing human Abeta42 (UAS‐A42).
- D–H
Counts of mitochondria (D), mitochondria average size (E), mitochondria coverage area (F), Feret diameter (G), and min Feret diameter (H) of ATP5A‐stained mitochondria from fly brain gSTED deconvolved images representatively shown in Fig 7C from 9 to 10 brains of w1118 wild‐type (Droj2 +/+) and knockdown (Droj2 +/−) male flies expressing human Abeta42 (UAS‐A42). Dot plots show all data points along with the mean (bar) ± SD n = 9–10. Unpaired, two‐tailed t‐test or Mann–Whitney test.
Comment in
-
A pathological role of the Hsp40 protein Ydj1/DnaJA1 in models of Alzheimer's disease.Cell Stress. 2022 May 9;6(5):61-64. doi: 10.15698/cst2022.05.267. eCollection 2022 May. Cell Stress. 2022. PMID: 36448030 Free PMC article.
References
-
- Bobba A, Amadoro G, Valenti D, Corsetti V, Lassandro R, Atlante A (2013) Mitochondrial respiratory chain Complexes I and IV are impaired by β‐amyloid via direct interaction and through Complex I‐dependent ROS production, respectively. Mitochondrion 13: 298–311 - PubMed
Publication types
MeSH terms
Substances
Grants and funding
LinkOut - more resources
Full Text Sources
Medical
Molecular Biology Databases
