. 2022 Apr 4:11:e77274.
doi: 10.7554/eLife.77274.

Pinpointing the tumor-specific T cells via TCR clusters

Affiliations

Pinpointing the tumor-specific T cells via TCR clusters

Mikhail M Goncharov et al. Elife. .

Abstract

Adoptive cell transfer (ACT) is a promising approach to cancer immunotherapy, but its efficiency fundamentally depends on the extent of tumor-specific T cell enrichment within the graft. This can be estimated via activation with identifiable neoantigens, tumor-associated antigens (TAAs), or living or lysed tumor cells, but these approaches remain laborious, time-consuming, and functionally limited, hampering clinical development of ACT. Here, we demonstrate that homology cluster analysis of T cell receptor (TCR) repertoires efficiently identifies tumor-reactive TCRs allowing to: (1) detect their presence within the pool of tumor-infiltrating lymphocytes (TILs); (2) optimize TIL culturing conditions, with IL-2low/IL-21/anti-PD-1 combination showing increased efficiency; (3) investigate surface marker-based enrichment for tumor-targeting T cells in freshly isolated TILs (enrichment confirmed for CD4+ and CD8+ PD-1+/CD39+ subsets), or re-stimulated TILs (informs on enrichment in 4-1BB-sorted cells). We believe that this approach to the rapid assessment of tumor-specific TCR enrichment should accelerate T cell therapy development.

Keywords: PD-1+/CD39+; T cell receptor repertoires; TCR clusters; cancer immunotherapy; human; immunology; inflammation; tumor-associated antigens; tumor-infiltrating lymphocytes.


Conflict of interest statement

MG, EB, NS, VS, AB, GS, VK, MV, IS, LD, SL, DC, ES No competing interests declared

Figures

Figure 1.
Figure 1.. Melanoma tumor-infiltrating lymphocyte (TIL) T cell receptor (TCR) clusters before and after immunotherapy.
(a, b) Normalized counts of cluster-related TCRβ clonotypes from metastatic melanoma samples before and after anti-PD-1 therapy from datasets published in (a) (Riaz et al., 2017) and (b) (Tumeh et al., 2014). (c) Cumulative frequency of VDJdb-matched tumor-associated antigen (TAA)-specific clonotypes within the whole repertoire (in bulk) and within cluster-related clonotypes (ALICE hits) of patients that have at least one VDJdb-matched cluster (N = 8 patients) from the two published datasets. (d) TCRβ clusters from patient pt44 (Riaz et al., 2017). Each dot represents individual TCRβ clonotype. Dot size is proportional to the clonotype frequency in the bulk TCRβ repertoire. VDJdb-matched TAA-specific clonotypes are colored in red. (e, f) TCRβ clusters before and after therapy for each patient from (e) (Riaz et al., 2017) and (f) (Tumeh et al., 2014). One dot corresponds to one cluster. Y axis shows the size of corresponding clusters (e.g. cumulative frequency of clonotypes within a cluster, % of the whole repertoire). VDJdb-matched TAA-specific clusters are colored in red. N = number of biological replicates in each group. Data in (a) were analyzed with paired t-test; b, c were analyzed with the Wilcoxon test.
Figure 2.
Figure 2.. T cell receptor (TCR) clusters in CD39+PD1+ tumor-infiltrating lymphocytes (TILs).
(a) The experimental workflow. (b–g) TCRβ repertoire analysis for CD8+ (b, d, f) and CD4+ (c, e, g) double-positive (DP) and non-DP TIL subsets sorted from metastatic lymph nodes of eight melanoma patients. Panels show repertoire clonality calculated as [1 − Normalized Shannon-Wiener index] (b, c), normalized counts (d, e), and cumulative frequency of cluster-related clonotypes, that is, total weight of all clusters as a proportion of TCRβ repertoire (f, g). Paired t-test. (h) TCRβ clusters identified in repertoires obtained from fresh-frozen tumor (FFT) samples, and sorted CD8+ DP and non-DP TILs for HLA-A*02 patient mp26. VDJdb-matched TAA-specific clusters are colored in red. ( i, j) Cumulative frequency of (i) VDJdb-matched TAA-specific clonotypes and (j) VDJdb-matched TAA-specific cluster-related clonotypes within CD8+ DP, CD8+ non-DP, and FFT TCRβ repertoires of patient mp26. One-way ANOVA, Bonferroni multiple comparisons correction. (k, l) Proportion of CD137+ cells among CD8+ T cells (k) and proportion of VDJdb-matched TAA-specific clonotypes in sorted CD137+CD8+ T cells (l) in DP and non-DP TILs from patient mp26 that were cultured and re-stimulated with TAA-loaded or control dendritic cells.
Figure 2—figure supplement 1.
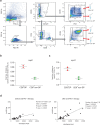
Figure 2—figure supplement 1.. (a) Fluorescence-activated cell sorting (FACS) gating for sorting of CD8+ and CD4+ CD39+PD-1+ double-positive (DP) and non-DP T cells from briefly cultured melanoma tumor-infiltrating lymphocytes (TILs) and single-cell suspensions prepared from tumor samples (b,c).
Cumulative frequency of cluster-related Melan-A-specific T cell receptors (TCRs) (b) and all Melan-A-specific TCRs (c) in CD8+ DP and CD8+ non-DP TIL repertoires from patient mp41. (d) Number of ALICE hits significantly correlates with the number of input clonotypes. TCR repertoires of melanoma TILs before and after anti-PD-1 immunotherapy were used for the analysis (public datasets from Riaz et al., 2017; Tumeh et al., 2014).
Figure 2—figure supplement 2.
Figure 2—figure supplement 2.. Characteristics of sorted tumor-infiltrating lymphocytes (TILs).
(a) Fraction of CD8+ and CD4+ cells out of all tumor-infiltrating CD3+T cells. (b) Fraction of CD39+PD-1+ cells consisting of CD8+ and CD4+ TILs. (c, d) Clonality (calculated as [1 − Normalized Shannon-Wiener index]) of CD8+ and CD4+ (c) doube-positive (DP) and (d) non-DP TILs. N = number of tested patients. Data analyzed by paired t-test.
Figure 3.
Figure 3.. Influence of culture conditions on tumor-infiltrating lymphocytes (TILs) and T cell receptor (TCR) clusters.
(a) Combined TCRβ clusters for fresh-frozen tumor (FFT), CD8+ double-positive (DP), CD8+ non-DP, and TILs cultured in four different conditions from metastatic tumor sample of patient mp26. Left: colors indicate VDJdb-defined clonotype specificities. Right: colors indicate the sample of origin. (b–e) TCRβ repertoire analysis for patient mp26 TILs cultured in four distinct conditions. Panels show (b) normalized counts of cluster-related TCRβ clonotypes, (c) proportion of the repertoire occupied by Melan-A-specific TCRβ clusters, (d) count and subset matching of clonotypes preferentially expanded compared to the IL-2high condition, and (e) the count of CD8+ DP matched clonotypes among the top 1500 clonotypes. N = number of separate tumor fragments. (f) Fraction of regulatory T cells (Tregs) (CD25+CD127-FoxP3+) among CD4+ T cells in cultured TILs from patient mp41 in each culture condition. (g) TIL counts relative to IL-2high culture conditions; n = 4 patients. (h) CD8+/CD4+ ratio for TILs from patient mp41 in each culture condition. Data in b ,c, f, g were analyzed with one-way ANOVA, Bonferroni multiple comparisons correction, with each condition compared to the IL-21/IL-2low/anti-PD-1 condition. Data in the panel (e) was analyzed with Kruskal-Wallis test, Dunn’s multiple comparison test, with each group compared to IL-21/IL-2low/anti-PD-1.
Figure 3—figure supplement 1.
Figure 3—figure supplement 1.. Expansion of tumor-infiltrating lymphocyte (TIL) subtypes in different cultivation conditions.
(a) Experimental pipeline for evaluating CD39+PD-1+ T cell clonotypes expansion from bulk melanoma TILs cultivated in different conditions. (b) Number of T cell receptor (TCR) clonotypes preferentially expanded in bulk TILs of patient mp34 under various culture conditions compared to classical IL-2high conditions. (c, d) Fraction of regulatory T cells (Tregs) (gated as CD4+CD25+CD127-FoxP3+) among CD4+ T cells of patients (c) mp42 and (d) mp32. (e, f) Proportion of CD127highCD25low cells among (e) CD4+ and (f) CD8+ TIL subsets from patient mp41. Data in c, e, f analyzed by one-way ANOVA, Bonferroni’s multiple comparisons test.
Author response image 1.
Author response image 2.
Author response image 3.
Author response image 4.

References

    1. Adeegbe DO, Nishikawa H. Natural and induced T regulatory cells in cancer. Frontiers in Immunology. 2013;4:190. doi: 10.3389/fimmu.2013.00190. - DOI - PMC - PubMed
    1. Alanio C, Lemaitre F, Law HKW, Hasan M, Albert ML. Enumeration of human antigen-specific naive CD8+ T cells reveals conserved precursor frequencies. Blood. 2010;115:3718–3725. doi: 10.1182/blood-2009-10-251124. - DOI - PubMed
    1. Allard E-L, Hardy M-P, Leignadier J, Marquis M, Rooney J, Lehoux D, Labrecque N. Overexpression of IL-21 promotes massive CD8+ memory T cell accumulation. European Journal of Immunology. 2007;37:3069–3077. doi: 10.1002/eji.200637017. - DOI - PubMed
    1. Bacher P, Heinrich F, Stervbo U, Nienen M, Vahldieck M, Iwert C, Vogt K, Kollet J, Babel N, Sawitzki B, Schwarz C, Bereswill S, Heimesaat MM, Heine G, Gadermaier G, Asam C, Assenmacher M, Kniemeyer O, Brakhage AA, Ferreira F, Wallner M, Worm M, Scheffold A. Regulatory T Cell Specificity Directs Tolerance versus Allergy against Aeroantigens in Humans. Cell. 2016;167:1067–1078. doi: 10.1016/j.cell.2016.09.050. - DOI - PubMed
    1. Bagaev DV, Vroomans RMA, Samir J, Stervbo U, Rius C, Dolton G, Greenshields-Watson A, Attaf M, Egorov ES, Zvyagin IV, Babel N, Cole DK, Godkin AJ, Sewell AK, Kesmir C, Chudakov DM, Luciani F, Shugay M. VDJdb in 2019: database extension, new analysis infrastructure and a T-cell receptor motif compendium. Nucleic Acids Research. 2020;48:D1057–D1062. doi: 10.1093/nar/gkz874. - DOI - PMC - PubMed

Publication types

MeSH terms

Substances