. 2022 Sep 1;144(9):091011.
doi: 10.1115/1.4054236.

A New Method for Quantifying Abdominal Aortic Wall Shear Stress Using Phase Contrast Magnetic Resonance Imaging and the Womersley Solution

Affiliations

A New Method for Quantifying Abdominal Aortic Wall Shear Stress Using Phase Contrast Magnetic Resonance Imaging and the Womersley Solution

Elizabeth Iffrig et al. J Biomech Eng. .

Abstract

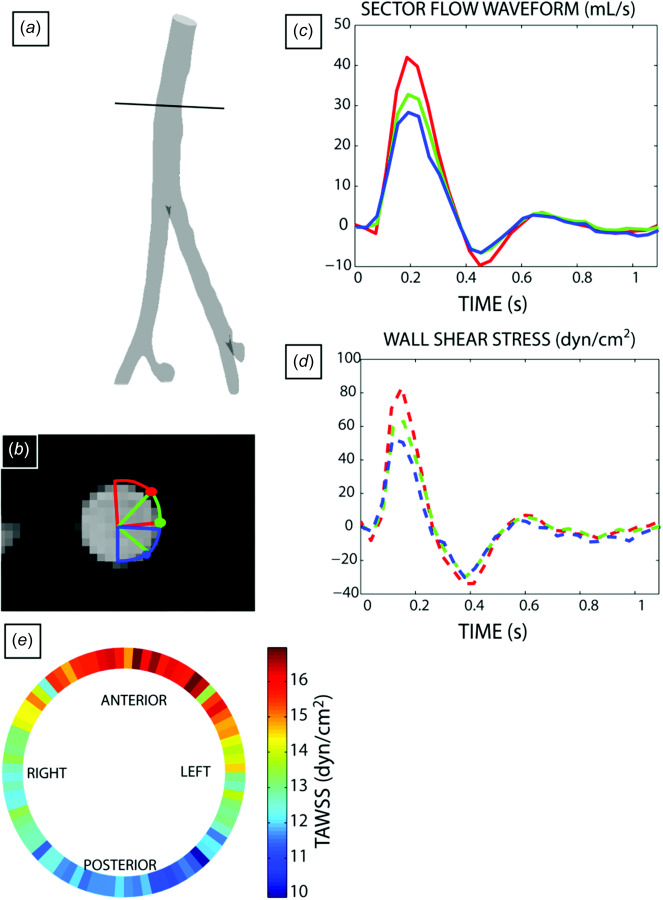
Wall shear stress (WSS) is an important mediator of cardiovascular pathologies and there is a need for its reliable evaluation as a potential prognostic indicator. The purpose of this work was to develop a method that quantifies WSS from two-dimensional (2D) phase contrast magnetic resonance (PCMR) imaging derived flow waveforms, apply this method to PCMR data acquired in the abdominal aorta of healthy volunteers, and to compare PCMR-derived WSS values to values predicted from a computational fluid dynamics (CFD) simulation. The method uses PCMR-derived flow versus time waveforms constrained by the Womersley solution for pulsatile flow in a cylindrical tube. The method was evaluated for sensitivity to input parameters, intrastudy repeatability and was compared with results from a patient-specific CFD simulation. 2D-PCMR data were acquired in the aortas of healthy men (n = 12) and women (n = 15) and time-averaged WSS (TAWSS) was compared. Agreement was observed when comparing TAWSS between CFD and the PCMR flow-based method with a correlation coefficient of 0.88 (CFD: 15.0 ± 1.9 versus MRI: 13.5 ± 2.4 dyn/cm2) though comparison of WSS values between the PCMR-based method and CFD predictions indicate that the PCMR method underestimated instantaneous WSS by 3.7 ± 7.6 dyn/cm2. We found no significant difference in TAWSS magnitude between the sexes; 8.19 ± 2.25 versus 8.07 ± 1.71 dyn/cm2, p = 0.16 for men and women, respectively.

Keywords: MRI; abdominal aortic aneurysm; biomechanics; cardiovascular risk; phase contrast magnetic resonance (PCMR); sex.


Figures

Explanation of wall shear stress calculation. (a) The dotted line indicates the PCMR image location in the abdominal aorta. (b) Representative magnitude image from the PCMR data with three unique sectors in red, green, and blue. Filled circles define the location to where WSS values are mapped for regional analysis. (c) Flow waveforms as a function of time calculated from each of the three colored sectors defined in (b). (d) WSS waveforms obtained from each of these sectors using the Womersely solution. (e) Circumferentially resolved map of TAWSS for indicated PCMR image position.
Fig. 1
Explanation of wall shear stress calculation. (a) The dotted line indicates the PCMR image location in the abdominal aorta. (b) Representative magnitude image from the PCMR data with three unique sectors in red, green, and blue. Filled circles define the location to where WSS values are mapped for regional analysis. (c) Flow waveforms as a function of time calculated from each of the three colored sectors defined in (b). (d) WSS waveforms obtained from each of these sectors using the Womersely solution. (e) Circumferentially resolved map of TAWSS for indicated PCMR image position.
Radius sensitivity. (a) For a given image from our PCMRI acquisitions, the original contour calculated from Segment is shown in blue. The red and green solid lines show the contours created by imposing a decrease of the contour area by 5% and 10%, respectively. The red and green dashed lines show the contours created by imposing a 5% and 10% increase, respectively. (b) For the yellow diamond in (a), we show the WSS waves calculated for each of the conditions with the same color scheme as in (a). (c) A comparison of the values obtained from the original contour (x-axis) with those calculated from each of the imposed areas (y).
Fig. 2
Radius sensitivity. (a) For a given image from our PCMRI acquisitions, the original contour calculated from Segment is shown in blue. The red and green solid lines show the contours created by imposing a decrease of the contour area by 5% and 10%, respectively. The red and green dashed lines show the contours created by imposing a 5% and 10% increase, respectively. (b) For the yellow diamond in (a), we show the WSS waves calculated for each of the conditions with the same color scheme as in (a). (c) A comparison of the values obtained from the original contour (x-axis) with those calculated from each of the imposed areas (y).
Explanation of partial volume calculation. The red contour identifies the vessel boundary at this time point. In our method, the green highlighted pixel has more than 50% of its area inside the contour and thus would be included in the flow calculation while the blue pixel would not. In the lower right image, we highlight the partial area of the pixel included in the sector to be used for flow quantification.
Fig. 3
Explanation of partial volume calculation. The red contour identifies the vessel boundary at this time point. In our method, the green highlighted pixel has more than 50% of its area inside the contour and thus would be included in the flow calculation while the blue pixel would not. In the lower right image, we highlight the partial area of the pixel included in the sector to be used for flow quantification.
Sector number and opening angle effect on TAWSS. (a) Circumferential variation of calculated TAWSS for 80 sectors using an opening angle of 90 deg, 60 deg, 45 deg, and 30 deg. (b) Absolute difference in time averaged TAWSS between the results using 80 sectors with an opening angle of 90 deg compared with 60 deg, 45 deg, and 30 deg for 40 locations around the circumference.
Fig. 4
Sector number and opening angle effect on TAWSS. (a) Circumferential variation of calculated TAWSS for 80 sectors using an opening angle of 90 deg, 60 deg, 45 deg, and 30 deg. (b) Absolute difference in time averaged TAWSS between the results using 80 sectors with an opening angle of 90 deg compared with 60 deg, 45 deg, and 30 deg for 40 locations around the circumference.
Repeatability results. (a) Results of our repeatability study are represented in which the first study's WSS values on the x-axis and the temporally and spatially matched values from the repeated study on the y-axis. (b) Bland Altman plot of the results of our repeated study measurements.
Fig. 5
Repeatability results. (a) Results of our repeatability study are represented in which the first study's WSS values on the x-axis and the temporally and spatially matched values from the repeated study on the y-axis. (b) Bland Altman plot of the results of our repeated study measurements.
CFD results (a) TAWSS results of the CFD simulation with the PCMR locations used for comparison at the dotted lines. (b) Representative instantaneous WSS profiles from the CFD simulation and our PCMR-based method at the same circumferential location indicated by the midaorta slice in (a). (c) Results of Bland Altman analysis showing the average bias and range from the CFD simulation and PCMR-based method.
Fig. 6
CFD results (a) TAWSS results of the CFD simulation with the PCMR locations used for comparison at the dotted lines. (b) Representative instantaneous WSS profiles from the CFD simulation and our PCMR-based method at the same circumferential location indicated by the midaorta slice in (a). (c) Results of Bland Altman analysis showing the average bias and range from the CFD simulation and PCMR-based method.
WSS Comparison between men and women. (a) Pooled results for time-averaged WSS magnitudes around the vessel circumference for men and women at the midpoint of the abdominal aorta. The unfilled dot corresponds to the average circumferential position site of lowest TAWSS and the bas indicate one standard deviation in either direction. L, R, A, and P correspond to anatomical position left, right, anterior and posterior, respectively. (b) Circumferentially resolved average peak systolic WSS values for men (blue) and women (red). (c) Circumferentially resolved average minimum WSS values with standard deviation bars for men and women.
Fig. 7
WSS Comparison between men and women. (a) Pooled results for time-averaged WSS magnitudes around the vessel circumference for men and women at the midpoint of the abdominal aorta. The unfilled dot corresponds to the average circumferential position site of lowest TAWSS and the bas indicate one standard deviation in either direction. L, R, A, and P correspond to anatomical position left, right, anterior and posterior, respectively. (b) Circumferentially resolved average peak systolic WSS values for men (blue) and women (red). (c) Circumferentially resolved average minimum WSS values with standard deviation bars for men and women.

Similar articles

Cited by

References

    1. Brooks, A. , Lelkes, P. , and Rubanyi, G. , 2002, “ Gene Expression Profiling of Human Aortic Endothelial Cells Exposed to Disturbed Flow and Steady Laminar Flow,” Physiol. Genom., 9(1), pp. 27–41.10.1152/physiolgenomics.00075.2001 - DOI - PubMed
    1. Cheng, C. , Tempel, D. , Van Der Baan, A. , Krams, R. , Daemen, M. , Van Haperen, R. , Grosveld, F. , and De Crom, R. , 2006, “ Atherosclerotic Lesion Size and Vulnerability Are Determined by Patterns of Fluid Shear Stress,” Circulation, 113(23), pp. 2744–53.10.1161/CIRCULATIONAHA.105.590018 - DOI - PubMed
    1. Malek, A. , Alper, S. , and Izumo, S. , 1999, “ Hemodynamic Shear Stress and Its Role in Atherosclerosis,” JAMA, 282(21), pp. 2035–2042.10.1001/jama.282.21.2035 - DOI - PubMed
    1. Shaaban, A. , and Duerinckx, A. , 2000, “ Wall Shear Stress and Early Atherosclerosis: A Review,” AJR Am. J. Roentgenol., 174(6), pp. 1657–1665.10.2214/ajr.174.6.1741657 - DOI - PubMed
    1. Petersson, S. , Dyverfeldt, P. , and Ebbers, T. , 2012, “ Assessment of the Accuracy of MRI Wall Shear Strss Estimation Using Numerical Simulations,” J. Magn. Reson. Imaging, 36(1), pp. 128–138.10.1002/jmri.23610 - DOI - PubMed

Publication types