. 2022 May 26;187(2):325-344.
doi: 10.1093/toxsci/kfac037.

The Ahr2-Dependent wfikkn1 Gene Influences Zebrafish Transcriptome, Proteome, and Behavior

Affiliations

The Ahr2-Dependent wfikkn1 Gene Influences Zebrafish Transcriptome, Proteome, and Behavior

Prarthana Shankar et al. Toxicol Sci. .

Abstract

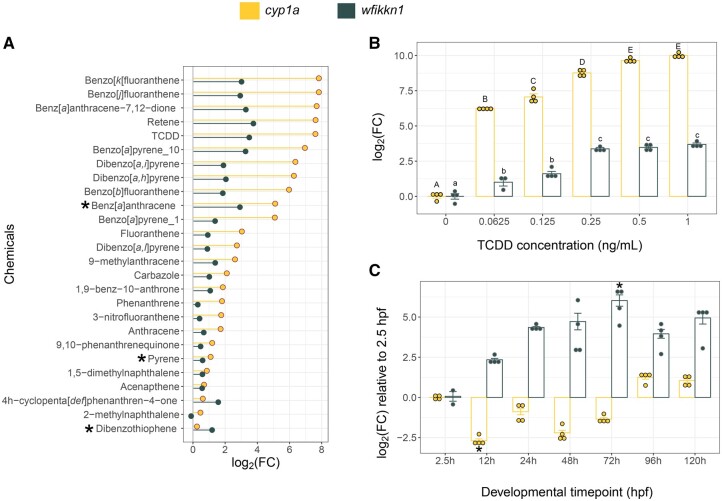
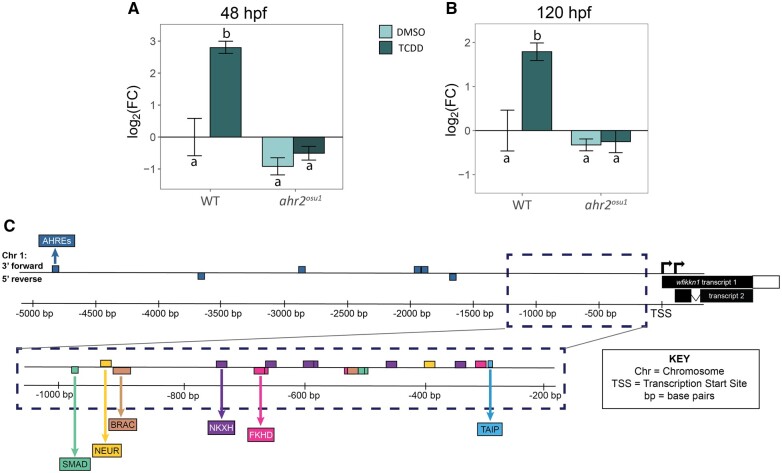
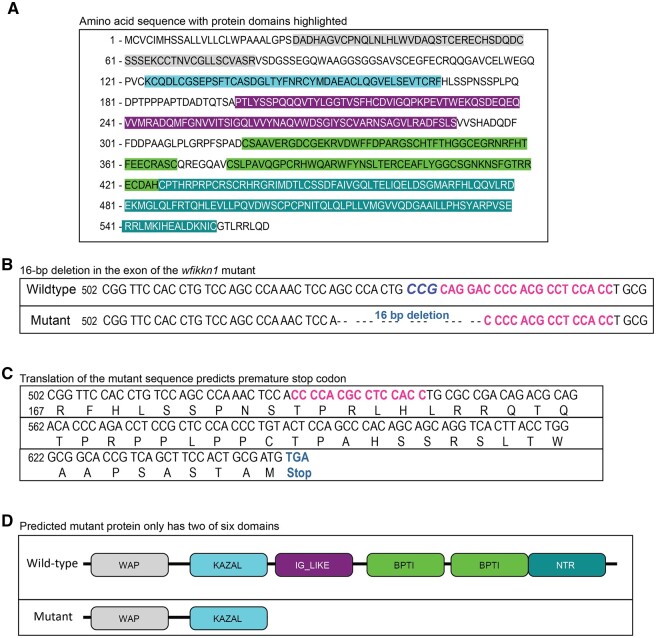
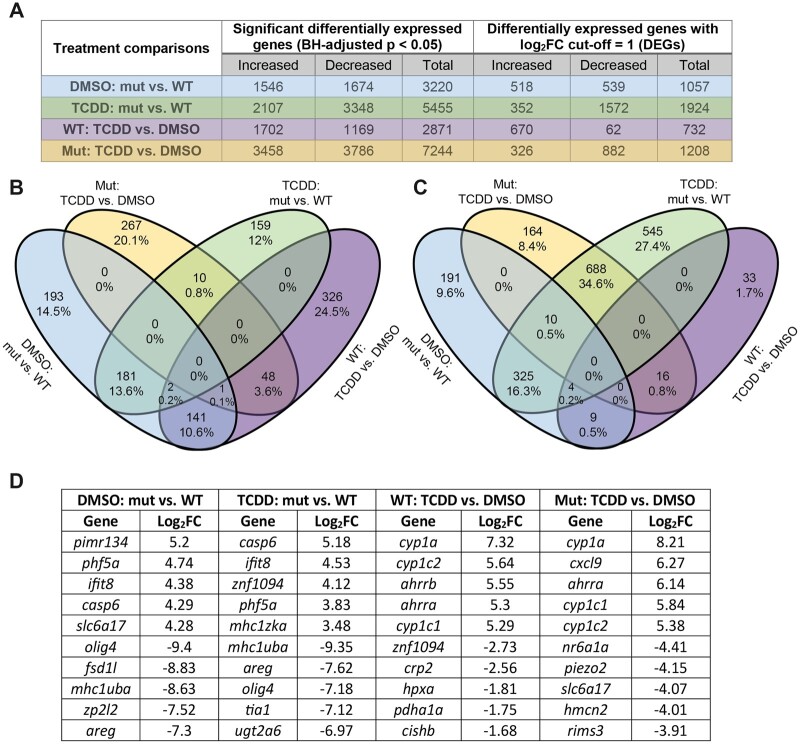
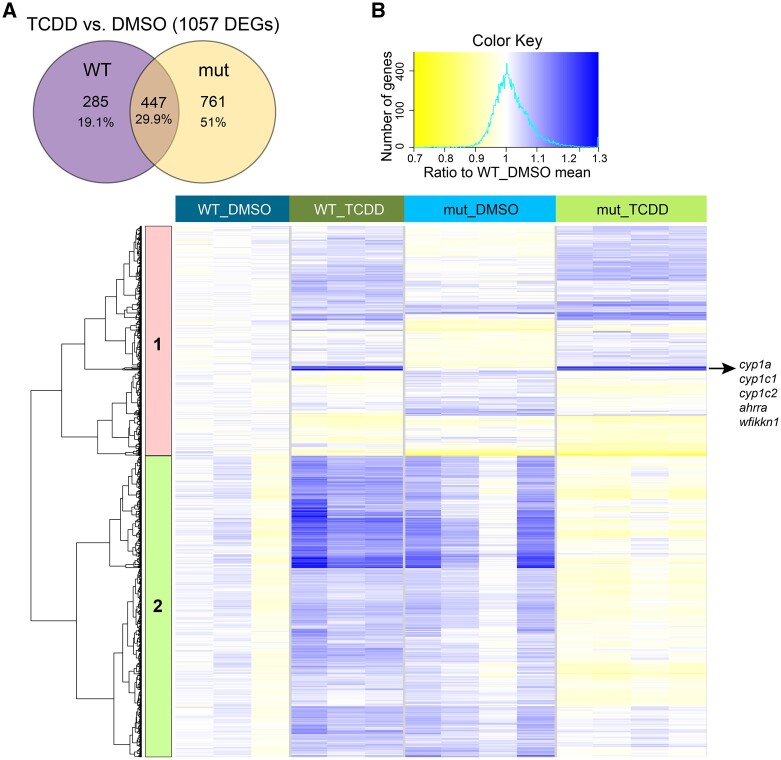
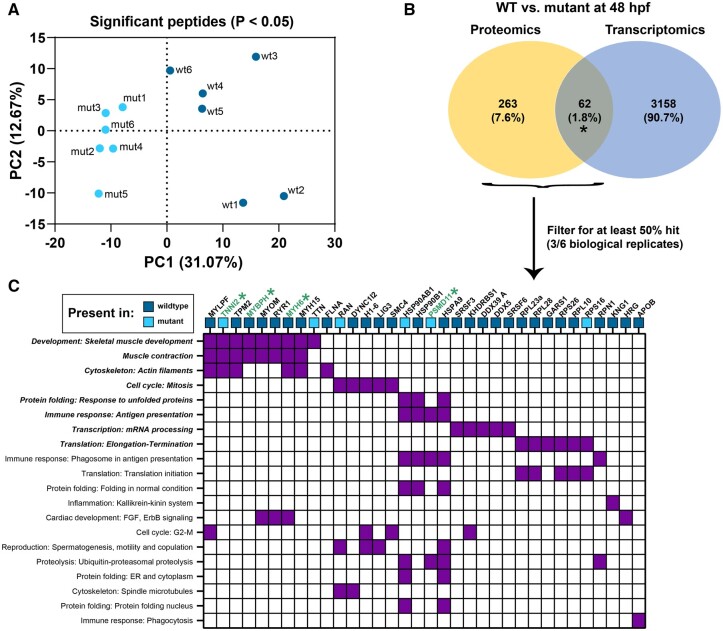
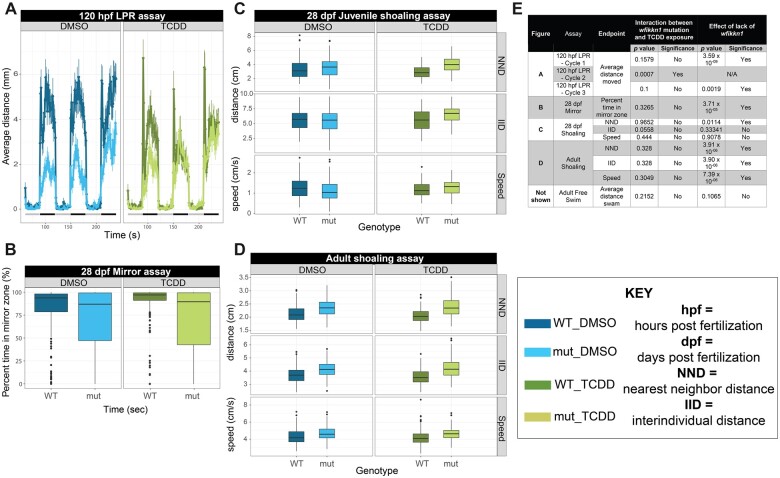
The aryl hydrocarbon receptor (AHR) is required for vertebrate development and is also activated by exogenous chemicals, including polycyclic aromatic hydrocarbons (PAHs) and 2,3,7,8-tetrachlorodibenzo-p-dioxin (TCDD). AHR activation is well-understood, but roles of downstream molecular signaling events are largely unknown. From previous transcriptomics in 48 h postfertilization (hpf) zebrafish exposed to several PAHs and TCDD, we found wfikkn1 was highly coexpressed with cyp1a (marker for AHR activation). Thus, we hypothesized wfikkn1's role in AHR signaling, and showed that wfikkn1 expression was Ahr2 (zebrafish ortholog of human AHR)-dependent in developing zebrafish exposed to TCDD. To functionally characterize wfikkn1, we made a CRISPR-Cas9 mutant line with a 16-bp deletion in wfikkn1's exon, and exposed wildtype and mutants to dimethyl sulfoxide or TCDD. 48-hpf mRNA sequencing revealed over 700 genes that were differentially expressed (p < .05, log2FC > 1) between each pair of treatment combinations, suggesting an important role for wfikkn1 in altering both the 48-hpf transcriptome and TCDD-induced expression changes. Mass spectrometry-based proteomics of 48-hpf wildtype and mutants revealed 325 significant differentially expressed proteins. Functional enrichment demonstrated wfikkn1 was involved in skeletal muscle development and played a role in neurological pathways after TCDD exposure. Mutant zebrafish appeared morphologically normal but had significant behavior deficiencies at all life stages, and absence of Wfikkn1 did not significantly alter TCDD-induced behavior effects at all life stages. In conclusion, wfikkn1 did not appear to be significantly involved in TCDD's overt toxicity but is likely a necessary functional member of the AHR signaling cascade.

Keywords: TCDD; aryl hydrocarbon receptor (AHR); behavior; transcriptomics; wfikkn1; zebrafish.


Figures

Figure 1.
Figure 1.
Comparison between cyp1a and wfikkn1 expression in developing zebrafish. A, Comparison of cyp1a and wfikkn1 gene expression from previously published microarray (*) and RNA sequencing datasets collected from 48-h postfertilization (hpf) zebrafish. wfikkn1 expression increases in parallel with cyp1a induction, with chemicals that strongly induce cyp1a, also strongly inducing wfikkn1 expression. All microarray* (benz[a]anthracene, dibenzothiophene, and pyrene) data are previously published (Goodale et al., 2013). All RNA sequencing datasets (remaining chemicals) were reanalyzed with the same data analysis pipeline (Shankar et al., in progress). B, Quantitative reverse transcriptase polymerase chain reaction (RT-qPCR) concentration response of cyp1a and wfikkn1 expression in 48-hpf wild-type (WT) zebrafish embryos (n =3–4, represented by the individual dots) exposed to 0.0625, 0.125, 0.25, 0.5, and 1 ng/ml 2,3,7,8-tetrachlorodibenzo-p-dioxin (TCDD). Expression of both genes increased in a concentration-dependent manner. The control was 0.1% dimethyl sulfoxide, which is listed as 0 ng/ml TCDD. Expression values were determined using the 2−ΔΔCT method, and the normalization control was β-actin. The data were log2-transformed, and data are represented as the mean ± standard error of mean (error bars). Normality was tested using a Shapiro test, and statistical significance for each gene was determined using a 1-way ANOVA followed by a post hoc Tukey test. Uppercase (cyp1a) and lowercase (wfikkn1) letters indicate expression values statistically different (p <.01) from each other. C, RT-qPCR expression of cyp1a and wfikkn1 in developing WT zebrafish (n =2–4, represented by the individual dots) at multiple time points from 2.5 to 120 hpf in the absence of xenobiotic ahr2 activation. Data analysis was similar to (B), and statistical significance was determined compared with 2.5 hpf for each gene using the Kruskal-Wallis followed by Dunn’s test. * indicates p <.05 compared with respective 2.5-h log2FC.
Figure 2.
Figure 2.
ahr2-dependence of wfikkn1 developmental expression. wfikkn1 expression in 48 h postfertilization (hpf) (A) and 120 hpf (B) wild-type 5D (WT) and ahr2-null (ahr2osu1) whole embryos developmentally exposed to 0.1% dimethyl sulfoxide or 1 ng/ml 2,3,7,8-tetrachlorodibenzo-p-dioxin (TCDD; n =3–4 reps/treatment). wfikkn1 expression was significantly increased upon exposure to TCDD only in WT zebrafish, and there was no significant increase in ahr2-null zebrafish at both timepoints. Expression values were analyzed using the 2−ΔΔT method, and β-actin was used as the normalization control. Different letters indicate statistical difference (p <.001, Type I 2-way ANOVA with a post hoc Tukey test). C, Schematic diagram of the wfikkn1 gene locus (not to scale) on the reverse strand of Chromosome 1 of the zebrafish genome. Zebrafish have 2 predicted wfikkn1 transcripts (TSS, transcription start site). The 6 identified aryl hydrocarbon response element consensus sequences, “GCGTC” (Chang et al., 2013; Karchner et al., 2002) in the 5-kb region upstream of the TSS are highlighted in the top panel. The bottom panel shows the top 10 predicted transcription factor binding sites from Genomatix (Cartharius et al., 2005). Abbreviations: NEUR, NeuroD; Beta2, HLH domain; BRAC, Brachyury gene, mesoderm developmental factor; NKXH, NKX homeodomain factors; FKHD, fork head domain factors; TAIP, TGF-β-induced apoptosis proteins).
Figure 3.
Figure 3.
Schematic diagrams of predicted Wfikkn1 protein in wild-type (WT) zebrafish, and characterization of wfikkn1 mutant CRISPR-Cas9 line. A, Predicted amino acid sequence of Wfikkn1 with protein domains highlighted in different colors (gray: whey acidic protein [WAP]-type “4-disulfide core,” blue: Kazal serine protease inhibitors, purple: immunoglobulin-like domain, light green: 2 pancreatic trypsin inhibitor (Kunitz or BPTI) domains, and dark green: NTR domain). (B) The DNA sequence of the wfikkn1 exon in wild-type (top) and wfikkn1 mutant (bottom) zebrafish. The protospacer adjacent motif site is bolded and in italics (CCG), and the single-guide RNA sequence is bolded and in pink. C, The translated mutant sequence results in a frameshift mutation and is predicted to result in a premature stop codon at amino acid residue 216. D, The truncated protein in the mutant line only contains the WAP and KAZAL domains. A color version of this figure appears in the online version of this article.
Figure 4.
Figure 4.
Overview of RNA sequencing data from 48-h postfertilization wild-type (WT) and wfikkn1 mutants (mut) exposed to 0.1% dimethyl sulfoxide or 1 ng/ml 2,3,7,8-tetrachlorodibenzo-p-dioxin. A, Total number of significant differentially expressed genes (DEGs) with a log2FC = 1 cutoff (DEGs) across the 4 treatment comparisons. Venn diagrams showing all DEGs (Benjamini-Hochberg-adjusted p <.05) that had increased (B) or decreased (C) expression in each of the treatment comparisons. D, The top 5 annotated DEGs with most increased and most decreased expressions between each of the treatment comparisons with their log2FC values.
Figure 5.
Figure 5.
Impact of the lack of wfikkn1 on the 48-h postfertilization zebrafish transcriptome. A, Top 10 MetaCore process network enrichments of human orthologs of differentially expressed genes between WT_DMSO and mut_DMSO. Significant processes (FDR-adjusted p <.05) are bolded and italicized. The interaction size is the number of observed genes from each cluster that belongs to the process network, and enrichment ratio is the ratio of the number of observed genes to the expected genes from each network. The top 2 processes are skeletal muscle development and muscle contraction. B, MetaCore interactome of genes enriched in the top 2 biological process networks (gray). AHR and WFIKKN1 were manually added to the network. Proteins predicted by MetaCore that interact with AHR or WFIKKN1, and the gray genes are depicted in other colors (BMP4, CTNNB1, AR, NANOG, SOX17, RUNX1, BMP2, and BMP4). Thicker colored lines show the direct interactions with WFIKKN1. Abbreviations: WT, wild type; DMSO, dimethyl sulfoxide; FDR, false discovery rate. AHR, aryl hydrocarbon receptor. A color version of this figure appears in the online version of this article.
Figure 6.
Figure 6.
Effect of the lack of wfikkn1 on the 48-h postfertilization transcriptome when zebrafish are exposed to 1 ng/ml 2,3,7,8-tetrachlorodibenzo-p-dioxin (TCDD). A, Venn diagram of differentially expressed genes in 1 ng/ml TCDD-exposed wild-type (WT) or mut zebrafish compared with the respective dimethyl sulfoxide (DMSO) controls. B, Hierarchical clustering of the union of the genes in (A) whose trimmed mean of M-normalized, regular log-transformed counts have been normalized to the control WT_DMSO. Blue indicates genes that have increased expression and yellow indicates genes that have decreased expression compared with WT_DMSO. We identified two unique clusters, with Cluster 2 consisting of genes that had distinct gene expression changes in the WT zebrafish line compared with the wfikkn1 mutants upon exposure to TCDD. A color version of this figure appears in the online version of this article.
Figure 7.
Figure 7.
Functional enrichment of genes differently differentially expressed in wild-type and wfikkn1 mutant zebrafish upon exposure to 2,3,7,8-tetrachlorodibenzo-p-dioxin. Top 20 MetaCore process network enrichments of genes in Cluster 2. Significant processes (false discovery rate-adjusted p <.05) bolded and italicized. The interaction size is the number of observed genes from each cluster that belongs to the process network, and enrichment ratio is the ratio of the number of observed genes to the expected genes from each network.
Figure 8.
Figure 8.
Transcriptional regulation of aryl hydrocarbon receptor (AHR)-associated differentially expressed genes in wild-type and wfikkn1 mutant zebrafish exposed to 2,3,7,8-tetrachlorodibenzo-p-dioxin. Orange circles (NLGN1, DRD1, IGF1R, DISC1, KCNH7) depict the genes from Cluster 2 (Figure 6) and belong to at least one of the enriched biological process networks (Figure 7) that are predicted to have direct interactions with the AHR. Black circles (TGIF2, SFXN1, SAMD12, NAV1, MAGI-2, WNT9A, FIGN, USH2A) are genes in Cluster 2 that do not belong to a biological process network but have a direct interaction with the AHR. The transcription factors (TFs; purple) either belong to the top 30 predicted enriched TFs for the dataset or are found in the dataset (yellow). TF circle sizes refer to the number of predicted targets here, with the largest circles having 10 targets (eg, ESRRA), and the smallest circles having 1 target (eg, QK1 and FER). TFs are shown as triangles interact with wfikkn1 in MetaCore’s manually curated database. A color version of this figure appears in the online version of this article.
Figure 9.
Figure 9.
Whole-animal proteomic comparison between wild-type (WT) and wfikkn1 mutant zebrafish at 48 hpf. A, PCA plot of 6 biological replicates of the wild-type (wt) and wfikkn1 (mut) significant peptides (false discovery rate [FDR] p <.05). B, Comparison between genes of proteins predicted from significant peptides (FDR p <.05; proteomics) and significant differentially expressed genes (FDR p <.05; transcriptomics). C, Heatmap showing MetaCore process networks (significant processes are bolded) on the y-axis, and proteins from proteomic and transcriptomic (*) datasets on the x-axis. Blue boxes represent proteins expressed in at least 3 biological replicates of WT or mutants and absent in all replicates of the other genotype.
Figure 10.
Figure 10.
Behavior analyses of wfikkn1 mutant zebrafish exposed to 50 pg/ml 2,3,7,8-tetrachlorodibenzo-p-dioxin (TCDD). A, 120-h postfertilization larval photomotor response (LPR) showing wfikkn1 mutant zebrafish significantly hypoactive compared with wild-type (WT) zebrafish in light (quiescent) and dark (active) periods of the assay indicated by the gray-black bar at the bottom, respectively. Significant interaction between lack of wfikkn1 and TCDD exposure was detected in Cycle 2. Error bars are a representation of the standard deviation of the mean every 6 seconds. B, 28-dpf mirror assay showing mutant zebrafish spending significantly less time in the “mirror zone” compared with WT zebrafish. Boxplots (for B–D) show spread of the data, with the horizontal line representing each median, and dots representing outliers. 28-dpf juvenile (C) and adult (D) shoaling measured using the nearest neighbor distance (NND), interindividual distance, and speed of zebrafish within shoals of 4 zebrafish. NND was significantly different between mutants and WT in juvenile zebrafish, and all 3 endpoints were significant in adult zebrafish. E, Summary table showing assay details, including p values and corresponding significance (Type III ANOVA).

References

    1. Ahmad F., Noldus L. P. J. J., Tegelenbosch R. A. J., Richardson M. K. (2012). Zebrafish embryos and larvae in behavioural assays. Behaviour 149, 1241–1281.
    1. Anders S., Pyl P. T., Huber W. (2015). HTSeq – A python framework to work with high-throughput sequencing data. Bioinformatics 31, 166–169. - PMC - PubMed
    1. Andreasen E. A., Spitsbergen J. M., Tanguay R. L., Stegeman J. J., Heideman W., Peterson R. E. (2002). Tissue-specific expression of AHR2, ARNT2, and CYP1A in zebrafish embryos and larvae: Effects of developmental stage and 2,3,7,8-tetrachlorodibenzo-p-dioxin exposure. Toxicol. Sci. 68, 403–419. - PubMed
    1. Babin P. J., Goizet C., Raldua D. (2014). Zebrafish models of human motor neuron diseases: Advantages and limitations. Prog. Neurobiol. 118, 36–58. - PubMed
    1. Bailey J., Oliveri A., Levin E. D. (2013). Zebrafish model systems for developmental neurobehavioral toxicology. Birth Defects Res. C Embryo Today 99, 14–23. - PMC - PubMed

Publication types

MeSH terms