. 2022 Apr 19;119(16):e2118705119.
doi: 10.1073/pnas.2118705119. Epub 2022 Apr 4.

Face neurons encode nonsemantic features

Affiliations

Face neurons encode nonsemantic features

Alexandra Bardon et al. Proc Natl Acad Sci U S A. .

Abstract

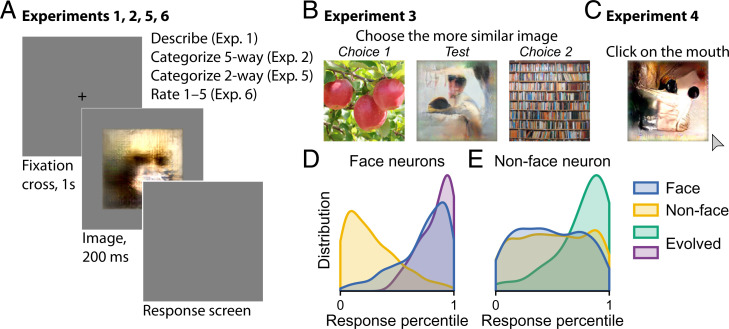
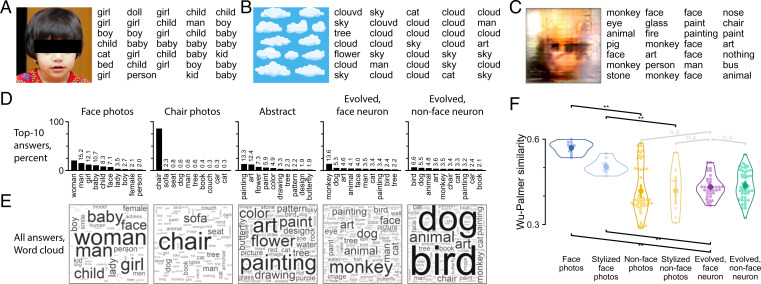
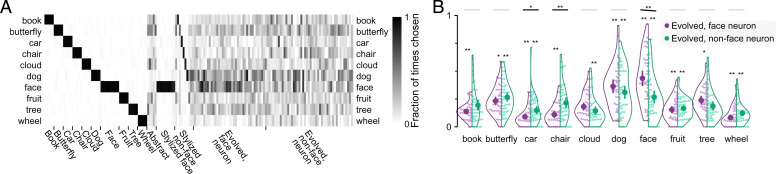
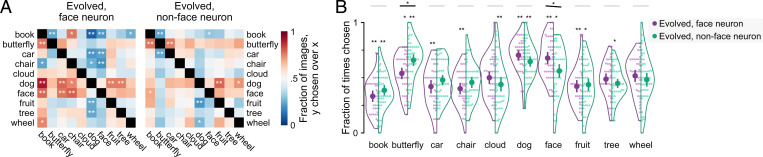
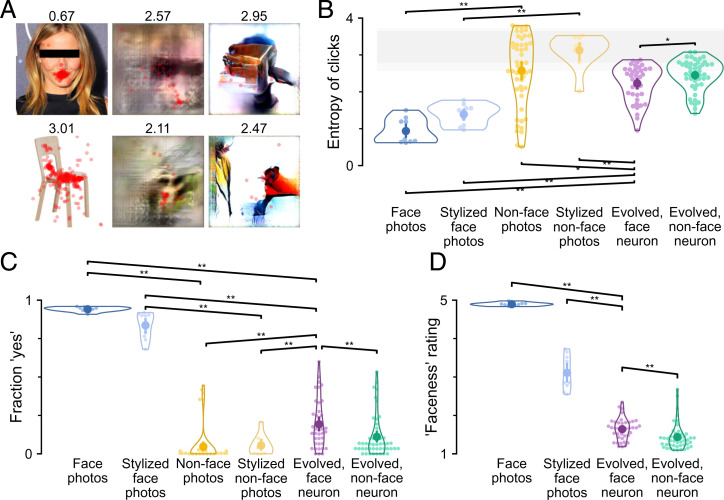
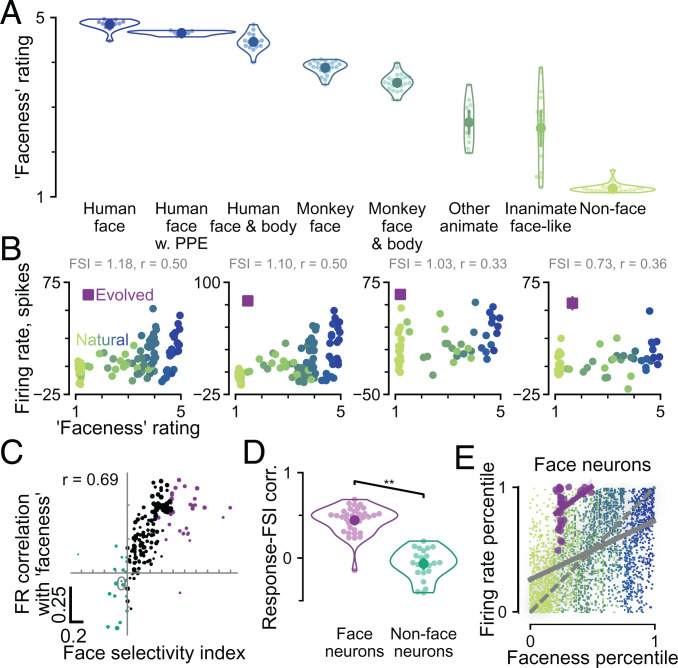
The primate inferior temporal cortex contains neurons that respond more strongly to faces than to other objects. Termed “face neurons,” these neurons are thought to be selective for faces as a semantic category. However, face neurons also partly respond to clocks, fruits, and single eyes, raising the question of whether face neurons are better described as selective for visual features related to faces but dissociable from them. We used a recently described algorithm, XDream, to evolve stimuli that strongly activated face neurons. XDream leverages a generative neural network that is not limited to realistic objects. Human participants assessed images evolved for face neurons and for nonface neurons and natural images depicting faces, cars, fruits, etc. Evolved images were consistently judged to be distinct from real faces. Images evolved for face neurons were rated as slightly more similar to faces than images evolved for nonface neurons. There was a correlation among natural images between face neuron activity and subjective “faceness” ratings, but this relationship did not hold for face neuron–evolved images, which triggered high activity but were rated low in faceness. Our results suggest that so-called face neurons are better described as tuned to visual features rather than semantic categories.

Keywords: face neurons; neural coding; semantic tuning; visual cortex.


Conflict of interest statement

The authors declare no competing interest.

Figures

Fig. 1.
Fig. 1.
Overview of the study. (AC) Schematics of experiments. (A) In experiments 1, 2, 5, and 6, each trial began with a center cross shown for 1 s followed by an image shown for 200 ms and then, the response screen. (B) In experiment 3, three images were presented together in each trial. The subject was instructed to select the side that was more similar to the center image. (C) In experiment 4, images were presented individually, and the subject was instructed to “click on the mouth.” (D and E) Distributions of normalized neuronal responses to face, nonface, and evolved images for face-selective (D) and nonface-selective neurons (E). The distribution is over images and neurons.
Fig. 2.
Fig. 2.
Experiment 1: one-word (basic-level) description. (AC) Three example images and example responses are shown. (D) The top 10 descriptions along with frequency are shown for each image group. Frequencies lower than 20% are indicated by numbers above bars. (E) Description frequency for each image group is visualized using a word cloud. (F) WP semantic similarity was calculated between subject-provided descriptions. The swarm plot shows WP similarity between the descriptions of any image and descriptions of face photos (each face photo was compared with the other 9 face photos; other images were compared with all 10 face photos). Each small point represents an image. The horizontal spread within each group is for visualization only. Open contour indicates the kernel density estimate for the points. The inner thick bar and point indicate data mean and bootstrap 95%-CI of the mean. Only indicated pairs were tested. n.s., not significant. **P < 0.01, one-tailed permutation test with test direction indicated by the slope of the square bracket, false discovery rate (FDR) corrected across seven tests.
Fig. 3.
Fig. 3.
Experiment 2: five-way categorization. (A) Subjects were presented with an image and were asked to choose among five category labels (Fig. 1A). The heat map shows the fraction of trials a label was chosen when it was an available option. Thus, the fraction ranges from zero to one in all cases. Each column corresponds to an image. Each row corresponds to a categorization option. (B) The swarm plot shows the fraction of trials each label was chosen (if available) separately for images evolved by face neurons (purple) and nonface neurons (green). Each point represents one evolved image. Open contour indicates the kernel density estimate. The inner thick bar and point indicate data mean and bootstrap 95%-CI of the mean. *On violin, P < 0.05, two-sided binomial test for difference from chance = 0.2, FDR corrected across 20 tests; **on violin, P < 0.01, two-sided binomial test for difference from chance = 0.2, FDR corrected across 20 tests; *on the black line, P < 0.05, **on the black line, P < 0.01, permutation test, FDR corrected across 10 tests, the test was one tailed for the face option (face neurons evolved greater than nonface neurons evolved) and two tailed otherwise.
Fig. 4.
Fig. 4.
Experiment 3: image similarity. (A) Subjects were presented with three images and asked to select whether the left or right image was more similar to the center one (Fig. 1B). Each evolved image was tested at least once for each option pair (10 choose 2 = 45 pairs). The heat map shows the faction of images for which the y category was chosen over the x category for images evolved from face neurons (Left) or nonface neurons (Right). *P < 0.05, two-sided binomial test for difference from chance =0.5, FDR corrected across 90 pairwise tests; **P < 0.01, two-sided binomial test for difference from chance =0.5, FDR corrected across 90 pairwise tests. (B) The swarm plot shows the fraction of trials a category was favored when it was an option (thus, possible values range from zero to one). Plot conventions follow those in Fig. 3B. *On violin, P < 0.05, **on violin, P < 0.01, two-sided binomial test for difference from chance =0.5, FDR corrected across 20 tests; *on the black line, P < 0.05, permutation test, FDR corrected across 10 tests, the test was one tailed for the face option (face neurons evolved greater than nonface neurons evolved) and two tailed otherwise.
Fig. 5.
Fig. 5.
Experiments 4 to 6: locating the mouth, binary classification, and rating of faceness. (A) In experiment 4, subjects were asked to click on the mouth (Fig. 1C). Click locations are shown for six example images. (B) The swarm plot shows the entropy of click locations for each image across subjects. Shading indicates permutation 95% CIs at the image (lighter gray) or group level (darker gray) when click locations were permuted across images to represent the null hypothesis that there was no difference across images. (C) In experiment 5, subjects indicated whether or not an image contained a face (Fig. 1A). The swarm plot shows the fraction of yes answers for each image across subjects. Plot conventions follow those in Fig. 2F. (D) In experiment 6, subjects provided a faceness rating between one (not a face) and five (most face like) to each image (Fig. 1A). The swarm plot shows the average faceness ratings for each image across subjects. FDR correction was across all three tests performed. In BD, plot conventions follow those in Fig. 2F. *P < 0.05, **P < 0.01, one-tailed permutation test with test direction indicated by the slope of the square bracket, FDR corrected across all seven tests performed in B, C, and all three tests performed in D.
Fig. 6.
Fig. 6.
Face neuron responses were correlated with graded ratings of faceness. (A) The swarm plot shows faceness ratings for 131 natural images of objects grouped by category. The images are shown in SI Appendix, Fig. S4A. (B) Responses of example face neurons are compared with image faceness ratings, including the natural images in A (green to blue dots) and the evolved image for each neuron (purple square). The text indicates the FSI of the neuron and the correlation coefficient between natural image faceness and neuronal responses. (C) The face selectivity of 220 visual neurons as quantified by FSI is compared with the correlation between faceness rating and neuron spiking responses. Each point represents a neuron. Face and nonface neurons are colored purple and green, respectively. The size of each point is scaled relative to the neuron’s trial to trial self-consistency. (D) The swarm plot compares firing rate with image faceness correlation values (y values in C) for face and nonface neurons. In A and D, plot conventions follow those in Fig. 2F. **P < 0.01, one-tailed permutation test. (E) Image faceness and firing rates were normalized as percentiles within each neuron and then pooled over face neurons separately for natural and evolved images. Each point represents one image response in one face neuron. Green to blue scatter represents natural images, and shading represents their distribution (kernel density estimate). Purple scatter represents evolved images. Solid lines represent linear regression fits. The dashed gray line is the identity line.

References

    1. Bruce C., Desimone R., Gross C. G., Visual properties of neurons in a polysensory area in superior temporal sulcus of the macaque. J. Neurophysiol. 46, 369–384 (1981). - PubMed
    1. Perrett D. I., Rolls E. T., Caan W., Visual neurones responsive to faces in the monkey temporal cortex. Exp. Brain Res. 47, 329–342 (1982). - PubMed
    1. Desimone R., Albright T. D., Gross C. G., Bruce C., Stimulus-selective properties of inferior temporal neurons in the macaque. J. Neurosci. 4, 2051–2062 (1984). - PMC - PubMed
    1. McMahon D. B., Bondar I. V., Afuwape O. A., Ide D. C., Leopold D. A., One month in the life of a neuron: Longitudinal single-unit electrophysiology in the monkey visual system. J. Neurophysiol. 112, 1748–1762 (2014). - PMC - PubMed
    1. Tsao D. Y., Freiwald W. A., Tootell R. B., Livingstone M. S., A cortical region consisting entirely of face-selective cells. Science 311, 670–674 (2006). - PMC - PubMed

LinkOut - more resources