. 2022 Apr 12;119(15):e2118879119.
doi: 10.1073/pnas.2118879119. Epub 2022 Apr 4.

A generalist-specialist trade-off between switchgrass cytotypes impacts climate adaptation and geographic range

Affiliations

A generalist-specialist trade-off between switchgrass cytotypes impacts climate adaptation and geographic range

Joseph D Napier et al. Proc Natl Acad Sci U S A. .

Abstract

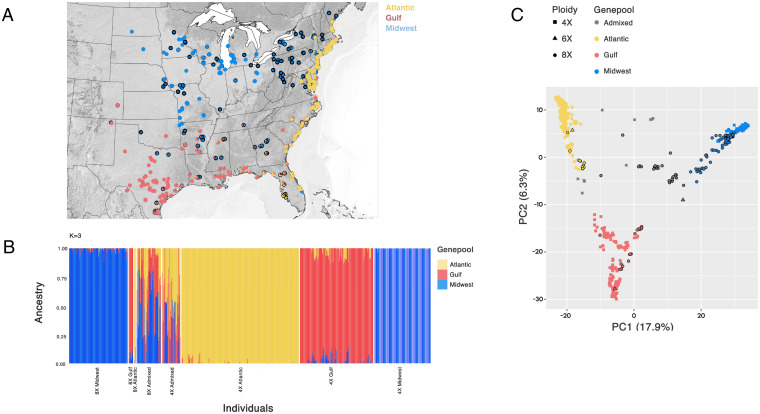
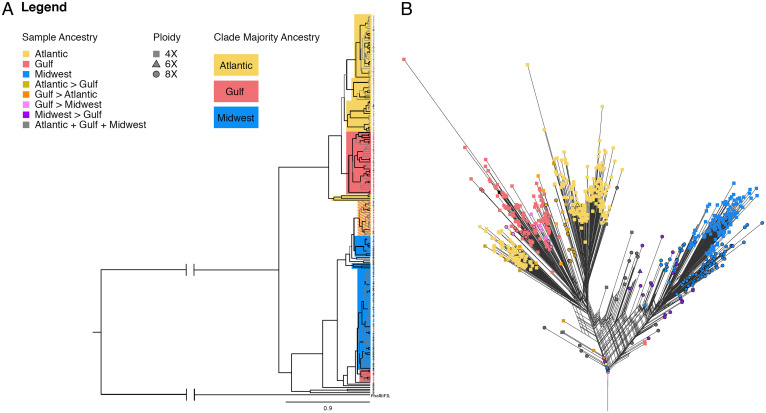
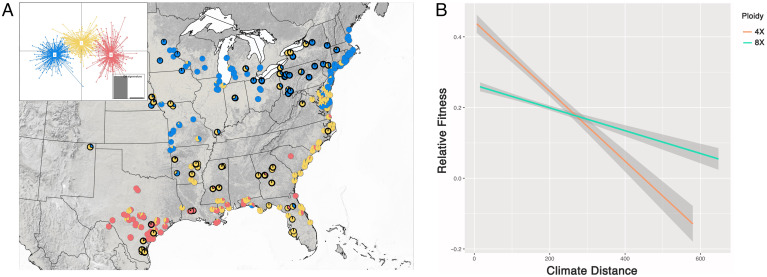
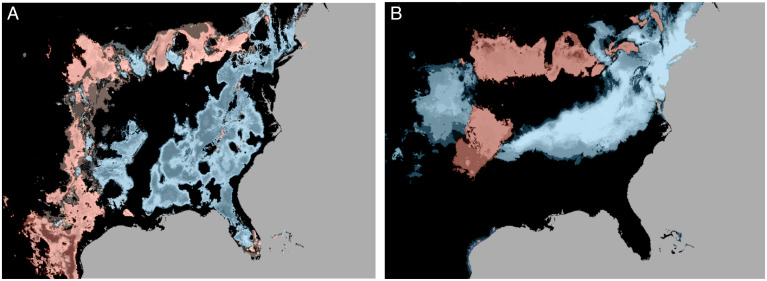
Polyploidy results from whole-genome duplication and is a unique form of heritable variation with pronounced evolutionary implications. Different ploidy levels, or cytotypes, can exist within a single species, and such systems provide an opportunity to assess how ploidy variation alters phenotypic novelty, adaptability, and fitness, which can, in turn, drive the development of unique ecological niches that promote the coexistence of multiple cytotypes. Switchgrass, Panicum virgatum, is a widespread, perennial C4 grass in North America with multiple naturally occurring cytotypes, primarily tetraploids (4×) and octoploids (8×). Using a combination of genomic, quantitative genetic, landscape, and niche modeling approaches, we detect divergent levels of genetic admixture, evidence of niche differentiation, and differential environmental sensitivity between switchgrass cytotypes. Taken together, these findings support a generalist (8×)–specialist (4×) trade-off. Our results indicate that the 8× represent a unique combination of genetic variation that has allowed the expansion of switchgrass’ ecological niche and thus putatively represents a valuable breeding resource.

Keywords: Panicum virgatum; cytotypes; octoploid.


Conflict of interest statement

The authors declare no competing interest.

Figures

Fig. 1.
Fig. 1.
Analyses of population genetic structure. (A) Spatial distributions of the switchgrass subpopulations. Pie charts show the proportion of an individual that was assigned to each subpopulation; 8× samples have a black collar around the pie chart. (B) Bar graphs represent the multilocus genetic assignment of each individual to each ADMIXTURE group. (C) PCA results for both cytotypes, where data points are shaded according to their ADMIXTURE genetic-cluster association.
Fig. 2.
Fig. 2.
Phylogenetic relationships. (A) Chloroplast tree for a subset of switchgrass samples. Gray branches indicate less than 0.95 posterior probability support, and black branches indicate greater than 0.95 posterior probability support. Colors indicate the nuclear ancestry of the majority of samples in the assigned clade. (B) NeighborNet tree showing nuclear ancestry of all 4× and 8× samples.
Fig. 3.
Fig. 3.
Analyses of phenotypic variation at common-garden plantings. (A) De novo morphological assignments for both cytotypes (red, lowland; blue, upland; and gold, coastal); 8× samples are indicated with a black collar, with Inset demonstrating the clustering of the three ecotypes along the first and second discriminant axes. (B) The predicted linear relationship between climate distance (how different planting environment is from sample origin climate) and relative fitness (estimated by the relative biomass measured over two years) for each cytotype. The linear relationships and 95% confidence intervals are depicted for both cytotypes over the same climate distance. Raw data for these predictions are shown in SI Appendix, Fig. S3.
Fig. 4.
Fig. 4.
ENM. Black indicates similar niche suitability. More intense blue coloration indicates higher 8× habitat suitability, while more intense red coloration indicates higher 4× habitat suitability. (A) Differences in habitat suitability for all 4× and 8×. (B) Differences in habitat suitability for 4× and 8× belonging to the Midwestern subpopulation.
Fig. 5.
Fig. 5.
Shifts in allele frequency from Midwest ancestry toward Gulf (A) and Atlantic (B) ancestry. The red SNPs are the overlapping outliers identified by both an environmental approach (RDA outliers) and the strongest shifts in allele frequency.

References

    1. Ramsey J., Schemske D. W., Pathways, mechanisms, and rates of polyploid formation in flowering plants. Annu. Rev. Ecol. Syst. 29, 467–501 (1998).
    1. Soltis P. S., Marchant D. B., Van de Peer Y., Soltis D. E., Polyploidy and genome evolution in plants. Curr. Opin. Genet. Dev. 35, 119–125 (2015). - PubMed
    1. Kolář F., Čertner M., Suda J., Schönswetter P., Husband B. C., Mixed-ploidy species: Progress and opportunities in polyploid research. Trends Plant Sci. 22, 1041–1055 (2017). - PubMed
    1. Alix K., Gérard P. R., Schwarzacher T., Heslop-Harrison J. S. P., Polyploidy and interspecific hybridization: Partners for adaptation, speciation and evolution in plants. Ann. Bot. 120, 183–194 (2017). - PMC - PubMed
    1. Otto S. P., The evolutionary consequences of polyploidy. Cell 131, 452–462 (2007). - PubMed