

Infrastructure inequality is a characteristic of urbanization
- PMID: 35377809
- PMCID: PMC9169802
- DOI: 10.1073/pnas.2119890119
Infrastructure inequality is a characteristic of urbanization
Erratum in
-
Correction for Pandey et al., Infrastructure inequality is a characteristic of urbanization.Proc Natl Acad Sci U S A. 2022 May 31;119(22):e2206814119. doi: 10.1073/pnas.2206814119. Epub 2022 May 26. Proc Natl Acad Sci U S A. 2022. PMID: 35617438 Free PMC article. No abstract available.
Abstract
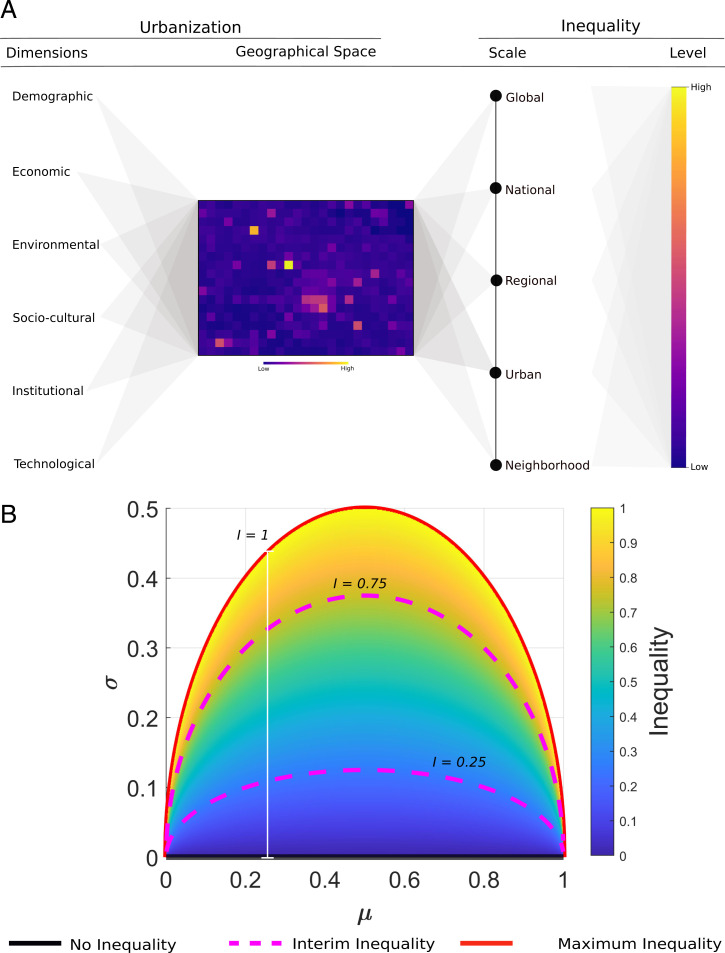
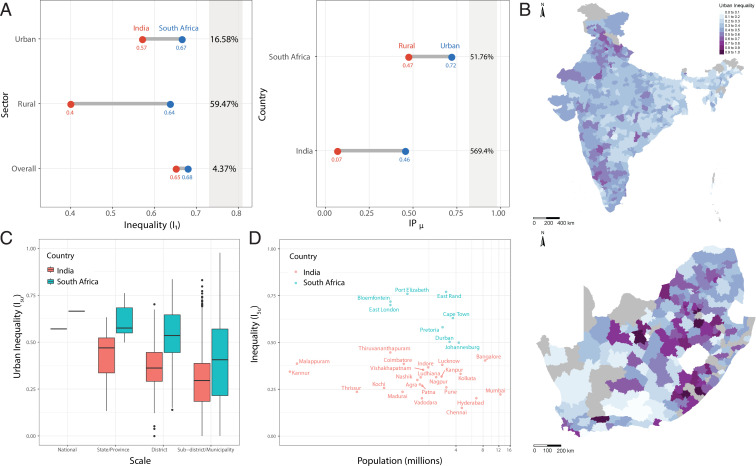
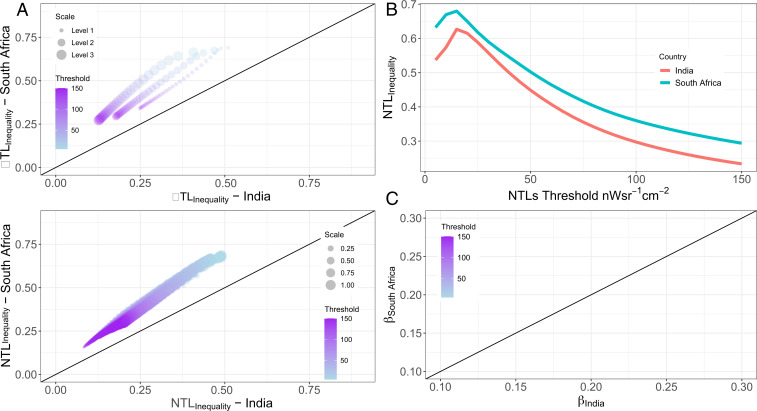
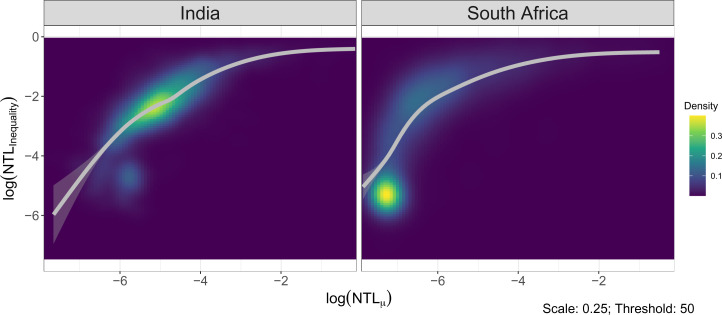
Urbanization can challenge sustainable development if it produces unequal outcomes. Infrastructure is an important urbanization dimension, providing services to support diverse urban activities. However, it can lock in unequal outcomes due to its durable nature. This paper studies inequalities in infrastructure distributions to derive insights into the structure and characteristics of unequal outcomes associated with urbanization. We analyzed infrastructure inequalities in two emerging economies in the Global South: India and South Africa. We developed and applied an inequality measure to understand the structure of inequality in infrastructure provisioning (based on census data) and infrastructure availability (based on satellite nighttime lights [NTLs] data). Consistent with differences in economic inequality, results show greater inequalities in South Africa than in India and greater urban inequalities than rural inequalities. Nevertheless, inequalities in urban infrastructure provisioning and infrastructure availability increase from finer to coarser spatial scales. NTL-based inequality measurements additionally show that inequalities are more concentrated at coarse spatial scales in India than in South Africa. Finally, results show that urban inequalities in infrastructure provisioning covary with urbanization levels conceptualized as a multidimensional phenomenon, including demographic, economic, and infrastructural dimensions. Similarly, inequalities in urban infrastructure availability increase monotonically with infrastructure development levels and urban population size. Together, these findings underscore infrastructure inequalities as a feature of urbanization and suggest that understanding urban inequalities requires applying an inequality lens to urbanization.
Keywords: developing countries; spatial scale; sustainability; urban inequality; urbanization.
Conflict of interest statement
The authors declare no competing interest.
Figures
Similar articles
-
Rising infrastructure inequalities accompany urbanization and economic development.Nat Commun. 2025 Jan 30;16(1):1193. doi: 10.1038/s41467-025-56539-w. Nat Commun. 2025. PMID: 39885175 Free PMC article.
-
Satellite mapping of urban built-up heights reveals extreme infrastructure gaps and inequalities in the Global South.Proc Natl Acad Sci U S A. 2022 Nov 16;119(46):e2214813119. doi: 10.1073/pnas.2214813119. Epub 2022 Nov 7. Proc Natl Acad Sci U S A. 2022. PMID: 36343227 Free PMC article.
-
Urban equity and urban health: using existing data to understand inequalities in health and environment in Accra, Ghana and Sao Paulo, Brazil.Environ Urban. 1997 Apr;9(1):181-202. doi: 10.1177/095624789700900115. Environ Urban. 1997. PMID: 12293192
-
A review of rural and peri-urban sanitation infrastructure in South-East Asia and the Western Pacific: Highlighting regional inequalities and limited data.Int J Hyg Environ Health. 2022 Jul;244:113992. doi: 10.1016/j.ijheh.2022.113992. Epub 2022 Jun 22. Int J Hyg Environ Health. 2022. PMID: 35752101 Review.
-
The impact of urbanization on mental health service provision: a Brazil, Russia, India, China, South Africa and Africa focus.Curr Opin Psychiatry. 2019 May;32(3):224-231. doi: 10.1097/YCO.0000000000000495. Curr Opin Psychiatry. 2019. PMID: 30724752 Review.
Cited by
-
Inequality in infrastructure access and its association with health disparities.Nat Hum Behav. 2025 May 22. doi: 10.1038/s41562-025-02208-3. Online ahead of print. Nat Hum Behav. 2025. PMID: 40404914
-
Urbanization, Human Inequality, and Material Consumption.Int J Environ Res Public Health. 2023 Mar 4;20(5):4582. doi: 10.3390/ijerph20054582. Int J Environ Res Public Health. 2023. PMID: 36901593 Free PMC article.
-
Optimal farm size reduces global poverty-induced soil antibiotic exposure risk.Nat Food. 2025 Apr;6(4):353-364. doi: 10.1038/s43016-025-01131-0. Epub 2025 Mar 6. Nat Food. 2025. PMID: 40050660
-
Global urban greening and its implication for urban heat mitigation.Proc Natl Acad Sci U S A. 2025 Jan 28;122(4):e2417179122. doi: 10.1073/pnas.2417179122. Epub 2025 Jan 21. Proc Natl Acad Sci U S A. 2025. PMID: 39835896 Free PMC article.
-
Urban versus rural older adults: occupational balance and quality of life comparison.BMC Geriatr. 2025 Jan 21;25(1):49. doi: 10.1186/s12877-025-05694-2. BMC Geriatr. 2025. PMID: 39838293 Free PMC article.
References
-
- United Nations, Department of Economic and Social Affairs, “Urbanization: Expanding opportunities but deeper divides” in World Social Report 2020: Inequality in a Rapidly Changing World (United Nations, 2020), pp. 108–126.
-
- Stiglitz J. E., The Price of Inequality (W.W. Norton & Co, ed. 1, 2012).
-
- Piketty T., Capital in the Twenty-First Century, Goldhammer A., translator. (Harvard University Press, 2014).
LinkOut - more resources
Full Text Sources
