. 2022 Apr 4;18(4):e1010416.
doi: 10.1371/journal.ppat.1010416. eCollection 2022 Apr.

NK cells and monocytes modulate primary HTLV-1 infection

Affiliations

NK cells and monocytes modulate primary HTLV-1 infection

Ramona Moles et al. PLoS Pathog. .

Abstract

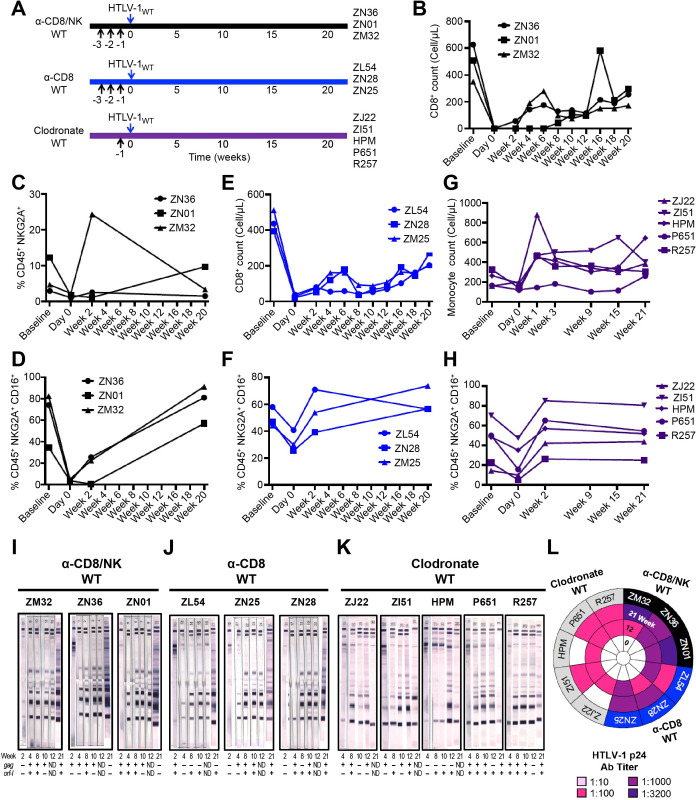
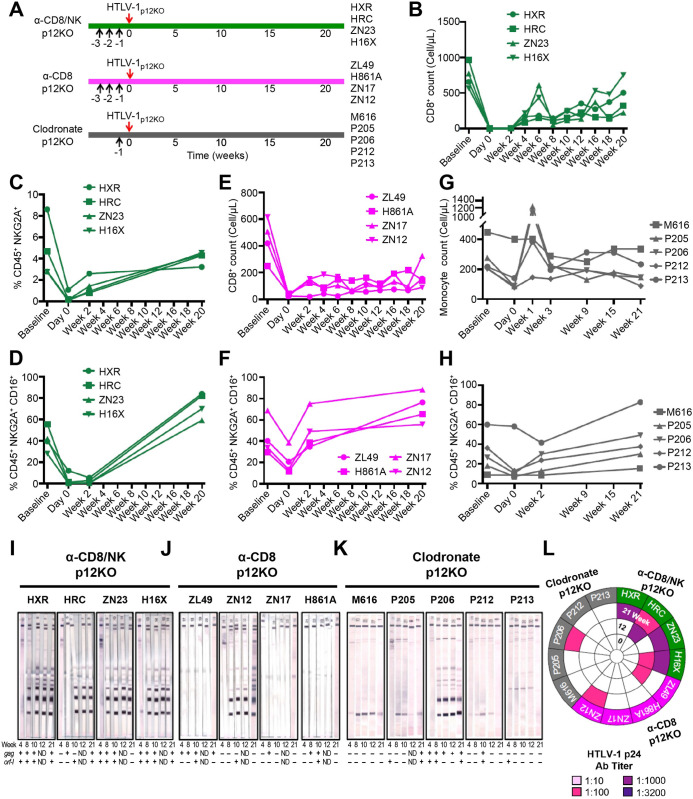
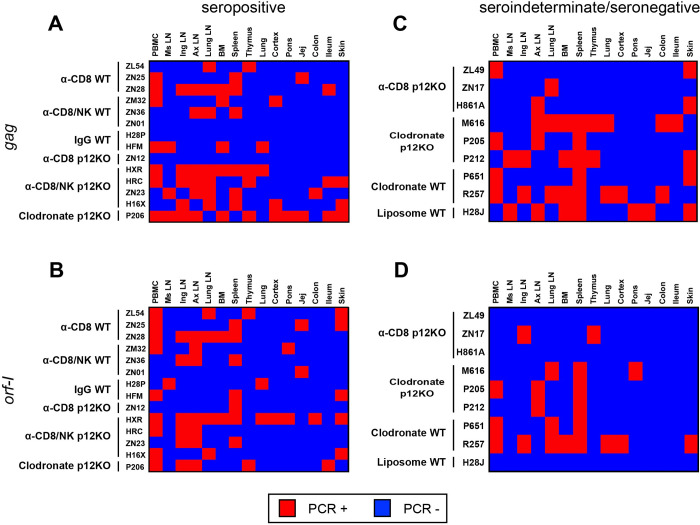
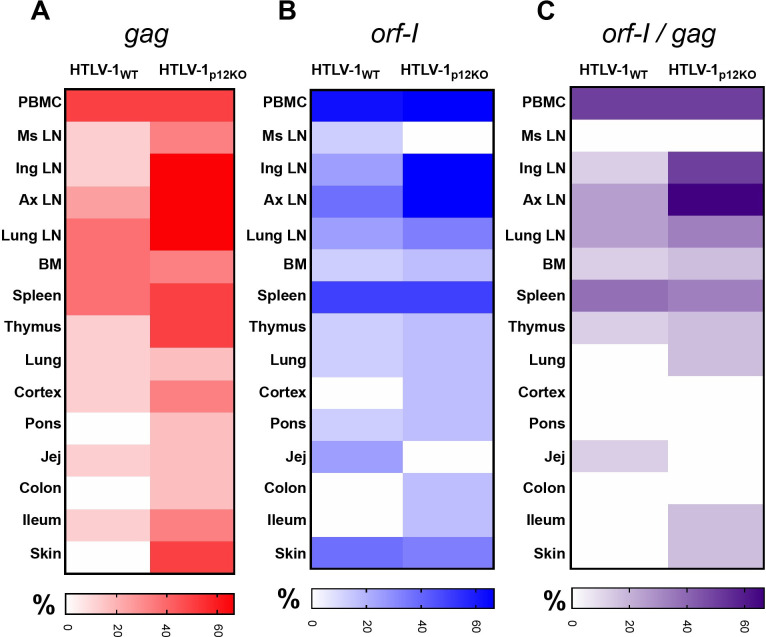
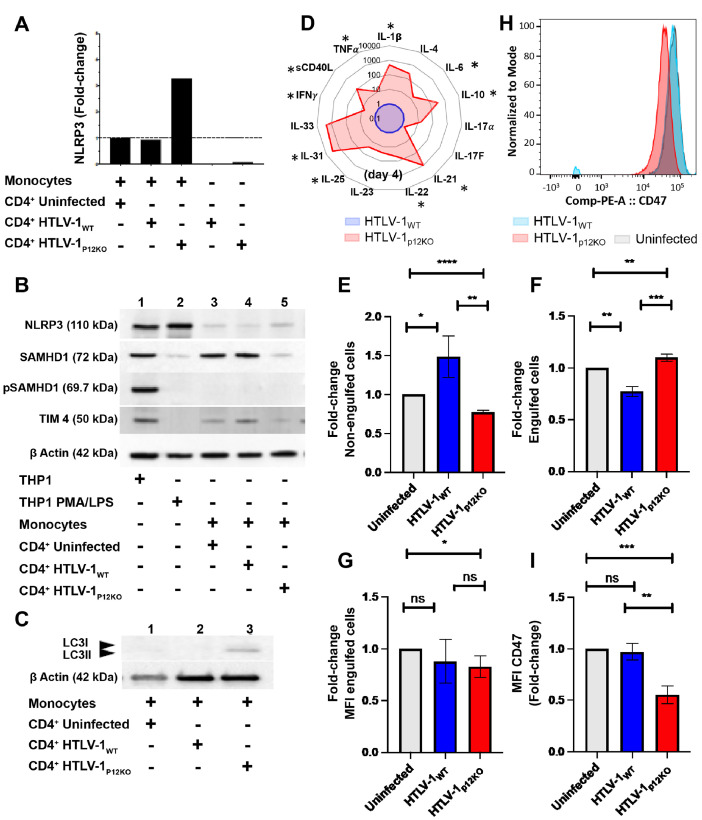
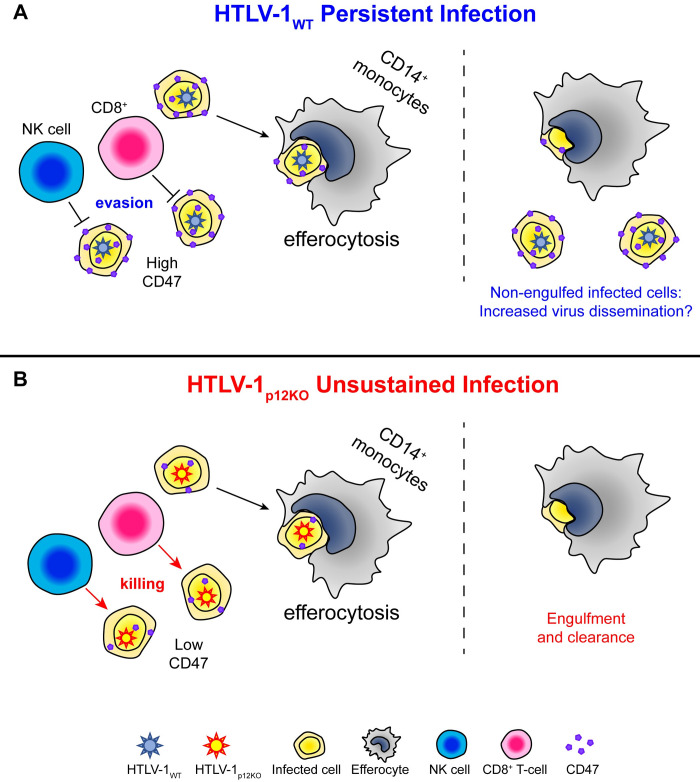
We investigated the impact of monocytes, NK cells, and CD8+ T-cells in primary HTLV-1 infection by depleting cell subsets and exposing macaques to either HTLV-1 wild type (HTLV-1WT) or to the HTLV-1p12KO mutant unable to infect replete animals due to a single point mutation in orf-I that inhibits its expression. The orf-I encoded p8/p12 proteins counteract cytotoxic NK and CD8+ T-cells and favor viral DNA persistence in monocytes. Double NK and CD8+ T-cells or CD8 depletion alone accelerated seroconversion in all animals exposed to HTLV-1WT. In contrast, HTLV-1p12KO infectivity was fully restored only when NK cells were also depleted, demonstrating a critical role of NK cells in primary infection. Monocyte/macrophage depletion resulted in accelerated seroconversion in all animals exposed to HTLV-1WT, but antibody titers to the virus were low and not sustained. Seroconversion did not occur in most animals exposed to HTLV-1p12KO. In vitro experiments in human primary monocytes or THP-1 cells comparing HTLV-1WT and HTLV-1p12KO demonstrated that orf-I expression is associated with inhibition of inflammasome activation in primary cells, with increased CD47 "don't-eat-me" signal surface expression in virus infected cells and decreased monocyte engulfment of infected cells. Collectively, our data demonstrate a critical role for innate NK cells in primary infection and suggest a dual role of monocytes in primary infection. On one hand, orf-I expression increases the chances of viral transmission by sparing infected cells from efferocytosis, and on the other may protect the engulfed infected cells by modulating inflammasome activation. These data also suggest that, once infection is established, the stoichiometry of orf-I expression may contribute to the chronic inflammation observed in HTLV-1 infection by modulating monocyte efferocytosis.


Conflict of interest statement

The authors have declared that no competing interests exist.

Figures

Fig 1
Fig 1. Exacerbation of HTLV-1WT infectivity by depletion of immune cell subsets.
(A) Schematic of study design. Black arrows represent the day of treatments (M-T807R1, CD8ß255R1, or Clodrosome). Blue arrows indicate inoculation day of the lethally irradiated 729.6 cells lymphoblastoid B-cell lines producing HTLV-1WT. (B,E) Absolute CD8+ T-cell numbers shown before (baseline), during (day 0), and after (weeks 2, 4, 6, 8, 10, 12, 16, 18, and 20) the administration of M-T807R1 and CD8β255R1. A complete blood count (CBC) of CD8+ was performed in the (B) α-CD8/NK WT and (E) α-CD8 WT groups inoculated with HTLV-1WT. (C) The frequency of NKG2A+ cells identified as Singlets/Live/CD45+/CD3-CD20-/NKG2A+ was measured before (baseline), during (day 0), and after (weeks 2 and 20) CD8+ cell depletion in peripheral blood of the α-CD8/NK WT group. (D,F,H) Frequency of NKG2A+CD16+ cells identified as Singlets/Live/CD45+/CD3-CD20-/NKG2A+CD16+ before (baseline), during (day 0), and after (weeks 2 and 20) inoculation for the (D) α-CD8/NK WT, (F) α-CD8 WT, and (H) Clodronate WT groups. (G) Absolute monocyte cell numbers shown before (baseline), during (day 0), and after (weeks 1, 3, 9, 15, and 21) the administration of Clodrosome and inoculation with HTLV-1WT. (I,J,K) Sera from the inoculated macaques belonging to (I) α-CD8/NK WT, (J) α-CD8 WT, and (K) Clodronate WT groups were assayed at weeks 2, 4, 8, 10, 12, and 21 for reactivity to HTLV-1 antigens using the kit from HTLV Blot 2.4 Western Blot Assay (MP Diagnostics, Singapore). The animal ID, inoculated viruses, and treatment are indicated above each sample. The week of sera collection is indicated below each western blot strip. Moreover, below each sample a nested PCR amplifying the gag (top row) and orf-I (bottom row) genes was performed in the blood of each animal throughout the course of the study. Positive amplification of either gag or orf-I is symbolized by (+); absence of amplification is symbolized by (-). (L) HTLV-1 p24Gag antibody titer was measured for macaques belonging to α-CD8/NK WT, α-CD8 WT, and Clodronate WT groups at weeks 0, 12, and 21. Dilutions of 1:10, 1:100, 1:1000, and 1:3200 were used and color-coded as reported in the figure.
Fig 2
Fig 2. Restoration of HTLV-1p12KO infectivity by double NK/CD8+ cell depletion.
(A) Schematic of study design. Animals in the α-CD8/NK p12KO and α-CD8 p12KO groups were injected intravenously with M-T807R1 and CD8β255R1 respectively at 5mg/kg per day for three days prior to virus inoculation. Macaques in the Clodronate p12KO group were injected with Clodrosome at 20mg/kg one day prior to virus inoculation. Black arrows represent day of treatment with M-T807R1, CD8β255R1, or Clodrosome as indicated, and red arrows indicate inoculation with the lethally irradiated 729.6 lymphoblastoid B-cell lines producing HTLV-1p12KO. (B,E) Absolute CD8+ T-cell numbers shown before, during, and after the administration of M-T807R1 and CD8β255R1 in the (B) α-CD8/NK p12KO and (E) α-CD8 p12KO groups inoculated with HTLV-1p12KO at baseline, day 0, and after (weeks 2, 4, 6, 8, 10, 12, 16, 18, and 20). (C) Frequency of NKG2A+ cells identified as Singlets/Live/CD45+/CD3-CD20-/NKG2A+ measured before (baseline), during (day 0), and after (weeks 2 and 20) CD8+ cell depletion in peripheral blood of the α-CD8/NK p12KO group. (D,F,H) Frequency of NKG2A+CD16+ cells identified as Singlets/Live/CD45+/CD3-CD20-/NKG2A+CD16+ for the (D) α-CD8/NK p12KO, (F) α-CD8 p12KO, and (H) Clodronate p12KO groups inoculated with HTLV-1p12KO at baseline, day 0, and weeks 2 and 20. (G) Absolute monocyte cell numbers in the Clodronate p12KO group before (baseline), during (day 0), and after (weeks 1, 3, 9, 15, and 21) the inoculation with HTLV-1p12KO. (I,J,K) Sera from the inoculated macaques in (I) α-CD8/NK p12KO, (J) α-CD8 p12KO, and (K) Clodronate p12KO groups tested for reactivity to HTLV-1 antigens during the course of the study (weeks 4, 8, 10, 12, and 21). Animal ID, inoculated viruses, and treatment are indicated above each sample. The week of sera collection is indicated below each western blot strip. Positive amplification of either gag or orf-I in the blood throughout the course of the study is symbolized by (+); absence of amplification is symbolized by (-). (L) HTLV-1 p24Gag antibody titer was measured at weeks 0, 12, and 21. Dilutions of 1:10, 1:100, 1:1000, and 1:3200 were used and color-coded as reported in the figure.
Fig 3
Fig 3. Viral dissemination in infected animals.
(A-D) Heat map of the nested PCR amplifying the gag and orf-I genes in biopsies from the ileum, colon, thymus, skin, jejunum, cortex, lung, spleen, inguinal LN, mesenteric LN, axillary LN, and lung LN, collected at the time of euthanasia following virus inoculation, together with PBMCs and bone marrow for (A,B) seropositive and (C,D) sero-indeterminate/seronegative animals. Genomic DNA was extracted to amplify viral DNA. Nested PCR was performed using primers designed to amplify the gag and orf-I genes (see Materials and Methods). The orf-I PCR products were sequenced to verify HTLV-1p12KO virus versus HTLV-1WT. Positive amplification of either (A,C) gag or (B,D) orf-I by nested PCR is shown in red; absence of amplification is shown in blue.
Fig 4
Fig 4. Viral dissemination in infected animals.
(A,B,C) Heat map charts show the percentage of HTLV-1WT and HTLV-1p12KO inoculated animals with positive amplification for (A) gag (red), (B) orf-I (blue), or (C) both (purple) are shown for the different tissues.
Fig 5
Fig 5. Differences in inflammasome activation and engulfment in monocytes exposed to HTLV-1p12KO and HTLV-1WT infected cells.
(A) NRLP3 mRNA from cDNA of monocytes co-cultivated with CD4+ cells (uninfected), CD4+ HTLV-1WT, and HTLV-1p12KO was assessed by Real-time PCR. Infected CD4+ cells used for the experiment were included in our analysis. Real-time PCR was performed in triplicate and samples were normalized to GAPDH expression. Fold-change was calculated by comparing values with monocytes co-cultivated with uninfected CD4+ normalized NLRP3 expression. (B) Western blot analyses of NLRP3 (110kDa), SAMHD1 (72kDa), pSAMHD1 (69.7kDa), and TIM4 (50kDa) expression from total cellular extracts of monocytes co-cultivated with uninfected CD4+ cells, CD4+ HTLV-1 WT, and CD4+ HTLV-1p12KO. THP-1 cells unstimulated and treated with PMA and LPS were included as controls. Protein loading was assessed by ß-actin expression. (C) Western blot analyses of LC3I/II (14–18 kDa) expression from total cellular extracts of monocytes co-cultivated with uninfected CD4+ cells, CD4+ HTLV-1WT, and CD4+ HTLV-1p12KO. (D) Spider chart of cytokines and chemokines measured in the cryopreserved supernatants from monocytes isolated from four different donors at three days post-co-cultivation. Cytokine level was analyzed using Bio-Plex Pro Human Th17 Cytokine Panel assays. The following targets were assayed according to the manufacturer’s instructions: IL-1β, IL-4, IL-6, IL-10, IL-17A, IL-17F, IL-21, IL-22, IL-23, IL-25, IL-31, IL-33, IFN-γ, TNF-α, and CD40L. The level of cytokines in the supernatant of HTLV-1p12KO exposed monocytes (isolated from four different donors) was graphed in red as a fold-change compared to the HTLV-1WT (blue). The average is shown in the figure. Asterisks (*) indicate cytokines that were found induced in all donors. Efferocytosis assay of THP-1 cells co-cultivated with HTLV-1 WT or HTLV-1p12KO infected cells or uninfected control cells (E,F). The bait cells, THP-1, were labeled with CytoTell Blue. Cells were then seeded in 12 well plates and treated with PMA. THP-1 cells were cultivated for 72 h with effector cells (729.6 cells, 729.6 producing HTLV-1WT, or 729.6 producing HTLV-1p12KO) previously stained with CFSE and lethally γ-irradiated. A well without effector cells was included for compensation and as a gating control. Fold-change of engulfed cells (CytoTell Blue positive and CFSE positive) and non-engulfed (CytoTell Blue negative and CFSE positive) cells were calculated from 3 independent experiments (see S8C Fig for an example of gating and cellular populations). The HTLV-1 proviral loads (PVL) of 729.6 producing HTLV-1WT and HTLV-1p12KO cells were 776% and 262% respectively. The p19Gag produced in the supernatant 729.6 HTLV-1WT and HTLV-1p12KO in 24 h measured 2832 and 939 pg/ml respectively. (G) Mean Fluorescent Intensity (MFI) of engulfed cells. Unpaired t-test was used for statistical evaluation. (H) CD47 staining of 729.6 cells, 729.6 HTLV-1WT and 726.9 HTLV-1p12KO cell lines. (I) Fold-change of MFI CD47 was calculated from 3 independent experiments. Unpaired t-test was used for statistical evaluation.
Fig 6
Fig 6. Role of orf-I gene and immune cells in primary HTLV-1 infection.
(A) Graphical representation of how HTLV-1WT infected cells escape immune recognition by counteracting cytocidal NK and CTL activity via downregulation of ICAM-1, ICAM-2 [49], and MHC- I [56] and partly elude efferocytosis via orf-I upregulation of the “don’t-eat-me” CD47 molecule as demonstrated in the current work. (B) The absence of orf-I expression would result in lower CD47 expression on the surface of HTLV-1p12KO infected cells and susceptibility of infected cells to both NK cells and CTLs as well as to efferocytosis, explaining the inability of this mutant virus to persist in the host.

References

    1. Gessain A, Barin F, Vernant JC, Gout O, Maurs L, Calender A, et al.. Antibodies to human T-lymphotropic virus type-I in patients with tropical spastic paraparesis. Lancet. 1985;2(8452):407–10. doi: 10.1016/s0140-6736(85)92734-5 - DOI - PubMed
    1. Gallo RC. HTLV: the family of human T-lymphotropic retroviruses and their role in leukemia and AIDS. Med Oncol Tumor Pharmacother. 1986;3(3–4):265–7. doi: 10.1007/BF02935003 - DOI - PubMed
    1. Yoshida M, Miyoshi I, Hinuma Y. Isolation and characterization of retrovirus from cell lines of human adult T-cell leukemia and its implication in the disease. Proc Natl Acad Sci U S A. 1982;79(6):2031–5. doi: 10.1073/pnas.79.6.2031 - DOI - PMC - PubMed
    1. Poiesz BJ, Ruscetti FW, Reitz MS, Kalyanaraman VS, Gallo RC. Isolation of a new type C retrovirus (HTLV) in primary uncultured cells of a patient with Sezary T-cell leukaemia. Nature. 1981;294(5838):268–71. doi: 10.1038/294268a0 - DOI - PubMed
    1. Poiesz BJ, Ruscetti FW, Mier JW, Woods AM, Gallo RC. T-cell lines established from human T-lymphocytic neoplasias by direct response to T-cell growth factor. Proc Natl Acad Sci U S A. 1980;77(11):6815–9. doi: 10.1073/pnas.77.11.6815 - DOI - PMC - PubMed

Publication types