

Caveolin-3 prevents swelling-induced membrane damage via regulation of ICl,swell activity
- PMID: 35378081
- PMCID: PMC9117929
- DOI: 10.1016/j.bpj.2022.04.001
Caveolin-3 prevents swelling-induced membrane damage via regulation of ICl,swell activity
Abstract
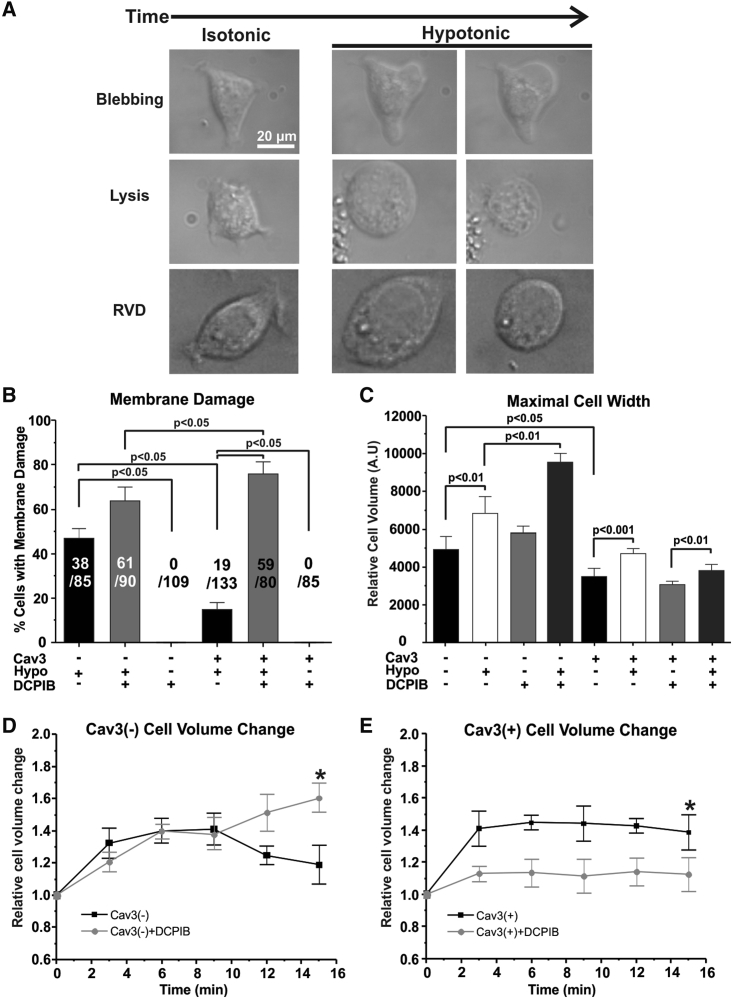
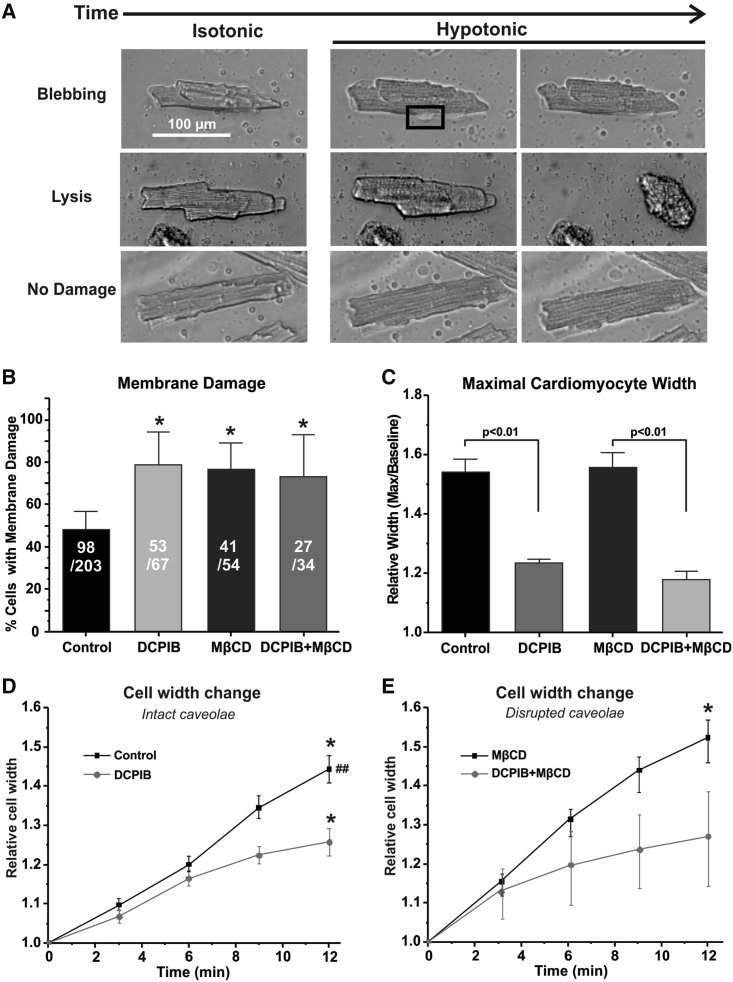
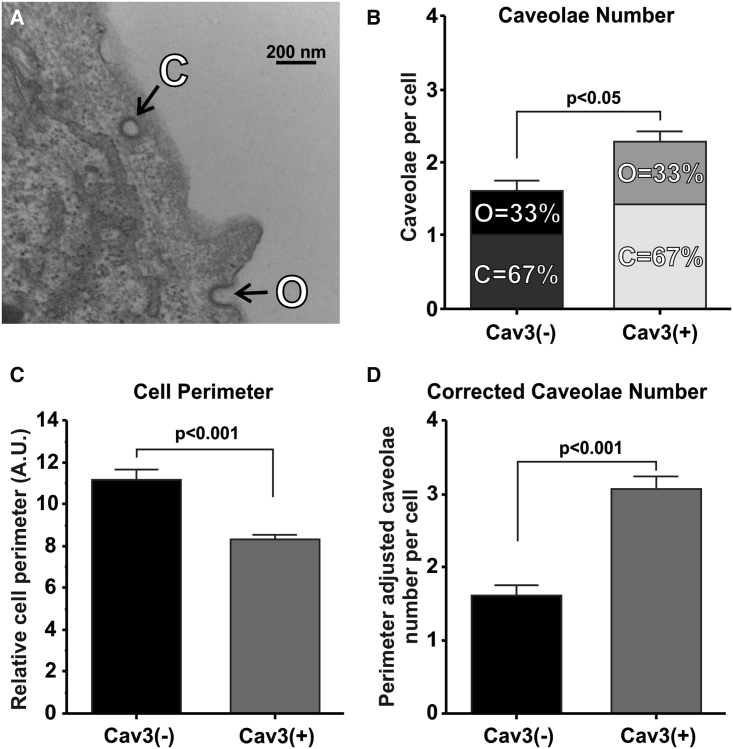
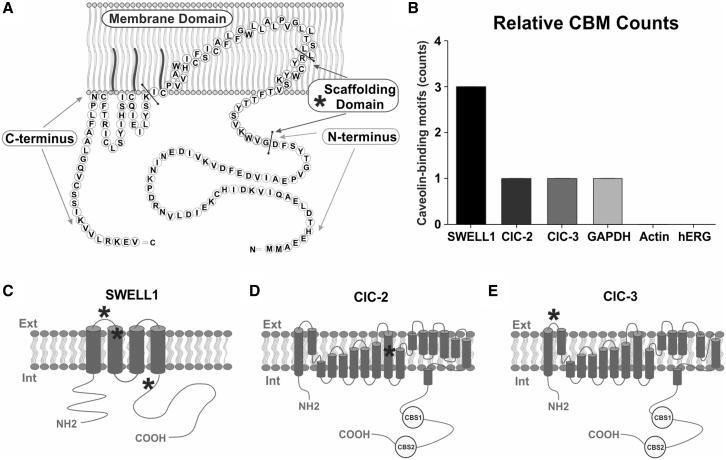
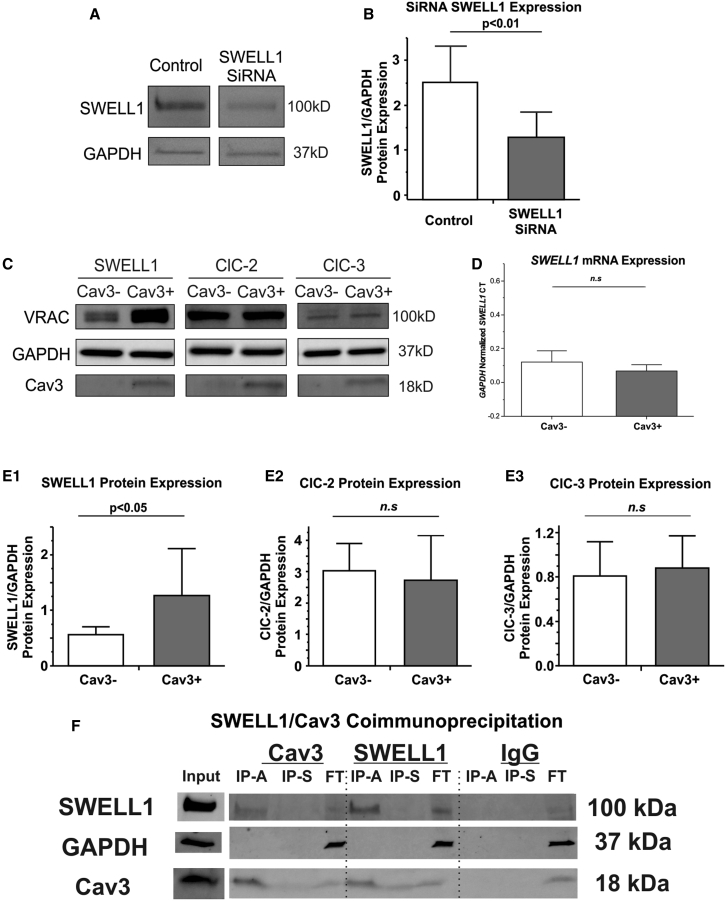
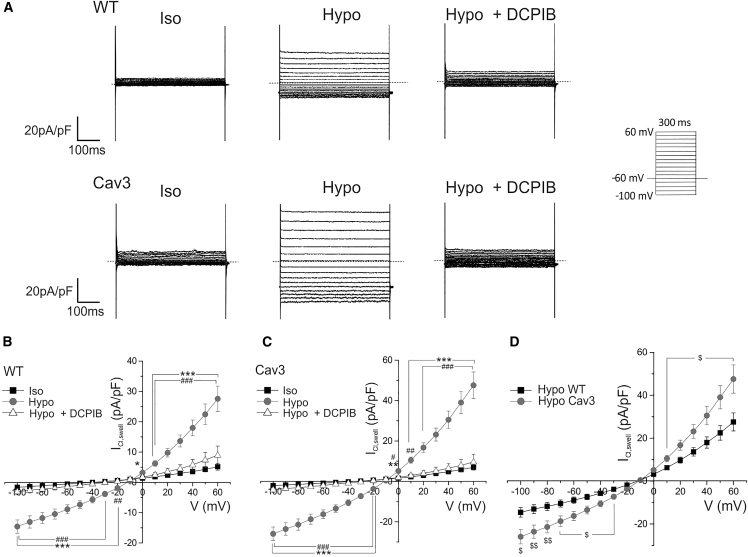
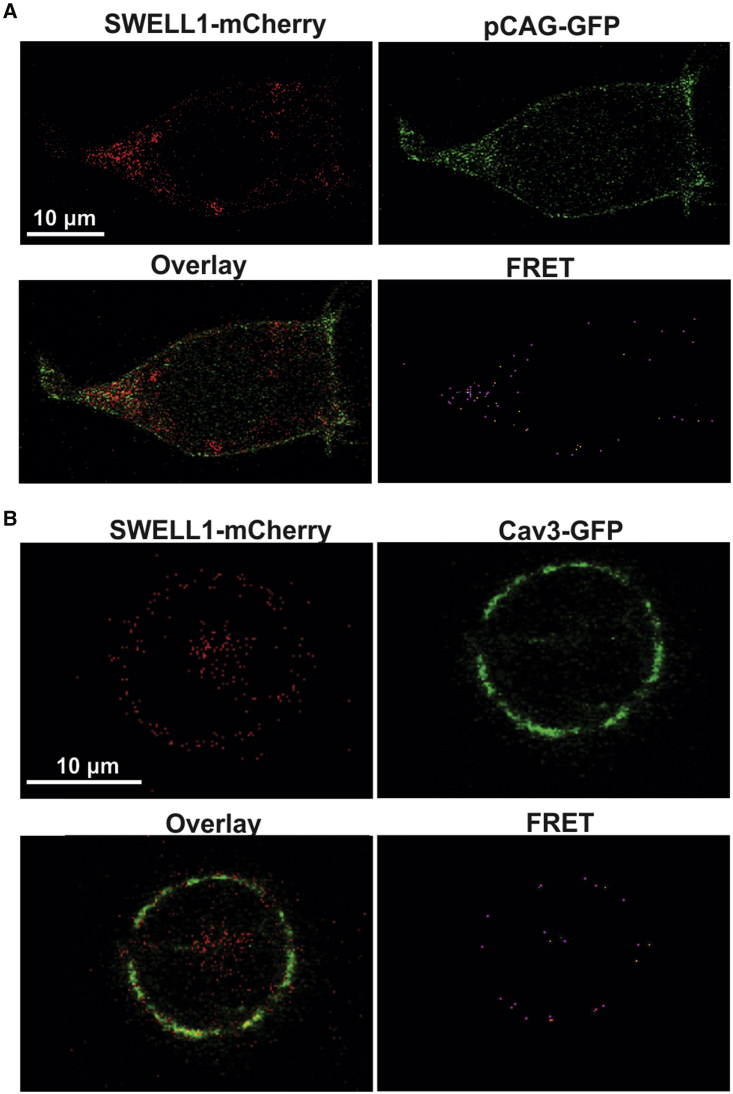
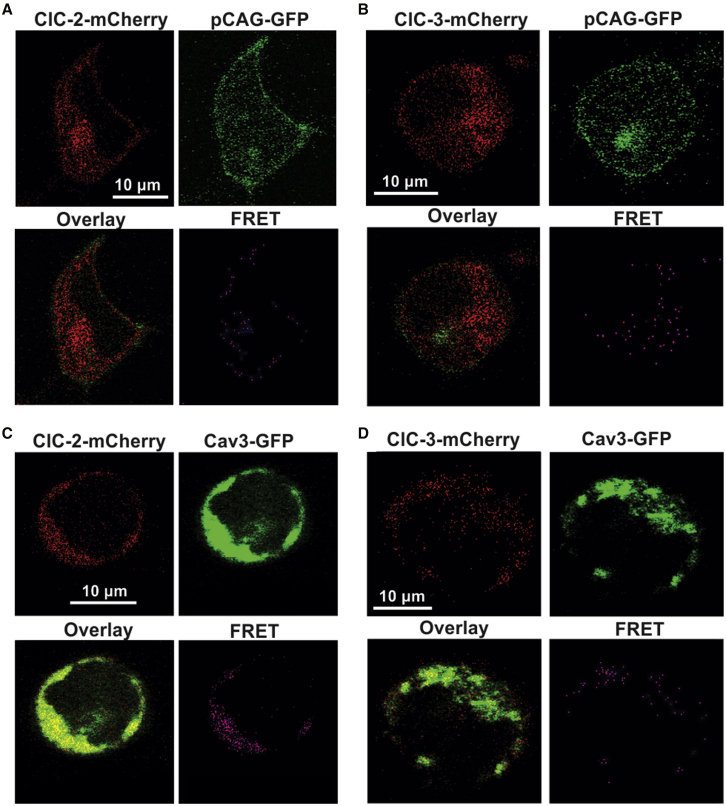
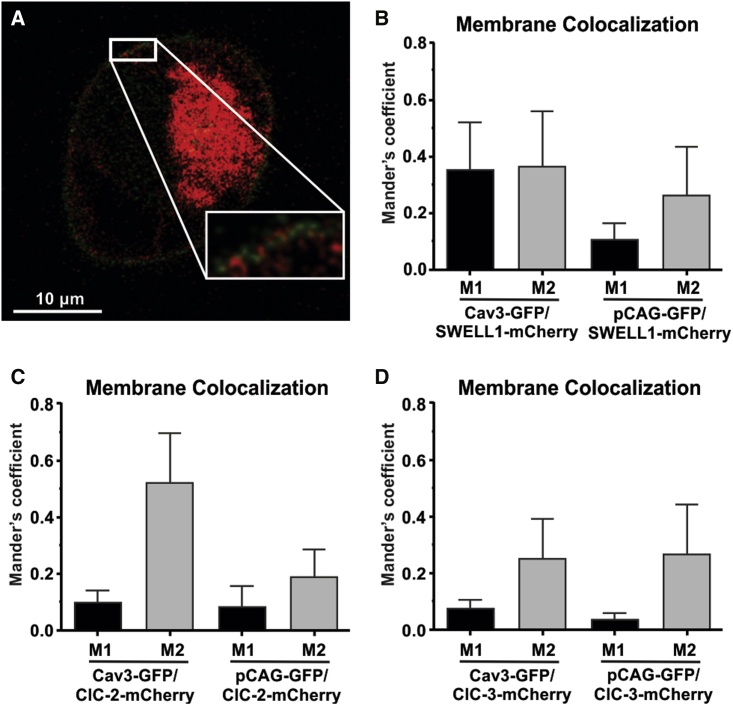
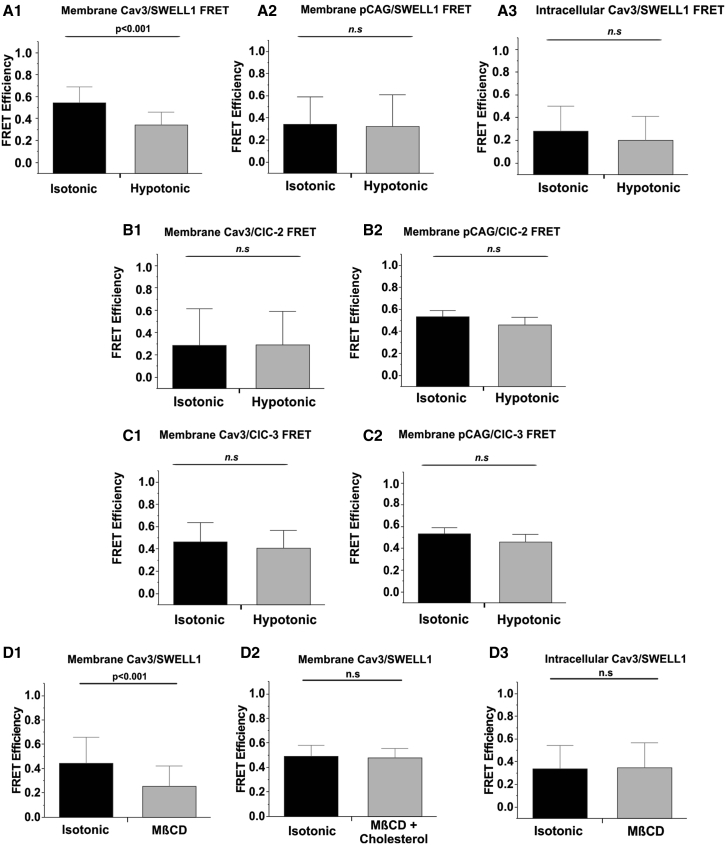
Caveola membrane structures harbor mechanosensitive chloride channels (MCCs; including chloride channel 2, chloride channel 3, and SWELL1, also known as LRRC8A) that form a swelling-activated chloride current (ICl,swell) and play an important role in cell volume regulation and mechanoelectrical signal transduction. However, the role of the muscle-specific caveolar scaffolding protein caveolin-3 (Cav3) in regulation of MCC expression, activity, and contribution to membrane integrity in response to mechanical stress remains unclear. Here we showed that Cav3-transfected (Cav3-positive) HEK293 cells were significantly resistant to extreme (<20 milliosmole) hypotonic swelling compared with native (Cav3-negative) HEK293 cells; the percentage of cells with membrane damage decreased from 45% in Cav3-negative cells to 17% in Cav3-positive cells (p < 0.05). This mechanoprotection was significantly reduced (p < 0.05) when cells were exposed to the ICl,swell-selective inhibitor 4-[(2-butyl-6,7-dichloro-2-cyclopentyl-2,3-dihydro-1-oxo-1H-inden-5-yl)oxy]butanoic acid (10 μM). These results were recapitulated in isolated mouse ventricular myocytes, where the percentage of cardiomyocytes with membrane damage increased from 47% in control cells to 78% in 4-[(2-butyl-6,7-dichloro-2-cyclopentyl-2,3-dihydro-1-oxo-1H-inden-5-yl)oxy]butanoic acid-treated cells (p < 0.05). A higher resistance to hypotonic swelling in Cav3-positive HEK293 cells was accompanied by a significant twofold increase of ICl,swell current density and SWELL1 protein expression, whereas ClC-2/3 protein levels remained unchanged. Förster resonance energy transfer analysis showed a less than 10-nm membrane and intracellular association between Cav3 and SWELL1. Cav3/SWELL1 membrane Förster resonance energy transfer efficiency was halved in mild (220 milliosmole) hypotonic solution as well as after disruption of caveola structures via cholesterol depletion by 1-h treatment with 10 mM methyl-β-cyclodextrin. A close association between Cav3 and SWELL1 was confirmed by co-immunoprecipitation analysis. Our findings indicate that, in the MCCs tested, SWELL1 abundance and activity are regulated by Cav3 and that their association relies on membrane tension and caveola integrity. This study highlights the mechanoprotective role of Cav3, which is facilitated by complimentary SWELL1 expression and activity.
Copyright © 2022 Biophysical Society. Published by Elsevier Inc. All rights reserved.
Figures
Similar articles
-
Swelling-activated Cl- currents and intracellular CLC-3 are involved in proliferation of human pulmonary artery smooth muscle cells.J Hypertens. 2014 Feb;32(2):318-30. doi: 10.1097/HJH.0000000000000013. J Hypertens. 2014. PMID: 24284495
-
Caveolae-Mediated Activation of Mechanosensitive Chloride Channels in Pulmonary Veins Triggers Atrial Arrhythmogenesis.J Am Heart Assoc. 2019 Oct 15;8(20):e012748. doi: 10.1161/JAHA.119.012748. Epub 2019 Oct 10. J Am Heart Assoc. 2019. PMID: 31597508 Free PMC article.
-
Caveolae act as membrane reserves which limit mechanosensitive I(Cl,swell) channel activation during swelling in the rat ventricular myocyte.PLoS One. 2009 Dec 14;4(12):e8312. doi: 10.1371/journal.pone.0008312. PLoS One. 2009. PMID: 20011535 Free PMC article.
-
Swelling- and Stretch-activated Chloride Channels in the Heart: Regulation and Function.In: Kamkin A, Kiseleva I, editors. Mechanosensitivity in Cells and Tissues. Moscow: Academia; 2005. In: Kamkin A, Kiseleva I, editors. Mechanosensitivity in Cells and Tissues. Moscow: Academia; 2005. PMID: 21290764 Free Books & Documents. Review.
-
Recent insights on the impact of SWELL1 on metabolic syndromes.Front Pharmacol. 2025 Mar 21;16:1552176. doi: 10.3389/fphar.2025.1552176. eCollection 2025. Front Pharmacol. 2025. PMID: 40191429 Free PMC article. Review.
Cited by
-
Ion Channel Regulation in Caveolae and Its Pathological Implications.Cells. 2025 Apr 24;14(9):631. doi: 10.3390/cells14090631. Cells. 2025. PMID: 40358155 Free PMC article. Review.
-
Neutral sphingomyelinase regulates mechanotransduction in human engineered cardiac tissues and mouse hearts.J Physiol. 2024 Sep;602(18):4387-4407. doi: 10.1113/JP284807. Epub 2023 Oct 27. J Physiol. 2024. PMID: 37889115
-
Mechanisms of stretch-induced electro-anatomical remodeling and atrial arrhythmogenesis.J Mol Cell Cardiol. 2024 Aug;193:11-24. doi: 10.1016/j.yjmcc.2024.05.011. Epub 2024 May 24. J Mol Cell Cardiol. 2024. PMID: 38797242 Free PMC article. Review.
-
LRRC8A/PKC/FLNA pathway activation is detrimental to colon cancer patients.Funct Integr Genomics. 2025 Jun 27;25(1):138. doi: 10.1007/s10142-025-01650-w. Funct Integr Genomics. 2025. PMID: 40576693
References
-
- Egorov Y.V., Lang D., et al. Glukhov A.V. Caveolae-mediated activation of mechanosensitive chloride channels in pulmonary veins triggers atrial arrhythmogenesis. J. Am. Heart Assoc. 2019;8:e012748. doi: 10.1161/JAHA.119.012748. https://www.ncbi.nlm.nih.gov/pubmed/31597508 - DOI - PMC - PubMed
-
- Trouet D., Hermans D., et al. Eggermont J. Inhibition of volume-regulated anion channels by dominant-negative caveolin-1. Biochem. Biophys. Res. Commun. 2001;284:461–465. doi: 10.1006/bbrc.2001.4995. https://www.ncbi.nlm.nih.gov/pubmed/11394902 - DOI - PubMed
-
- Trouet D., Nilius B., et al. Eggermont J. Caveolin-1 modulates the activity of the volume-regulated chloride channel. J. Physiol. 1999;520 Pt 1:113–119. http://www.ncbi.nlm.nih.gov/pubmed/10517805 - PMC - PubMed
-
- Eggermont J., Trouet D., et al. Nilius B. Cellular function and control of volume-regulated anion channels. Cell Biochem Biophys. 2001;35:263–274. doi: 10.1385/CBB:35:3:263. https://www.ncbi.nlm.nih.gov/pubmed/11894846 - DOI - PubMed
-
- Parton R.G., del Pozo M.A. Caveolae as plasma membrane sensors, protectors and organizers. Nat. Rev. Mol. Cell Biol. 2013;14:98–112. doi: 10.1038/nrm3512. https://www.ncbi.nlm.nih.gov/pubmed/23340574 - DOI - PubMed
Publication types
MeSH terms
Substances
Grants and funding
LinkOut - more resources
Full Text Sources
