. 2022 Sep;77(3):748-760.
doi: 10.1016/j.jhep.2022.03.010. Epub 2022 Apr 1.

Metformin treatment rescues CD8+ T-cell response to immune checkpoint inhibitor therapy in mice with NAFLD

Affiliations

Metformin treatment rescues CD8+ T-cell response to immune checkpoint inhibitor therapy in mice with NAFLD

Simon Wabitsch et al. J Hepatol. 2022 Sep.

Abstract

Background & aims: Non-alcoholic steatohepatitis (NASH) represents the fastest growing underlying cause of hepatocellular carcinoma (HCC) and has been shown to impact immune effector cell function. The standard of care for the treatment of advanced HCC is immune checkpoint inhibitor (ICI) therapy, yet NASH may negatively affect the efficacy of ICI therapy in HCC. The immunologic mechanisms underlying the impact of NASH on ICI therapy remain unclear.

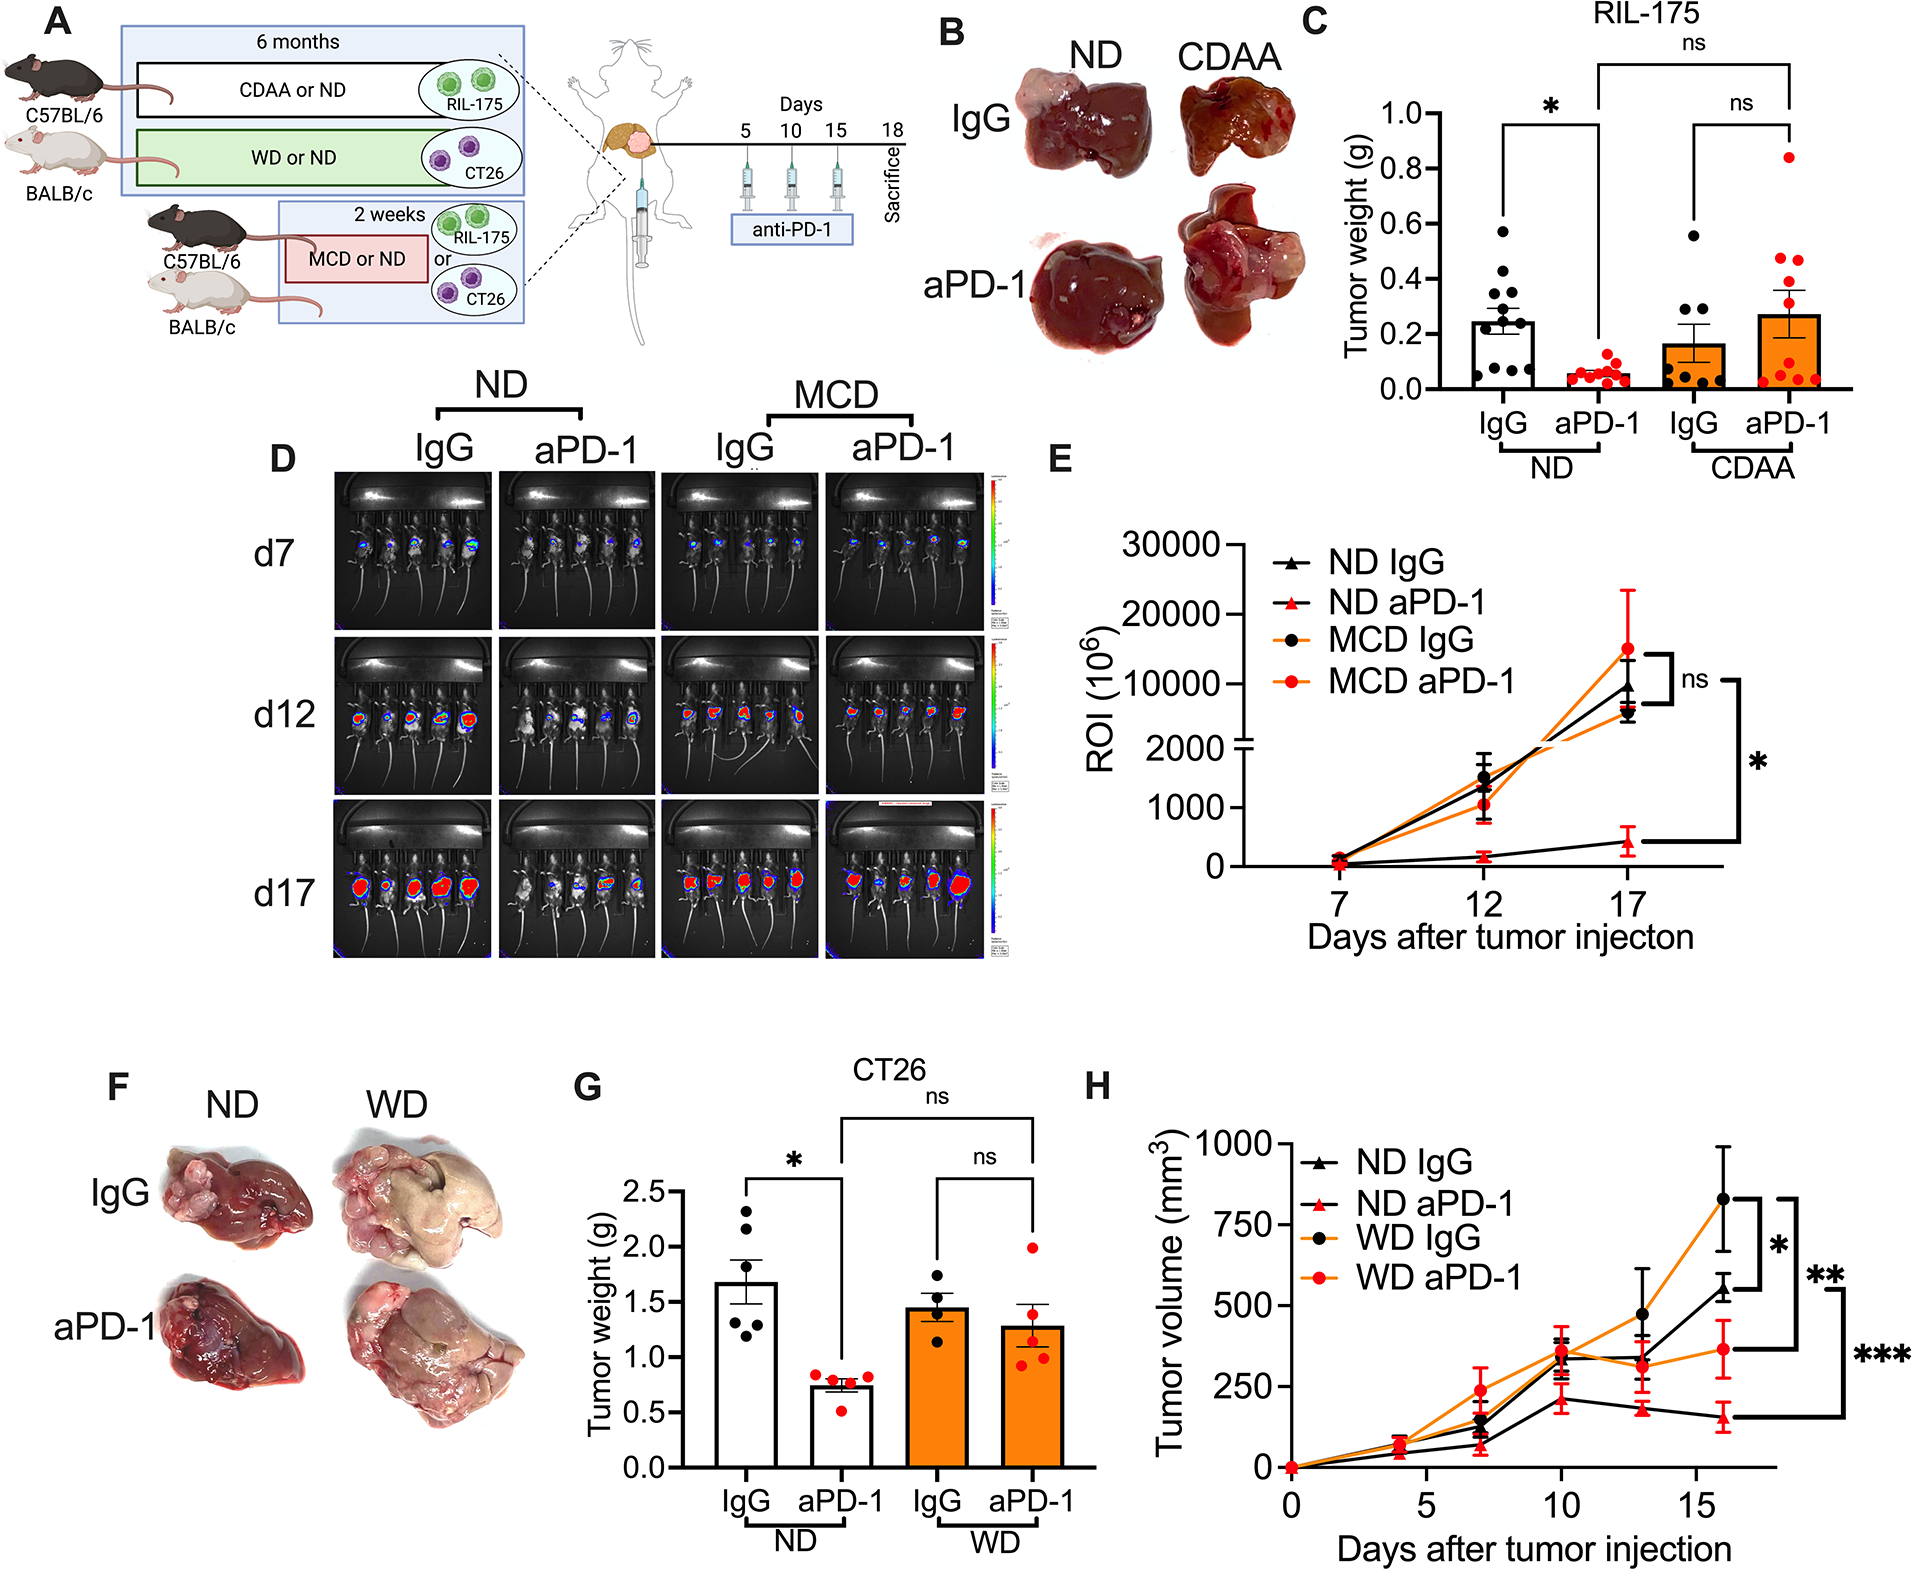
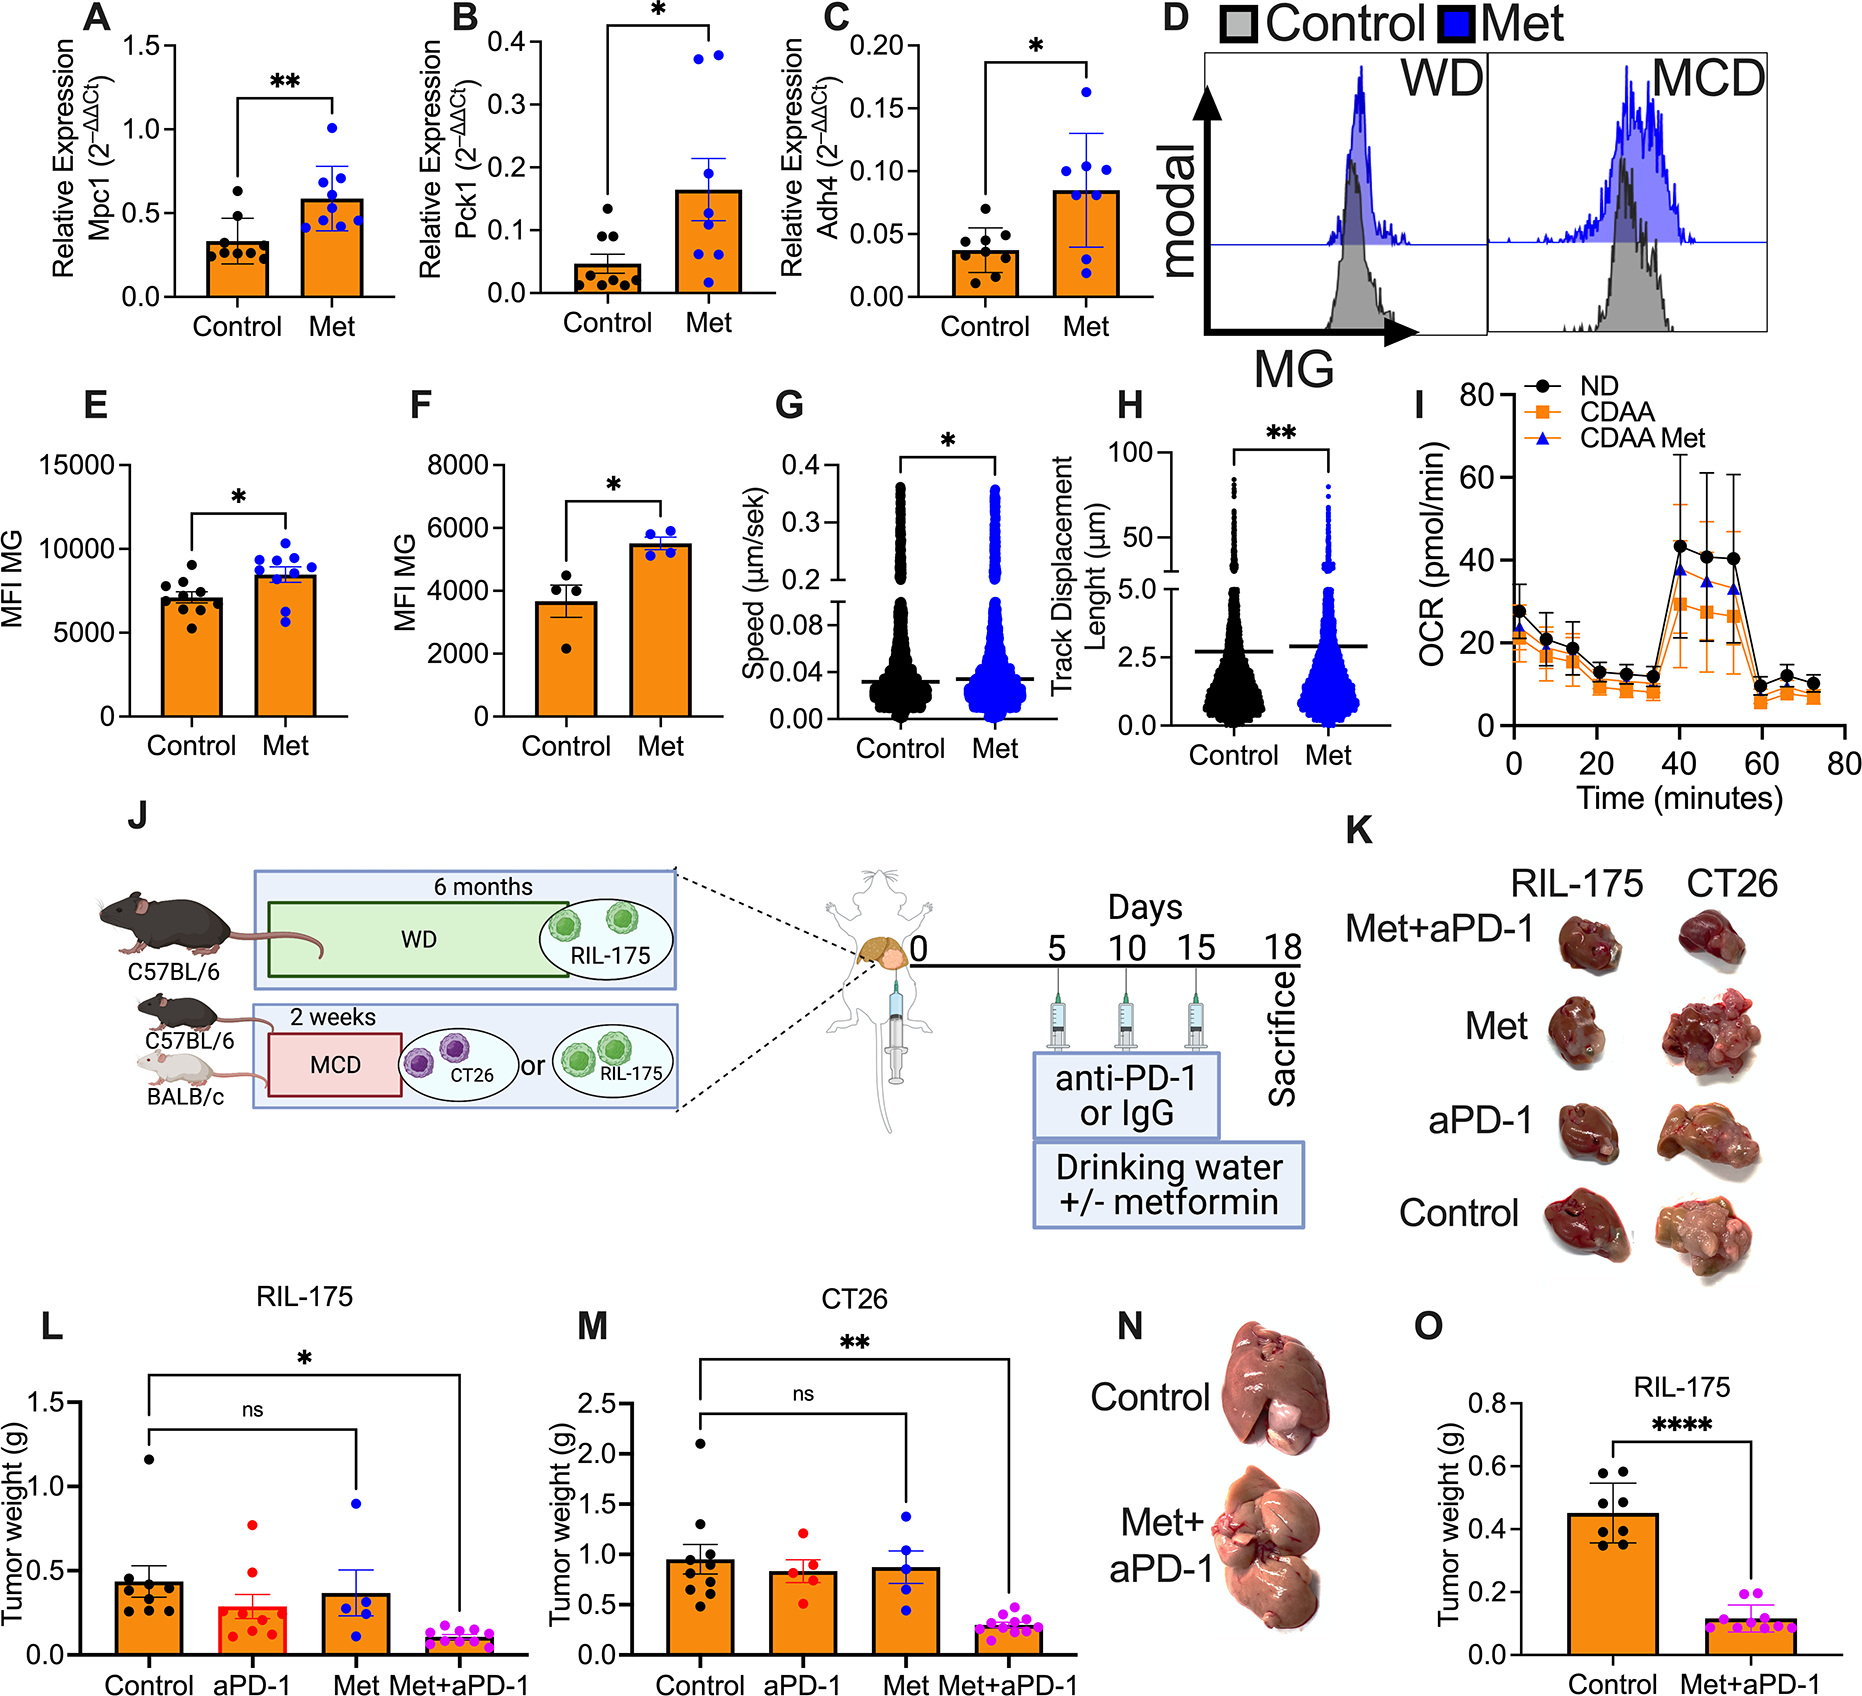
Methods: Herein, using multiple murine NASH models, we analysed the influence of NASH on the CD8+ T-cell-dependent anti-PD-1 responses against liver cancer. We characterised CD8+ T cells' transcriptomic, functional, and motility changes in mice receiving a normal diet (ND) or a NASH diet.

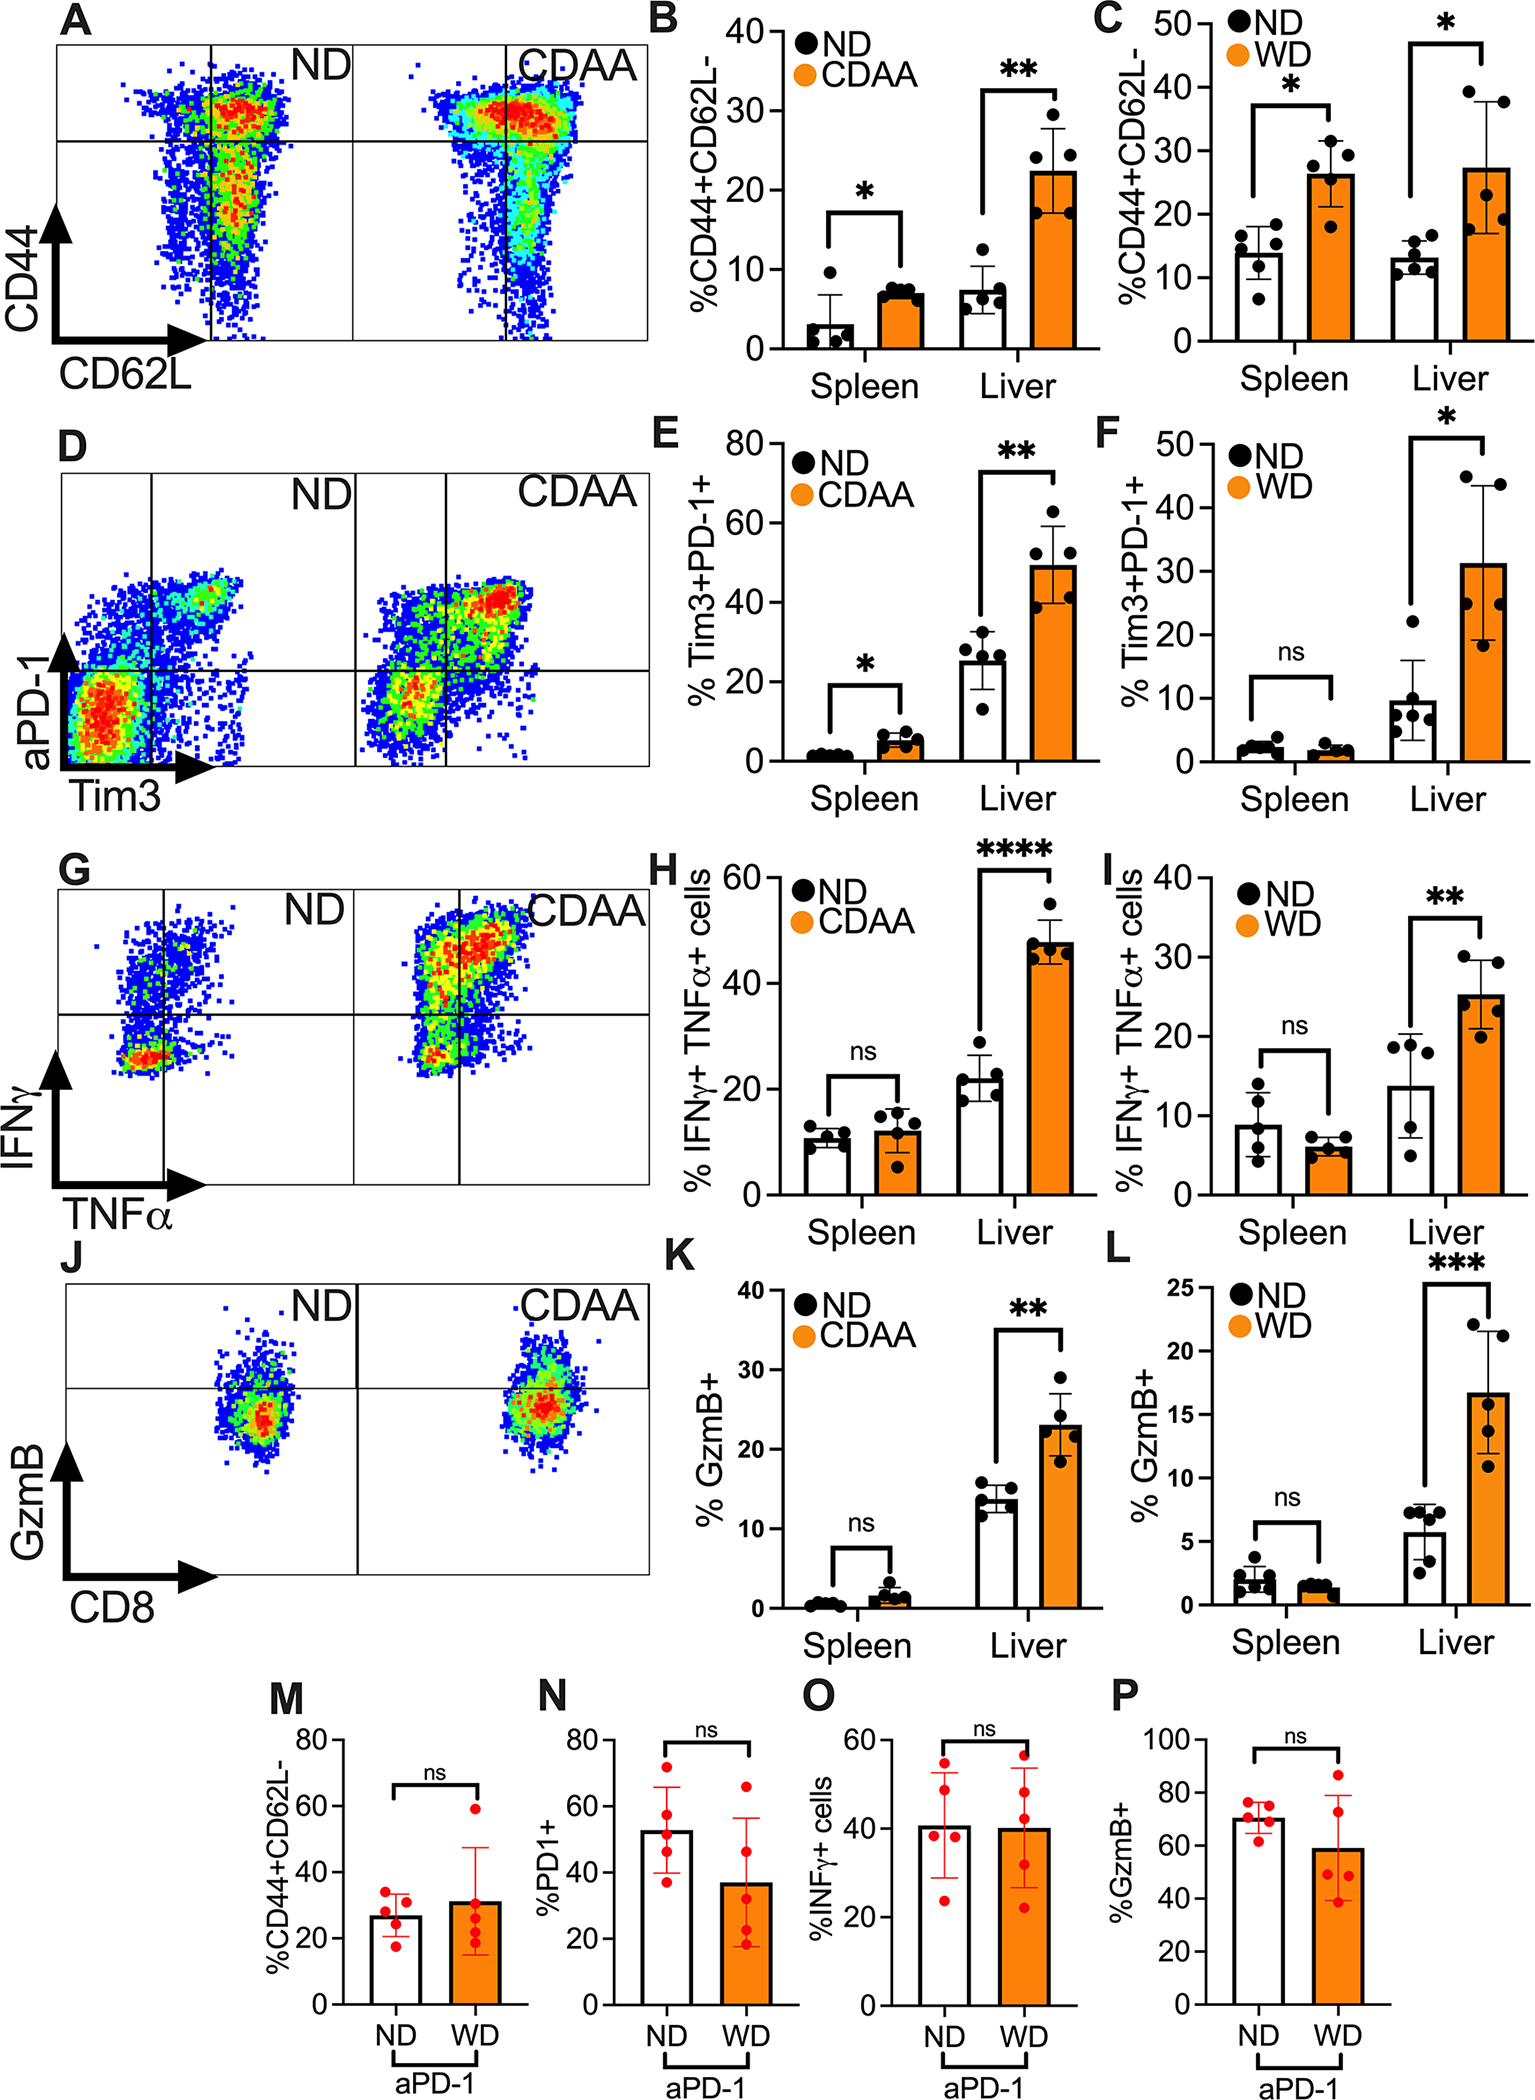
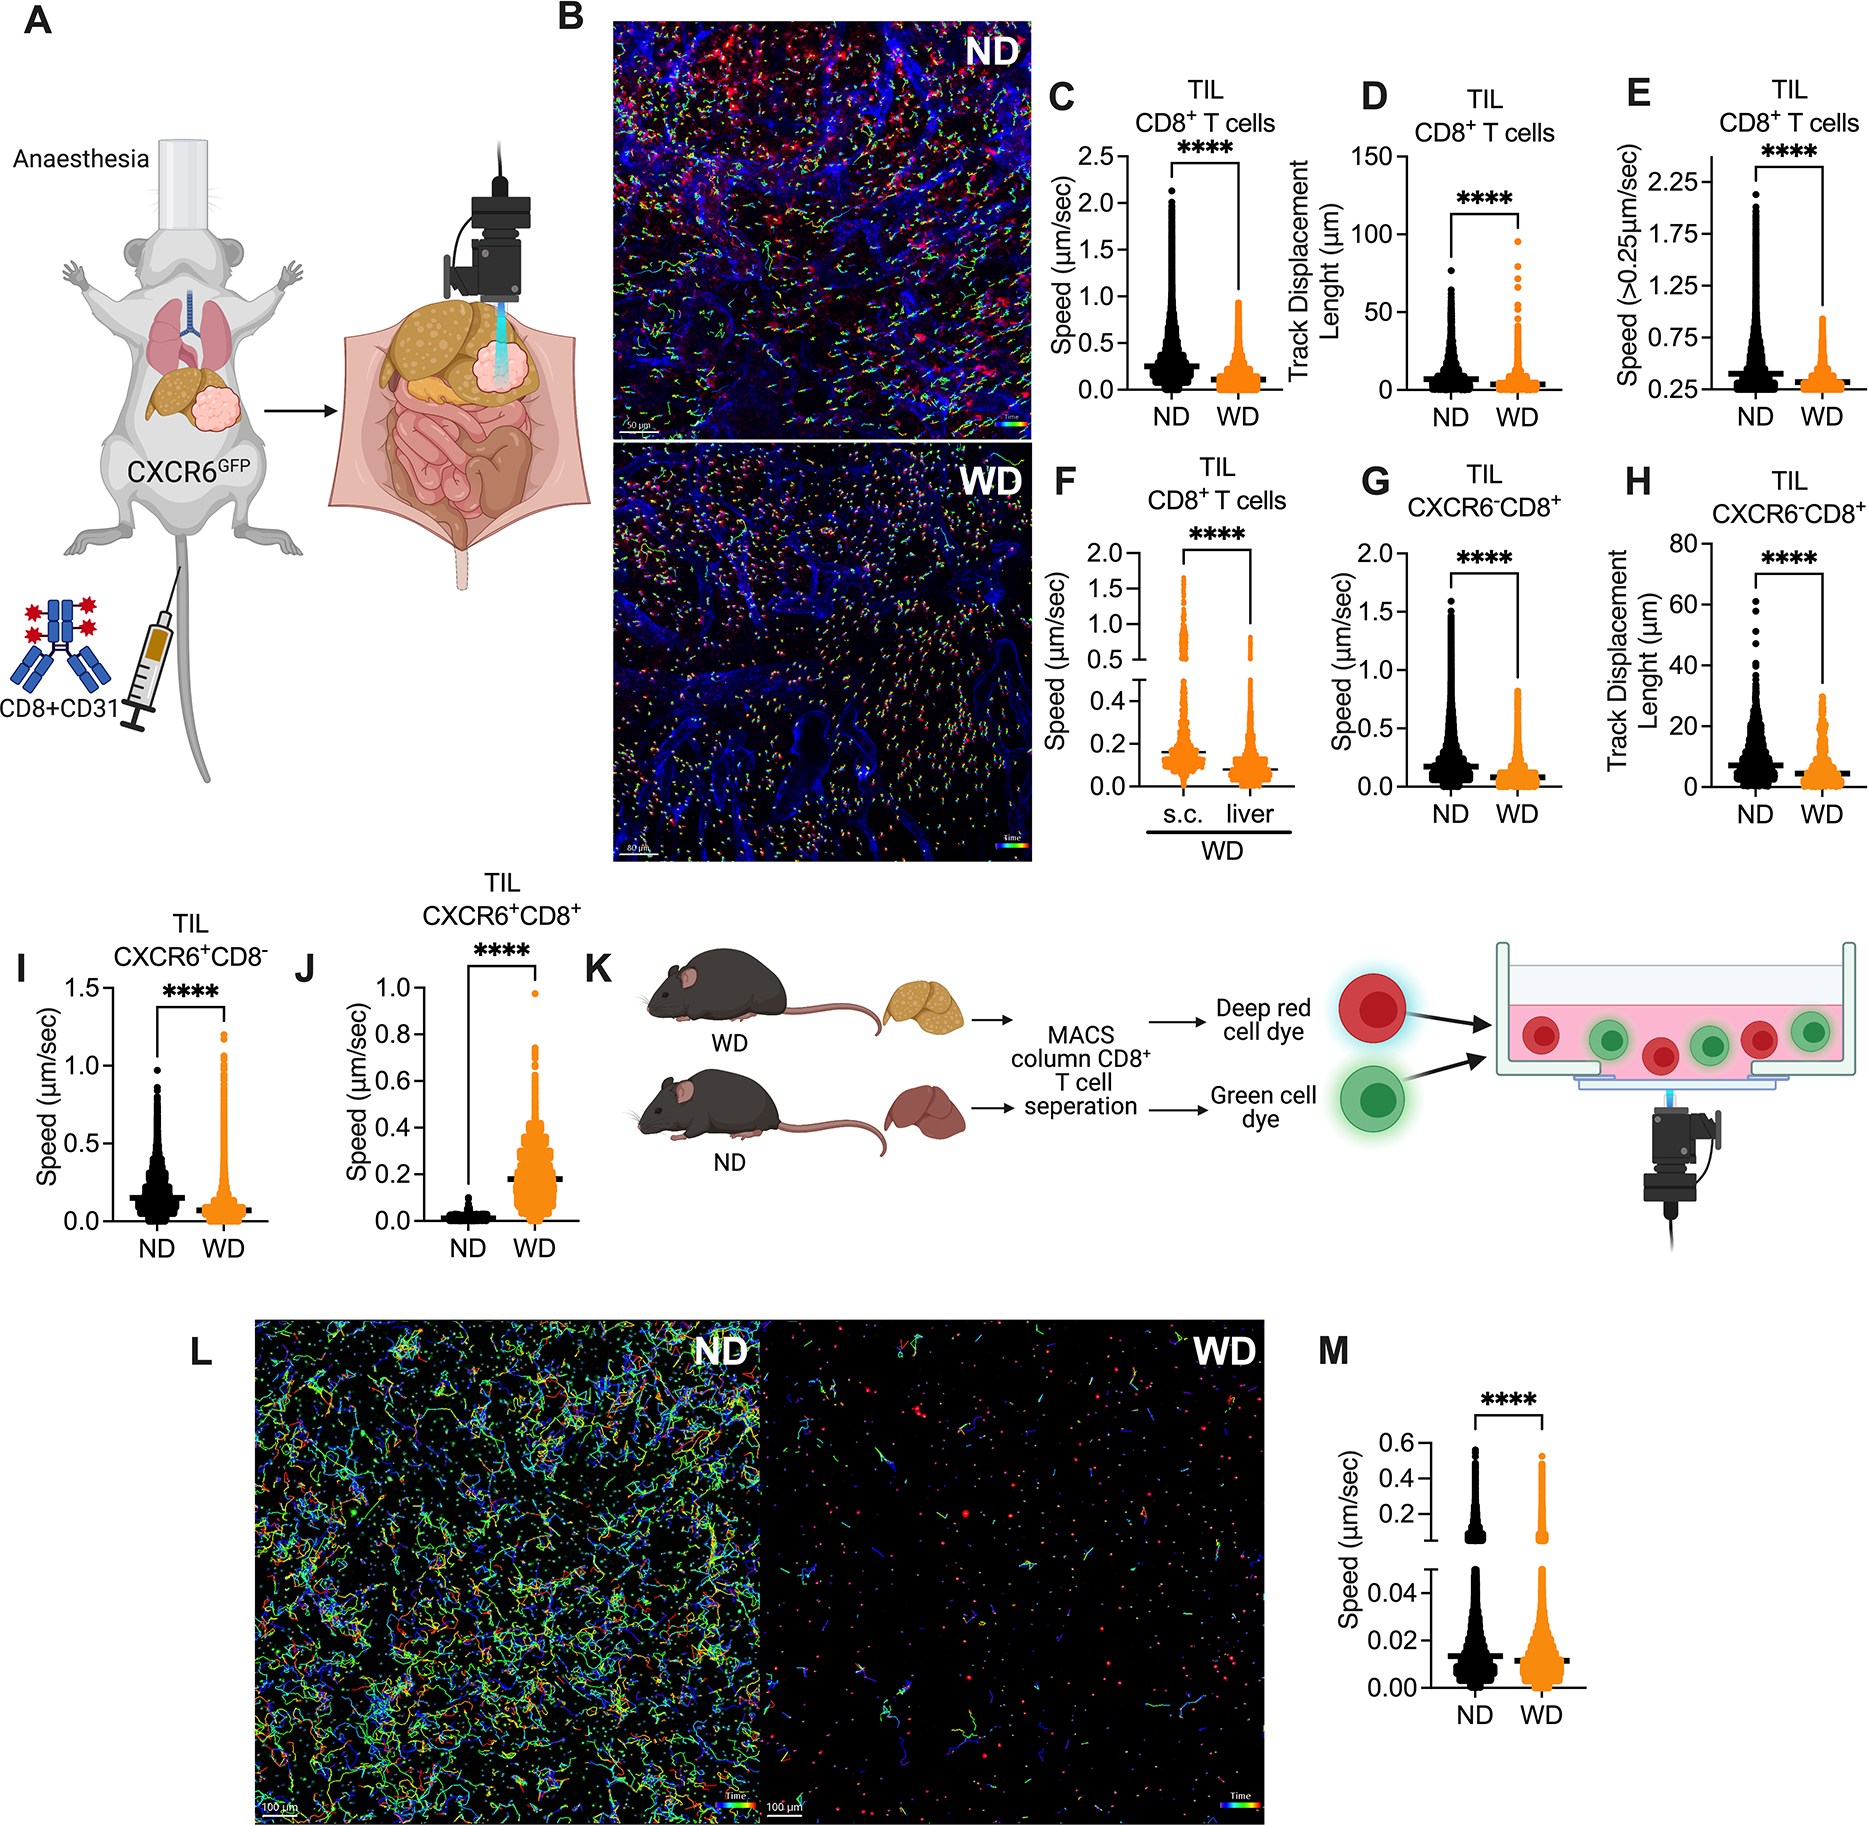
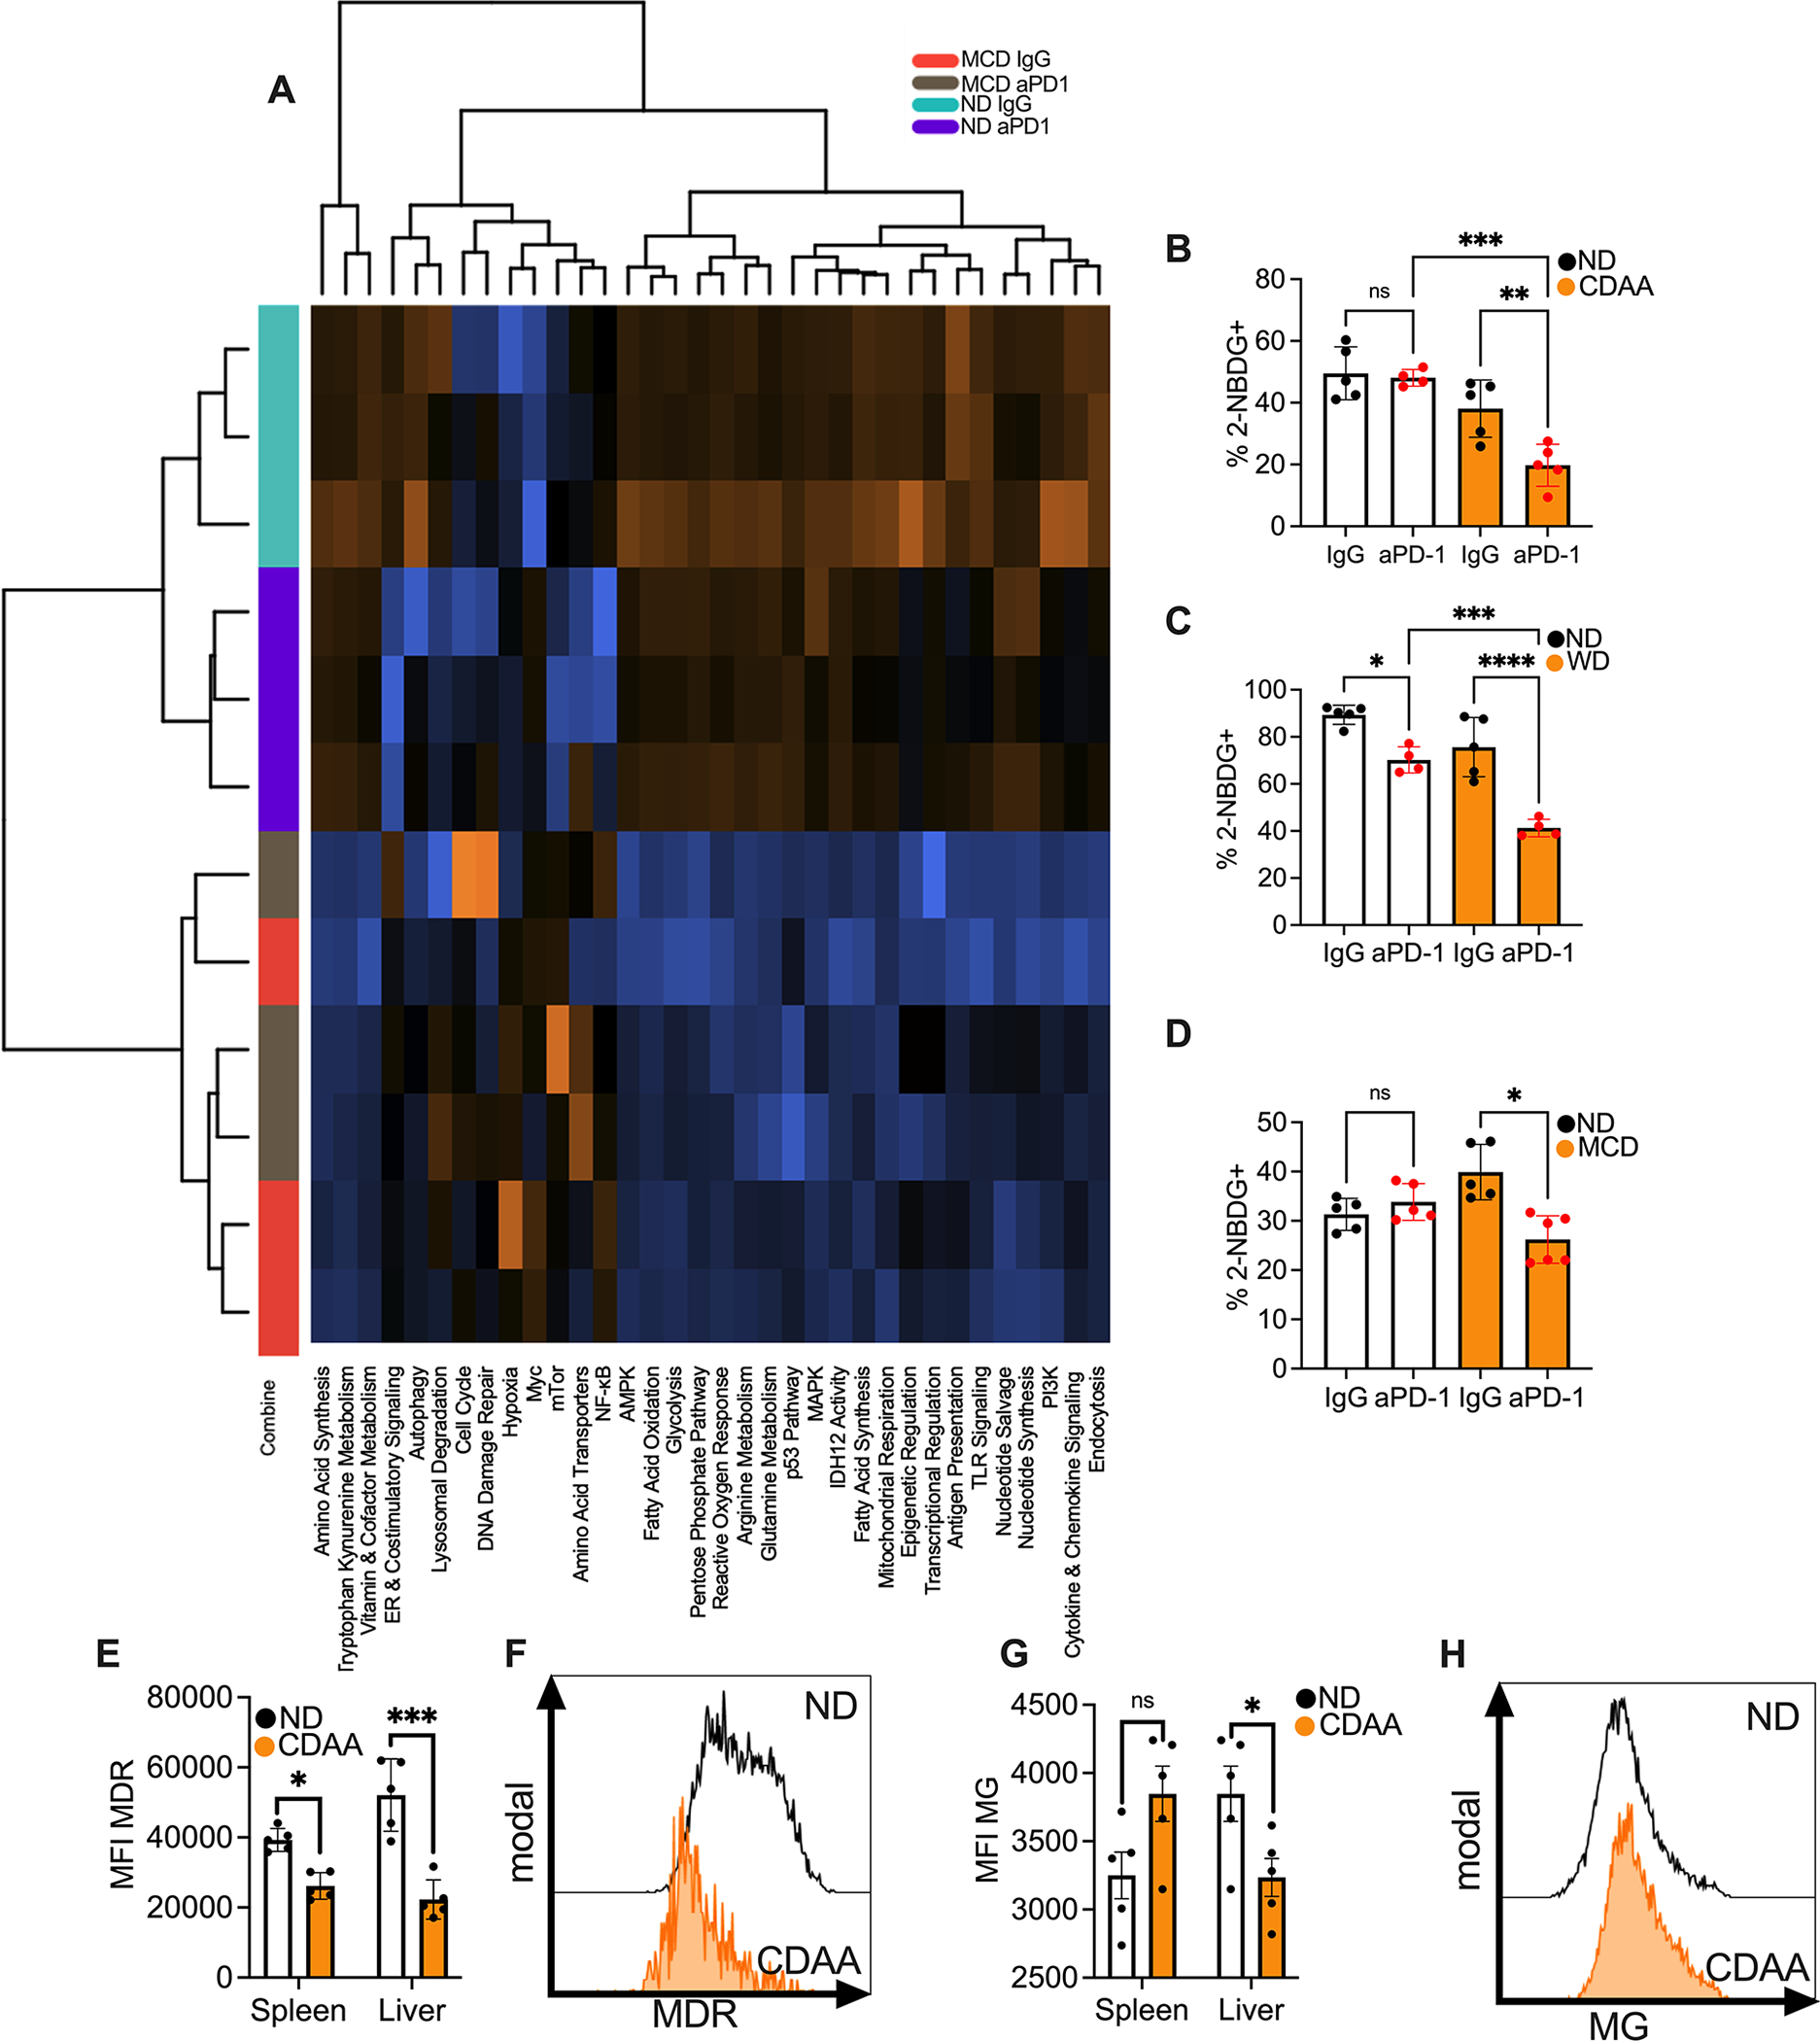
Results: NASH blunted the effect of anti-PD-1 therapy against liver cancers in multiple murine models. NASH caused a proinflammatory phenotypic change of hepatic CD8+ T cells. Transcriptomic analysis revealed changes related to NASH-dependent impairment of hepatic CD8+ T-cell metabolism. In vivo imaging analysis showed reduced motility of intratumoural CD8+ T cells. Metformin treatment rescued the efficacy of anti-PD-1 therapy against liver tumours in NASH.

Conclusions: We discovered that CD8+ T-cell metabolism is critically altered in the context of NASH-related liver cancer, impacting the effectiveness of ICI therapy - a finding which has therapeutic implications in patients with NASH-related liver cancer.

Lay summary: Non-alcoholic steatohepatitis represents the fastest growing cause of hepatocellular carcinoma. It is also associated with reduced efficacy of immunotherapy, which is the standard of care for advanced hepatocellular carcinoma. Herein, we show that non-alcoholic steatohepatitis is associated with impaired motility, metabolic function, and response to anti-PD-1 treatment in hepatic CD8+ T cells, which can be rescued by metformin treatment.

Keywords: Hepatic intravital imaging; Hepatic transcriptomics; Immunometabolism; Liver cancer; Metabolic syndrome; NASH immunology.


Conflict of interest statement

Conflicts of interest The authors declare no conflicts of interest. Please refer to the accompanying ICMJE disclosure forms for further details.

Figures

Figure 1:
Figure 1:. NASH impairs anti-PD-1 therapy against liver cancer.
A. Experimental setup: NASH was induced by feeding C57BL/6 or BALB/c mice with CDAA or WD diet for 6 months or MCD diet for 2 weeks. Then intrahepatic injections of 2×10⁵ RIL-175 or CT26 tumor cells were performed to induce liver tumor in congenic mice. Tumor-bearing NASH mice were given i.p. injection of anti-PD-1 (200μg/mouse) at indicated time points. B+C. End point assessment of intrahepatic RIL-175 tumors in CDAA or ND mice after anti-PD-1 treatment. Experimental setup is shown in (A). Representative liver pictures are shown in (B). Tumor weights were quantified (C). Data are presented as mean±s.e.m. from two independent experiments. ND IgG, n=12; ND anti-PD-1, n= 10; CDAA IgG, n=8; CDAA anti-PD-1 n=10. *p<0.05, one-way ANOVA with Tukey’s multiple comparisons test. D+E. Tumor growth kinetics of intrahepatic RIL-175 tumors was monitored in MCD or ND mice following anti-PD-1 treatment using non-invasive bioluminescence imaging. Experimental setup is shown in (A). Representative images at indicated time points are shown in (D). Turmor burdens were quantifed in (E). Representative data from one experiment are presented as mean±s.e.m. Experiments were repeated twice. n=5 per group. *p<0.05 one-way ANOVA with Tukey’s multiple comparisons test. F+G. End point assessment of intrahepatic CT26 tumors WD or ND mice after anti-PD-1 treatment. Experimental setup is shown in (A). Representative liver pictures are shown in (F). Tumor weights were quantified in (G). Representative data from one experiment are presented as mean±s.e.m. Experiments were repeated twice. ND IgG, n=6; ND anti-PD-1, n= 5; WD IgG, n=4; WD anti-PD-1 n=5. *p<0.05, one-way ANOVA with Tukey’s multiple comparisons test. H. Tumor growth curve of s.c. RIL-175 tumors in WD or ND mice given anti-PD-1 treatment. Experimental setup is shown in Fig. S2C. Representative data from one experiment are presented as mean±s.e.m. Experiments were repeated twice. n=5 per group. *p<0.05, one-way ANOVA with Tukey’s multiple comparisons test.
Figure 2:
Figure 2:. NASH causes an aberrant CD8+ T cell activation in liver but does not affect CD8+ T cell immune phenotype in liver tumor upon anti-PD-1 treatment.
A-C. Effector memory phenotyping of CD8+ T cells were assessed by flow cytometry CD44 and CD62L staining. Representative contour plots of hepatic CD44+CD62LCD8+ T cells (gated on CD3+CD8+ cells) from CDAA or ND mice are shown in (A). Hepatic and splenic CD44+CD62LCD8+ T cells from NASH mice fed with CDAA (B) or WD (C) were quantified. Representative data from one experiment are presented as mean±s.e.m. Experiments were repeated twice. In (B), n=5 per group. In (C), Spleen ND, n=6; Spleen WD, n= 5; Liver ND, n=6; Liver WD, n=5. *p<0.05, **p<0.01, student’s t-test. D-F. Exhaustion CD8+ T cells were measured by PD-1 and Tim3 flow cytometry staining. Representative contour plot of hepatic PD-1+Tim3+CD8+ T cells of CDAA or ND mice are shown in (D). Hepatic and splenic PD-1+Tim3+CD8+ T cells from NASH mice fed with CDAA (F) or WD (G) were quantified. Representative data from one experiment are presented as mean±s.e.m. Experiments were repeated twice. In (E), n=5 per group. In (F), Spleen ND, n=6; Spleen WD, n= 5; Liver ND, n=6; Liver WD, n=5. *p<0.05, ***p<0.001, student’s t-test. G-I. Cytokine produciton of CD8+ T cells were determined by measuring IFNγ+TNFα+CD8+ T cells after ex vivo stimulation with PMA/Ionomycin for 4h. Representative contour plot of hepatic IFNγ+TNFα+CD8+ T cells of CDAA or ND are shown in (G). Hepatic and splenic IFNγ+TNFα+CD8+ T cells from NASH mice fed with CDAA (H) or WD (I) were quantified. Representative data from one experiment are presented as mean±s.e.m. Experiments were repeated twice. In (H), n=5 per group. In (I), Spleen ND, n=6; Spleen WD, n= 5; Liver ND, n=6; Liver WD, n=5. **p<0.01, ***p<0.001, student’s t-test. J-L. Expression of cytotoxic molecule Granzyme B in CD8+ T cells was measured by flow cytometry. Representative contour plot of hepatic Granzyme B+CD8+ T cells of CDAA or ND mice are shown in (J). Hepatic and splenic Granzyme B+CD8+ T cells from NASH mice fed with CDAA (K) or WD (L) were quantified. Representative data from one experiment are presented as mean±s.e.m. Experiments were repeated twice. In (H), n=5 per group. In (L), Spleen ND, n=6; Spleen WD, n= 5; Liver ND, n=6; Liver WD, n=5. **p<0.01, ***p<0.001, student’s t-test. M-P. Upon anti-PD-1 treatment, the infulence of NASH on immune phenotype of tumor infiltering CD8+ T cells was assessed. Levels of CD44+CD62 (M), PD-1+ (N), IFNγ+ (O) and Granzym B+ (P) in tumor infiltrating CD8+ T cells were measued in WD compared to ND mice. For IFNγ staining, cells were stimulated ex vivo with PMA/Ionomycin for 4h. Representative data from one experiment are presented as mean±s.e.m. Experiments were repeated twice. n=5 per group. student’s t-test.
Figure 3:
Figure 3:. NASH induces an environment-independent reduction of CD8+ T cell motility in liver.
A. In vivo intravital imaging assay experimental setup: CXCR6GFP mice fed with WD or ND for 6 months were given intrahepatic injection of 2×10⁵ RIL-175. At day 10–12 after tumor injection, mice were i.v. injected with fluorochrome-coupled anti-CD8 and anti-CD31, and intravital multi-photon confocal microscopy microscopy was used to examine the dynamics of T cells in liver tumors. B. Representative immunofluorescence images derived from automated tracking of tumor infiltrating CXCR6CD8+ T in ND mice (upper section) and WD mice (lower section). Cell movement behavior measured over time using Imaris. Scale bar 50 μm. C+D. Speed (C, μm/sec) and track displacement length (D, distance between first and last cell position in μm) of tumor infiltrating CD8+ T cells were measured by Imaris software in WD or ND CXCR6GFP mice. Representative data from one mouse are presented as mean. Imaging was repeated in 3 mice per group. ****p<0.0001, student’s t-test. E. Speed (μm/sec) of moving tumor infiltrating CD8+ T cell of CXCR6GFP mice fed with WD or ND. Moving cells were defined by a mean speed of >0.25μm/sec. Representative data from one mouse are presented as mean. Imaging was repeated in 3 mice per group. ****p<0.0001, student’s t-test. F. Speed (μm/s) of intrahepatic and s.c. tumor infiltrating CD8+ T cells in WD CXCR6GFP mice. Imaging was repeated in 3 mice per group. ****p<0.0001, student’s t-test. G+H. Speed (G, μm/s) and track displacement length (H, distance between first and last cell position in μm) of tumor infiltrating CXCR6CD8+ T cells (F, G) were measured by Imaris software in WD or ND CXCR6GFP mice. Representative data from one mouse are presented as mean. Imaing was repeated in 3 mice per group. ****p<0.0001, student’s t-test. I+J. Speed (μm/sec) of tumor infiltrating CXCR6+CD8 (I) and CXCR6+CD8+ (J) cells were measured by Imaris software in WD or ND CXCR6GFP mice. Representative data from one mouse are presented as mean. Imaging was repeated in 3 mice per group. ****p<0.0001, student’s t-test. K. In vitro imaging experimental setup: C57BL/6 mice fed with WD or ND for 6 months. Hepatic CD8+ T cells were isolated and stained with cell tracker green and cell tracker deep red and imaged in collagen+media overnight. L. Representative immunofluorescence images derived from automated tracking of hepatic CD8+ T from ND (left section) and WD (right section) mice. Cell movement behavior was measured over time using Imaris. Scale bar 100μm. M. Speed (μm/sec) of hepatic WD and ND CD8+ T cells in collagen+media imaged overnight and analyzed with Imaris. Representative data from one experiment are presented as mean±s.e.m. Experiments were repeated twice. ****p<0.0001, student’s t-test;
Figure 4:
Figure 4:. NASH impairs CD8+ T cell metabolic fitness
A. Pathway analysis of hepatic CD8+ T cells of mice fed with MCD or ND and treated with anti-PD-1. Hepatic CD8+ T cells from three mice were pooled per sample (n=3 per group) for RNA isolation. Hepatic CD8+ T cells were sorted and sequenced using nCounter® the metabolic pathways panel. Hierarchical clustering was used to group pathways. B. Percentage of 2-NBDG staining of hepatic CD8+ T cells of C57BL/6 fed with ND or CDAA and treated with anti-PD-1. Representative data from one experiment are presented as mean±s.e.m. Experiments were repeated twice. ND IgG, n=6; ND anti-PD-1, n= 4; CDAA IgG, n=5; CDAA anti-PD-1 n=5. **p<0.01, ***p<0.001, one-way ANOVA with Tukey’s multiple comparisons test. C. Percentage of 2-NBDG staining of hepatic CD8+ T cells of BALB/C fed with ND or WD and treated with anti-PD-1. Representative data from one experiment are presented as mean±s.e.m. Experiments were repeated twice. ND IgG, n=5; ND anti-PD-1, n= 4; WD IgG, n=5; WD anti-PD-1 n=4. ***p<0.001, ****p<0.0001, one-way ANOVA with Tukey’s multiple comparisons test. D. Percentage of 2-NBDG staining of hepatic CD8+ T cells of C57BL/6 fed with ND or MCD and treated with anti-PD-1. Representative data from one experiment are presented as mean±s.e.m. Experiments were repeated twice. ND IgG, n=5; ND anti-PD-1, n= 4; MCD IgG, n=5; MCD anti-PD-1 n=6. *p<0.05, one-way ANOVA with Tukey’s multiple comparisons test. E. MFI of MitoTracker deep red staining (MDR) of hepatic and splenic CD8+ T cells of mice fed with ND or CDAA. Representative data from one experiment are presented as mean±s.e.m. Experiments were repeated twice. n=5 per group. *p<0.05, ***p<0.001, student’s t-test. F. Representative histogram of MitoTracker deep red staining of hepatic CD8+ T cells of C57BL/6 fed with ND or CDAA. G. MFI of mitotracer green (MG) of hepatic and splenic CD8+ T cells of mice fed with ND or CDAA. Representative data from one experiment are presented as mean±s.e.m. Experiments were repeated twice. n=5 per group. *p<0.05, student’s t-test. H. Representative histogram of Mitotracker green staining of hepatic CD8+ T cells of C57BL/6 fed with ND or CDAA.
Figure 5:
Figure 5:. Metformin restores efficacy of aPD-1 therapy in NASH-HCC
A-C. Relative expression of Mpc1 (A), Pck1 (B) and Adh4 (C) of C57BL/6 mice fed with MCD. Mice were treated with metformin for 2 weeks before sacrifice. RNA extracted from sorted hepatic CD8+ T cells from two mice were pooled for PCR analysis. Data are presented as mean±s.e.m. from two independent experiments. n=9 per group. *p<0.05, **p<0.01 D. Representative histogram of MitoTracker green staining of hepatic CD8+ T cells of C57BL/6 fed with WD and treated with metformin. E+F. MFI of MitoTracker green (MG) of hepatic CD8+ T cells of mice fed with MCD (E) or WD (F) and treated with metformin. E: data are presented as mean±s.e.m. from two independent experiments. n=10 per group. F: representative data from one experiment are presented as mean±s.e.m. Experiments were repeated twice. n=4 per group. *p<0.05, student’s t-test. G+H. Speed (G, μm/s) and displacement length (H, μm) of hepatic CD8+ T cells from metformin treated or control WD mice in collagen+media imaged ex vivo overnight and analyzed with Imaris. Mice were treated with metformin for 2 weeks before sacrifice. Representative data from one experiment are presented as mean±s.e.m. Experiments were repeated twice. *p<0.05, student’s t-test. I. Oxygen consumption rate (OCR) measured using seahorse analysis of splenic CD8+ T cells from ND, CDAA control or CDAA metformin treated mice. Mice were treated with metformin for 2 weeks before sacrifice. Mean±s.e.m. J. Experimental setup: C57BL/6 or BALB/c mice fed with MCD or ND for 2 weeks or WD or ND for 6 months with intrahepatic injection of 2×10⁵ RIL-175 or CT-26 tumor cells treated with anti-PD-1 (200μg/mouse at indicated time points). 5 mg/ml metformin was added to the drinking water on day five. K. Representative pictures of intrahepatic RIL-175 (left) and CT26 (right) tumors of mice fed with MCD or ND and treated with anti-PD-1, metformin or the combination. Experimental setup shown in Fig. 5I. Scale bar, 1cm. L+M. End point assessment of intrahepatic RIL-175 (L) and CT26 (M) tumors of C57BL/6 or BALB/c mice fed with MCD and treated with anti-PD-1, metformin or the combination. Experimental setup shown in Fig. 5I. K: data are presented as mean±s.e.m. from two independent experiments. Control, n=9; anti-PD-1, n=9; Met, n=5; Met+anti-PD-1, n=10. L: representative data from one experiment are presented as mean±s.e.m. Experiments were repeated twice. Control, n=10; anti-PD-1, n=5; Met, n=5; Met+anti-PD-1, n=11. *p<0.05, one-way ANOVA with Tukey’s multiple comparisons test. N. Representative pictures of intrahepatic RIL-tumors of C57BL/6 mice fed with WD and treated with the combination of anti-PD-1 and metformin. Experimental setup shown in Fig. 5I. O. End point assessment of intrahepatic RIL-175 tumors of C57BL/6 mice fed with WD and treated with the combination of anti-PD-1 and metformin. Experimental setup shown in Fig. 5I. Data are presented as mean± s.e.m. from two independent experiments. Control, n=8; Met+anti-PD-1, n=10. ****p<0.0001, student’s t-test.

Comment in

References

    1. Llovet JM, Kelley RK, Villanueva A, Singal AG, Pikarsky E, Roayaie S, et al. Hepatocellular carcinoma. Nat Rev Dis Primers. 2021;7(1):6. - PubMed
    1. Estes C, Razavi H, Loomba R, Younossi Z, Sanyal AJ. Modeling the epidemic of nonalcoholic fatty liver disease demonstrates an exponential increase in burden of disease. Hepatology. 2018;67(1):123–33. - PMC - PubMed
    1. Huang DQ, El-Serag HB, Loomba R. Global epidemiology of NAFLD-related HCC: trends, predictions, risk factors and prevention. Nat Rev Gastroenterol Hepatol. 2021;18(4):223–38. - PMC - PubMed
    1. Hoos A Development of immuno-oncology drugs - from CTLA4 to PD1 to the next generations. Nat Rev Drug Discov. 2016;15(4):235–47. - PubMed
    1. Greten TF, Abou-Alfa GK, Cheng AL, Duffy AG, El-Khoueiry AB, Finn RS, et al. Society for Immunotherapy of Cancer (SITC) clinical practice guideline on immunotherapy for the treatment of hepatocellular carcinoma. J Immunother Cancer. 2021;9(9). - PMC - PubMed

Publication types

MeSH terms