

Quantification of infarct core signal using CT imaging in acute ischemic stroke
- PMID: 35378498
- PMCID: PMC8980621
- DOI: 10.1016/j.nicl.2022.102998
Quantification of infarct core signal using CT imaging in acute ischemic stroke
Abstract
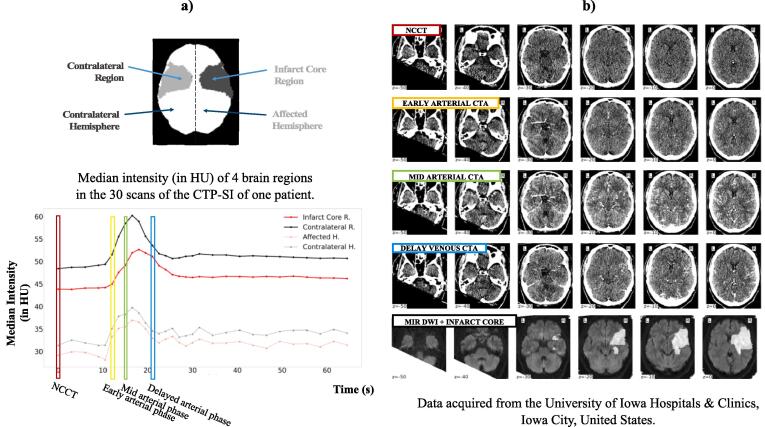
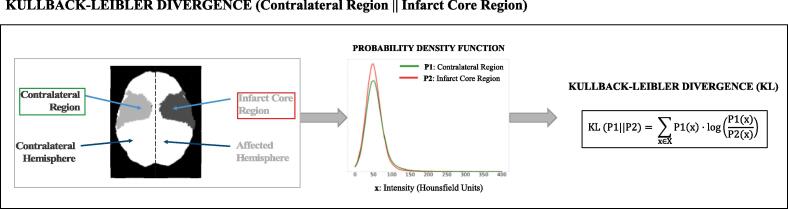
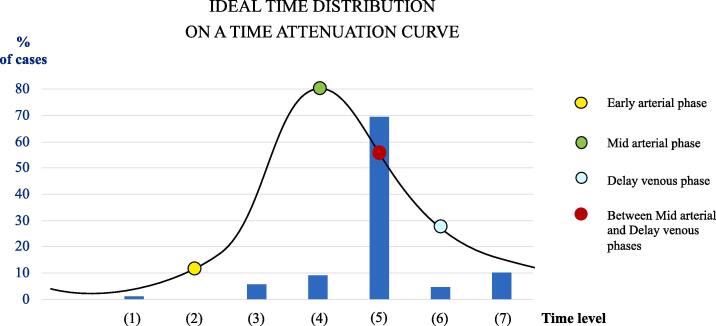
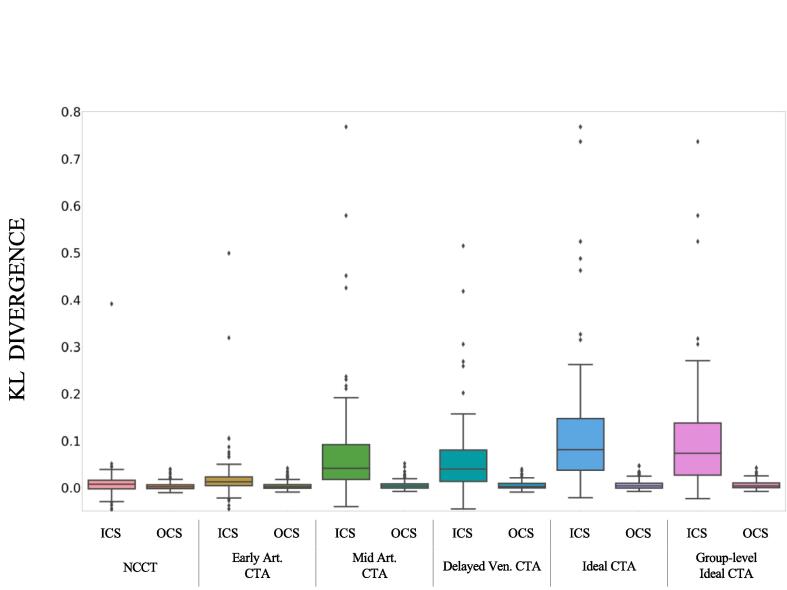
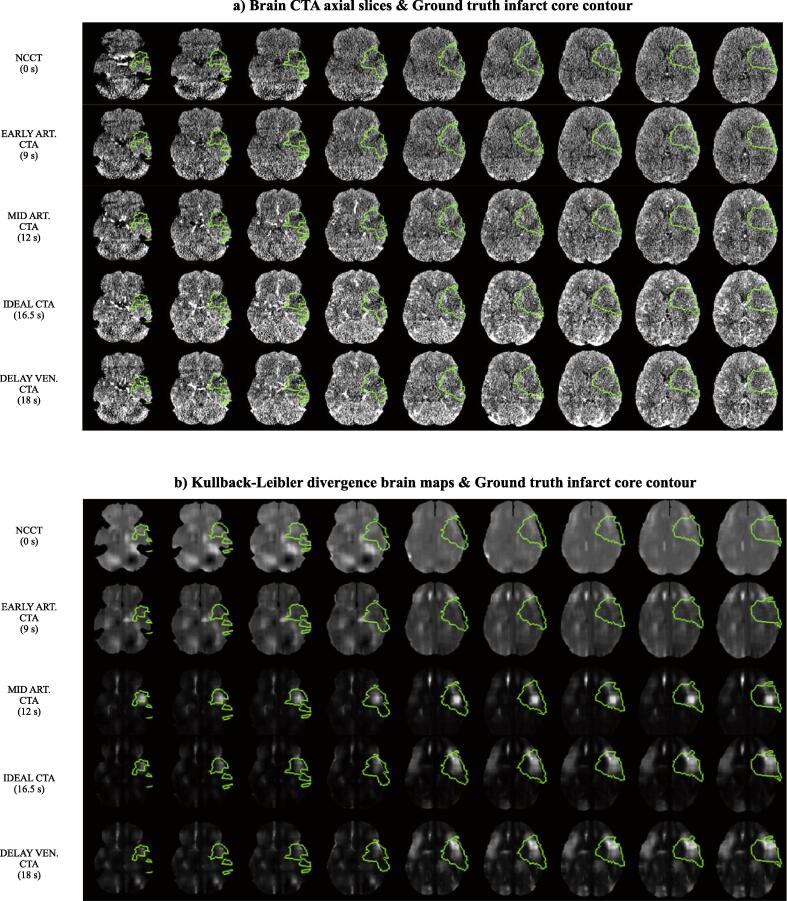
In stroke care, the extent of irreversible brain injury, termed infarct core, plays a key role in determining eligibility for acute treatments, such as intravenous thrombolysis and endovascular reperfusion therapies. Many of the pivotal randomized clinical trials testing those therapies used MRI Diffusion-Weighted Imaging (DWI) or CT Perfusion (CTP) to define infarct core. Unfortunately, these modalities are not available 24/7 outside of large stroke centers. As such, there is a need for accurate infarct core determination using faster and more widely available imaging modalities including Non-Contrast CT (NCCT) and CT Angiography (CTA). Prior studies have suggested that CTA provides improved predictions of infarct core relative to NCCT; however, this assertion has never been numerically quantified by automatic medical image computing pipelines using acquisition protocols not confounded by different scanner manufacturers, or other protocol settings such as exposure times, kilovoltage peak, or imprecision due to contrast bolus delays. In addition, single-phase CTA protocols are at present designed to optimize contrast opacification in the arterial phase. This approach works well to maximize the sensitivity to detect vessel occlusions, however, it may not be the ideal timing to enhance the ischemic infarct core signal (ICS). In this work, we propose an image analysis pipeline on CT-based images of 88 acute ischemic stroke (AIS) patients drawn from a single dynamic acquisition protocol acquired at the acute ischemic phase. We use the first scan at the time of the dynamic acquisition as a proxy for NCCT, and the rest of the scans as a proxy for CTA scans, with bolus imaged at different brain enhancement phases. Thus, we use the terms "NCCT" and "CTA" to refer to them. This pipeline enables us to answer the questions "Does the injection of bolus enhance the infarct core signal?" and "What is the ideal bolus timing to enhance the infarct core signal?" without being influenced by aforementioned factors such as scanner model, acquisition settings, contrast bolus delay, and human reader errors. We use reference MRI DWI images acquired after successful recanalization acting as our gold standard for infarct core. The ICS is quantified by calculating the difference in intensity distribution between the infarct core region and its symmetrical healthy counterpart on the contralateral hemisphere of the brain using a metric derived from information theory, the Kullback-Leibler divergence (KL divergence). We compare the ICS provided by NCCT and CTA and retrieve the optimal timing of CTA bolus to maximize the ICS. In our experiments, we numerically confirm that CTAs provide greater ICS compared to NCCT. Then, we find that, on average, the ideal CTA acquisition time to maximize the ICS is not the current target of standard CTA protocols, i.e., during the peak of arterial enhancement, but a few seconds afterward (median of 3 s; 95% CI [1.5, 3.0]). While there are other studies comparing the prediction potential of ischemic infarct core from NCCT and CTA images, to the best of our knowledge, this analysis is the first to perform a quantitative comparison of the ICS among CT based scans, with and without bolus injection, acquired using the same scanning sequence and a precise characterization of the bolus uptake, hence, reducing potential confounding factors.
Keywords: Acute ischemic stroke; CTA; CTA timing; Infarct core; Infarct core signal; NCCT.
Copyright © 2022 The Author(s). Published by Elsevier Inc. All rights reserved.
Conflict of interest statement
The authors declare that they have no known competing financial interests or personal relationships that could have appeared to influence the work reported in this paper.
Figures
References
-
- Almekhlafi M.A., Kunz W.G., Menon B.K., McTaggart R.A., Jayaraman M.V., Baxter B.W., Heck D., Frei D., Derdeyn C.P., Takagi T., Aamodt A.H., Fragata I.M.R., Hill M.D., Demchuk A.M., Goyal M. Imaging of Patients with Suspected Large-Vessel Occlusion at Primary Stroke Centers: Available Modalities and a Suggested Approach. AJNR Am. J. Neuroradiol. 2019;40:396–400. doi: 10.3174/ajnr.A5971. - DOI - PMC - PubMed
-
- Benjamin E.J., Blaha M.J., Chiuve S.E., Cushman M., Das S.R., Deo R., de Ferranti S.D., Floyd J., Fornage M., Gillespie C., Isasi C.R., Jiménez M.C., Jordan L.C., Judd S.E., Lackland D., Lichtman J.H., Lisabeth L., Liu S., Longenecker C.T., Mackey R.H., Matsushita K., Mozaffarian D., Mussolino M.E., Nasir K., Neumar R.W., Palaniappan L., Pandey D.K., Thiagarajan R.R., Reeves M.J., Ritchey M., Rodriguez C.J., Roth G.A., Rosamond W.D., Sasson C., Towfighi A., Tsao C.W., Turner M.B., Virani S.S., Voeks J.H., Willey J.Z., Wilkins J.T., Wu J.H.Y., Alger H.M., Wong S.S., Muntner P. Heart Disease and Stroke Statistics—2017 Update. Circulation. 2017;135:e146–e603. doi: 10.1161/CIR.0000000000000485. - DOI - PMC - PubMed
-
- Berkhemer O.A., Fransen P.S.S., Beumer D., van den Berg L.A., Lingsma H.F., Yoo A.J., Schonewille W.J., Vos J.A., Nederkoorn P.J., Wermer M.J.H., van Walderveen M.A.A., Staals J., Hofmeijer J., van Oostayen J.A., Lycklama à Nijeholt G.J., Boiten J., Brouwer P.A., Emmer B.J., de Bruijn S.F., van Dijk L.C., Kappelle L.J., Lo R.H., van Dijk E.J., de Vries J., de Kort P.L.M., van Rooij W.J.J., van den Berg J.S.P., van Hasselt B.A.A.M., Aerden L.A.M., Dallinga R.J., Visser M.C., Bot J.C.J., Vroomen P.C., Eshghi O., Schreuder T.H.C.M.L., Heijboer R.J.J., Keizer K., Tielbeek A.V., den Hertog H.M., Gerrits D.G., van den Berg-Vos R.M., Karas G.B., Steyerberg E.W., Flach H.Z., Marquering H.A., Sprengers M.E.S., Jenniskens S.F.M., Beenen L.F.M., van den Berg R., Koudstaal P.J., van Zwam W.H., Roos Y.B.W.E.M., van der Lugt A., van Oostenbrugge R.J., Majoie C.B.L.M., Dippel D.W.J. A randomized trial of intraarterial treatment for acute ischemic stroke. N. Engl. J. Med. 2015;372(1):11–20. - PubMed
-
- Campbell B.C.V., Mitchell P.J., Kleinig T.J., Dewey H.M., Churilov L., Yassi N., Yan B., Dowling R.J., Parsons M.W., Oxley T.J., Wu T.Y., Brooks M., Simpson M.A., Miteff F., Levi C.R., Krause M., Harrington T.J., Faulder K.C., Steinfort B.S., Priglinger M., Ang T., Scroop R., Barber P.A., McGuinness B., Wijeratne T., Phan T.G., Chong W., Chandra R.V., Bladin C.F., Badve M., Rice H., de Villiers L., Ma H., Desmond P.M., Donnan G.A., Davis S.M. Endovascular Therapy for Ischemic Stroke with Perfusion-Imaging Selection. N. Engl. J. Med. 2015;372:1009–1018. doi: 10.1056/NEJMoa1414792. - DOI - PubMed
Publication types
MeSH terms
Grants and funding
LinkOut - more resources
Full Text Sources
Medical
Research Materials
