

This is a preprint.
It has not yet been peer reviewed by a journal.
The National Library of Medicine is
running a pilot
to include preprints that result from research funded by NIH in PMC and PubMed.
[Preprint]. 2022 Mar 30:rs.3.rs-1499315.
doi: 10.21203/rs.3.rs-1499315/v1.
Spatial-CITE-seq: spatially resolved high-plex protein and whole transcriptome co-mapping
Affiliations
- PMID: 35378748
- PMCID: PMC8978952
- DOI: 10.21203/rs.3.rs-1499315/v1
Item in Clipboard
Spatial-CITE-seq: spatially resolved high-plex protein and whole transcriptome co-mapping
Res Sq.
.
Update in
-
High-plex protein and whole transcriptome co-mapping at cellular resolution with spatial CITE-seq.Nat Biotechnol. 2023 Oct;41(10):1405-1409. doi: 10.1038/s41587-023-01676-0. Epub 2023 Feb 23. Nat Biotechnol. 2023. PMID: 36823353 Free PMC article.
Abstract
We present spatial-CITE-seq for high-plex protein and whole transcriptome co-mapping, which was firstly demonstrated for profiling 198 proteins and transcriptome in multiple mouse tissue types. It was then applied to human tissues to measure 283 proteins and transcriptome that revealed spatially distinct germinal center reaction in tonsil and early immune activation in skin at the COVID-19 mRNA vaccine injection site. Spatial-CITE-seq may find a range of applications in biomedical research.
Figures
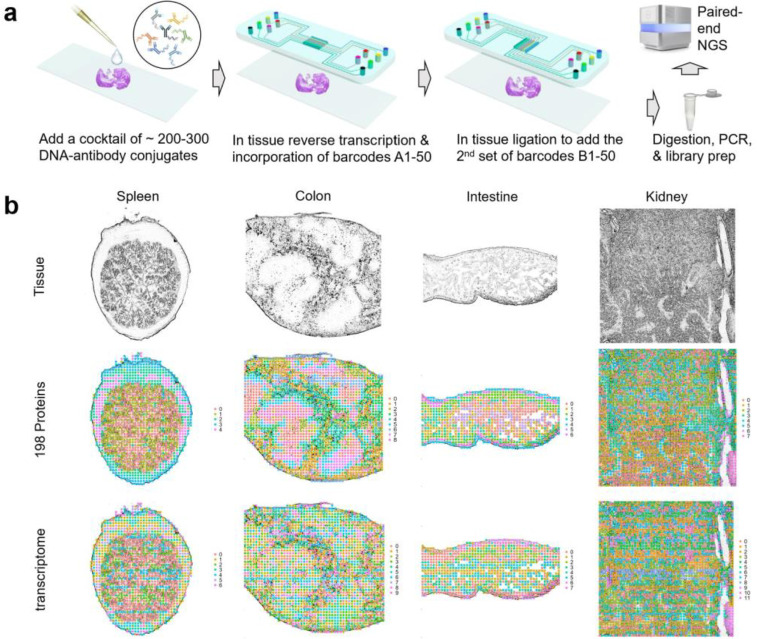
(a) Scheme of spatial-CITE-seq. A cocktail of antibody-derived DNA tags (ADTs) is applied to a PFA-fixed tissue section to label a panel of ~200–300 protein markers in situ. Next, a set of DNA barcodes A1-A50 are flowed over the tissue surface in a spatially defined manner via parallel microchannels and reverse transcription is carried out inside each channel for in-tissue synthesis of cDNAs complementary to endogenous mRNAs and introduced ADTs. Then, a set of DNA barcodes B1-B50 is introduced using another microfluidic device with microchannels perpendicular to the first flow direction and subsequently ligated to barcodes A1-A50, creating a 2D grid of tissue pixels, each of which has a unique spatial address code AB. Finally, barcoded cDNA is collected, purified, amplified, and prepared for paired end NGS sequencing. (b) Spatially resolved 189-plex protein and whole transcriptome co-mapping of mouse spleen, colon, intestine, and kidney tissue with 20μm pixel size. Upper row: brightfield optical images of the tissue sections. Middle row: unsupervised clustering of all pixels based on all 189 protein markers only and projection onto the tissue images. Lower row: unsupervised clustering of whole transcriptome of all pixels and projection to the tissue images. Colors correspond to different proteomic or transcriptomic clusters indicated on the right side of each panel.
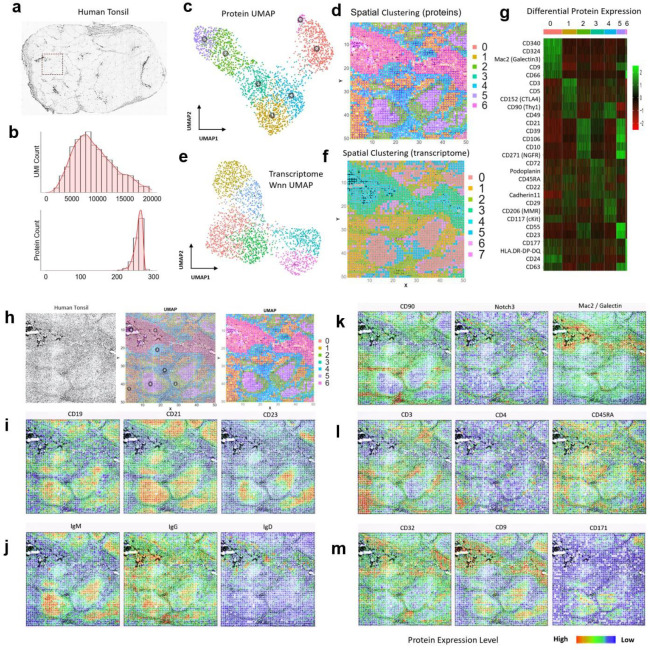
(a) Image of a human tonsil tissue section. The region mapped by spatial-CITE-seq is indicated by a dashed box. (b) per-pixel UMI count and protein count histograms. (c) UMAP plot of the clustering analysis of all pixels based on 273 proteins only. (d) Spatial distribution of the clusters (0–6) indicated by the same colors as in (c). (e) UMAP plot of the clustering analysis of all pixels based on the mRNA transcriptome. (f) Spatial distribution of the transcriptomic clusters (0–7) indicated by the same colors as in (e). Pixel size: 20μm (g) Differentially expressed proteins in the clusters shown in (c, d). (h) Tissue mage of the mapped region (left), spatial proteomic clusters (right), and the overlay (middle). (i) Individual surface protein markers related to B cells and follicular DCs. (j) Functional protein markers such as immunoglobulins showing spatially distinct distribution of GC B cells (IgM), matured B cells (IgG), and naïve B cells (IgD), in agreement with B cell maturation, class switch, and migration. (k) Individual protein markers enriched in the extracellular region (CD90, Notch3) and crypt (Mac2). (l) Individual T cell protein markers CD3, CD4, and CD45RA showing T-cell zones and subtypes. (m) Individual protein markers CD32, CD9, and CD171. CD32 identified a range of immune cells including platelets, neutrophils, macrophages, and dendritic cells (DCs) trafficking from vasculature. CD9 identified plasma cell precursors in germinal centers (GCs) and crypt. CD171, a neural cell adhesion molecule, is found highly distinct in the GC dark zone. Color key: protein expression from high to low.
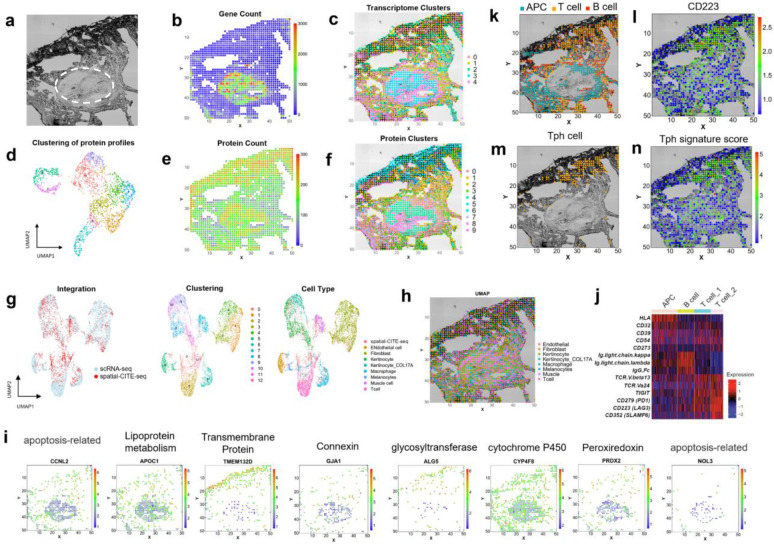
(a) Brightfield image of skin section in the mapped region. A pilosebaceous unit is indicated by the dashed region (b) Gene count spatial map. (c) Spatial clustering of all pixels based on whole transcriptome. Despite low gene count in the low cell density regions of dermal collagen, the clustering analysis revealed spatially distinct zones based on transcriptomic profiles. (d) UMAP clustering of all 273 proteins. (e) Protein count distribution. (f) Spatial clustering of all pixels based on 273 proteins only, which is in high concordance with spatial clusters identified by spatial transcriptome co-mapped on the same tissue section. (g) Integrated analysis of single-cell and spatial transcriptome. Left: the transcriptomes of spatial tissue pixels (red) conform to the clusters identified by joint analysis with single-cell RNA-seq (blue). Middle: unsupervised clustering of the combined transcriptome dataset. Right: cell type annotation. (i) Visualization of select genes associated with different gene oncology functions via integrated analysis and transfer learning. (j) Differential protein expression in different cell types (APC, B cell, and two subtypes of T cells). (k) Spatial distribution of APC, T, and B cells. (l) Expression of CD223 (LAG3) protein, a functional marker of activated T cells and other immune cell subsets. (m) Identification of a highly localized population of peripheral helper T cells (Tph) at the vaccine injection site. (n) Spatial distribution of Tph gene score correlates with the cell localization. Pixel size: 20μm.
References
-
- Stahl P.L. et al. Visualization and analysis of gene expression in tissue sections by spatial transcriptomics. Science 353, 78–82 (2016). - PubMed
-
- Burgess D.J. Spatial transcriptomics coming of age. Nat Rev Genet 20, 317 (2019). - PubMed
-
- Larsson L., Frisen J. & Lundeberg J. Spatially resolved transcriptomics adds a new dimension to genomics. Nat Methods 18, 15–18 (2021). - PubMed
Publication types
Grants and funding
LinkOut - more resources
Full Text Sources
