

Review
doi: 10.1152/physiol.00044.2021.
Epub 2022 Apr 4.
Pulsatile Basal Insulin Secretion Is Driven by Glycolytic Oscillations
Affiliations
- PMID: 35378996
- PMCID: PMC9191171
- DOI: 10.1152/physiol.00044.2021
Item in Clipboard
Review
Pulsatile Basal Insulin Secretion Is Driven by Glycolytic Oscillations
Physiology (Bethesda).
.
Abstract
In fasted and fed states, blood insulin levels are oscillatory. While this phenomenon is well studied at high glucose levels, comparatively little is known about its origin under basal conditions. We propose a possible mechanism for basal insulin oscillations based on oscillations in glycolysis, demonstrated using an established mathematical model. At high glucose, this is superseded by a calcium-dependent mechanism.
Keywords: bursting electrical activity; calcium; metabolism; pulsatile insulin secretion.
Conflict of interest statement
No conflicts of interest, financial or otherwise, are declared by the authors.
Figures
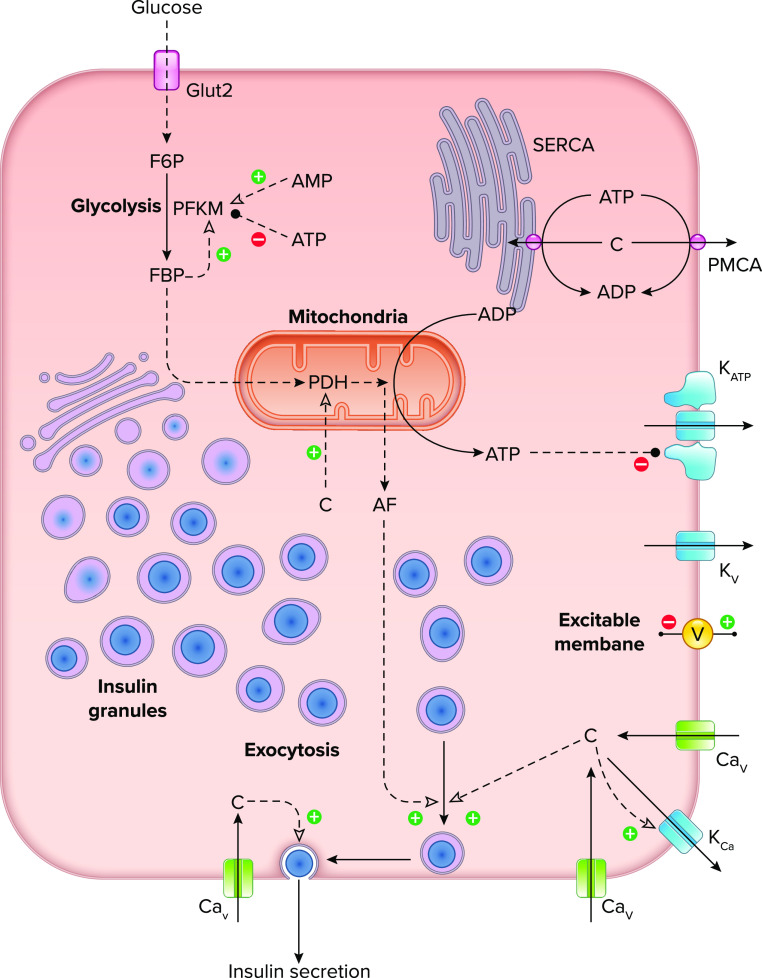
Diagram illustrating the key cellular components and molecular mechanisms involved in oscillations of Ca2+ and insulin secretion in the pancreatic β-cell Glucose enters the cell through glucose transporters and is metabolized in glycolysis and the mitochondria. ATP, mostly produced by the mitochondria, closes KATP channels in the plasma membrane, leading to depolarization. Additional ion channels, including voltage-gated Ca2+ (CaV) and K+ channels (KV) and Ca2+-activated K+ channels (KCa), support excitability of the plasma membrane potential (V) and underlie bursting activity at postprandial glucose levels. Depolarization of the membrane leads to Ca2+ (c) influx through CaV channels, while cytosolic Ca2+ levels are reduced by activity of Ca2+ ATPase pumps [sarco(endo)plasmic reticulum Ca2+-ATPase (SERCA) and plasma membrane Ca2+-ATPase (PMCA)]. Exocytosis of insulin-containing granules is triggered by Ca2+ and amplified by one or more metabolic signaling factors (AF) that promote the movement of insulin granules towards a releasable state. F6P, fructose-6-phosphate; FBP, fructose-1,6-bisphosphate; PDH, pyruvate dehydrogenase; PFKM, phosphofructokinase, muscle.
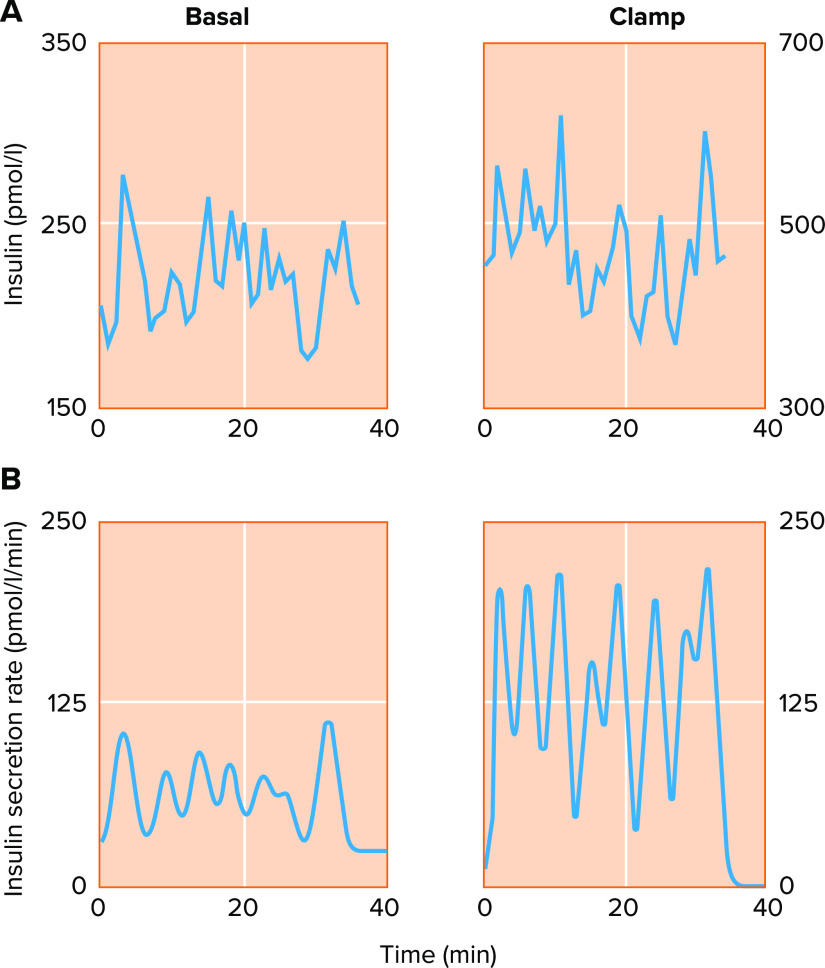
Basal and glucose-stimulated insulin secretion are oscillatory in humans A: insulin oscillations measured from the hepatic portal vein at basal glucose (4.4 mM; left) and high glucose imposed via hyperglycemic clamp (nominally 8–9 mM; right). The ∼5-min period of the oscillations does not change dramatically in response to glucose, but insulin rises about 2-fold in the higher glucose condition (note the difference in scale). B: deconvolution analysis resolves the underlying pulsatile nature of the insulin secretion rate, demonstrating that glucose stimulates a large increase in insulin pulse mass. Reproduced from Ref. , with permission from Journal of Clinical Endocrinology & Metabolism.
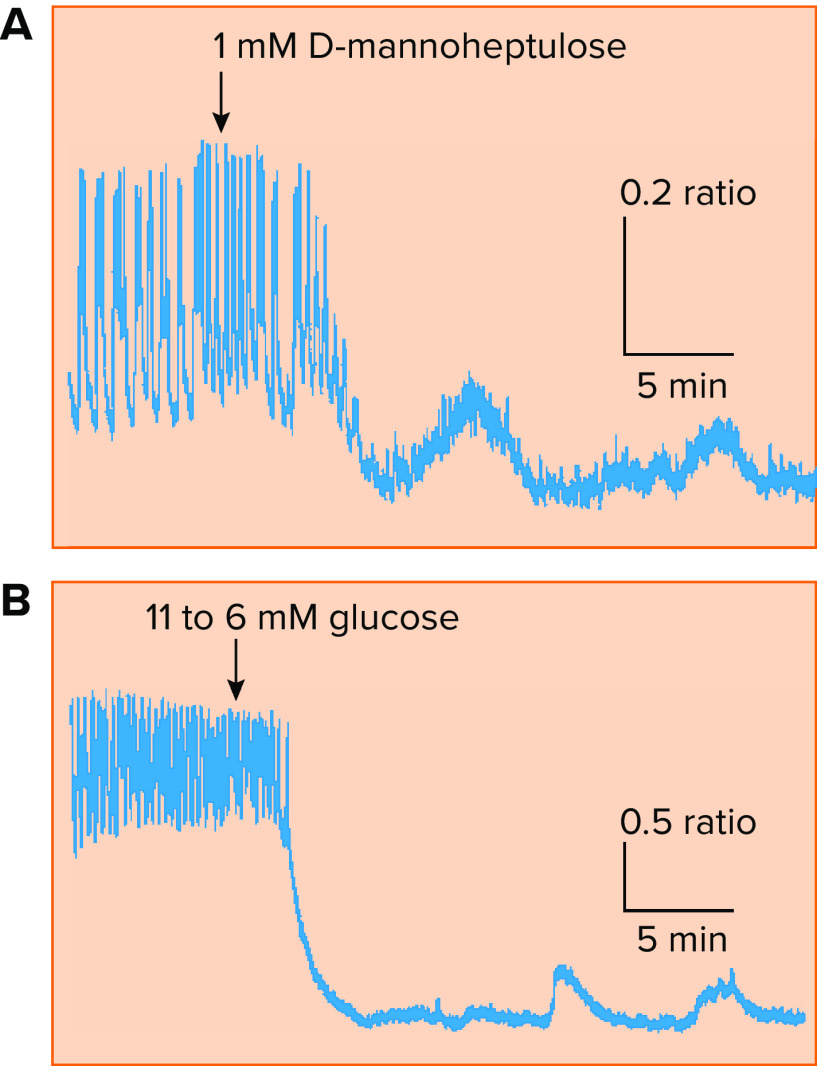
Oscillations in intracellular Ca2+ concentration, the main trigger for insulin exocytosis, are observed in islets in vitro
A; upon partial block of glycolysis using d -mannoheptulose, large amplitude glucose-stimulated Ca2+ oscillations in a mouse islet give way to small amplitude oscillations unlikely to be sustained by ionic mechanisms alone. B: a similar result observed in response to a reduction in glucose from a suprathreshold (11 mM) to a subthreshold (6 mM) concentration. Reproduced with permission from Ref. , with permission from Biophysical Journal.
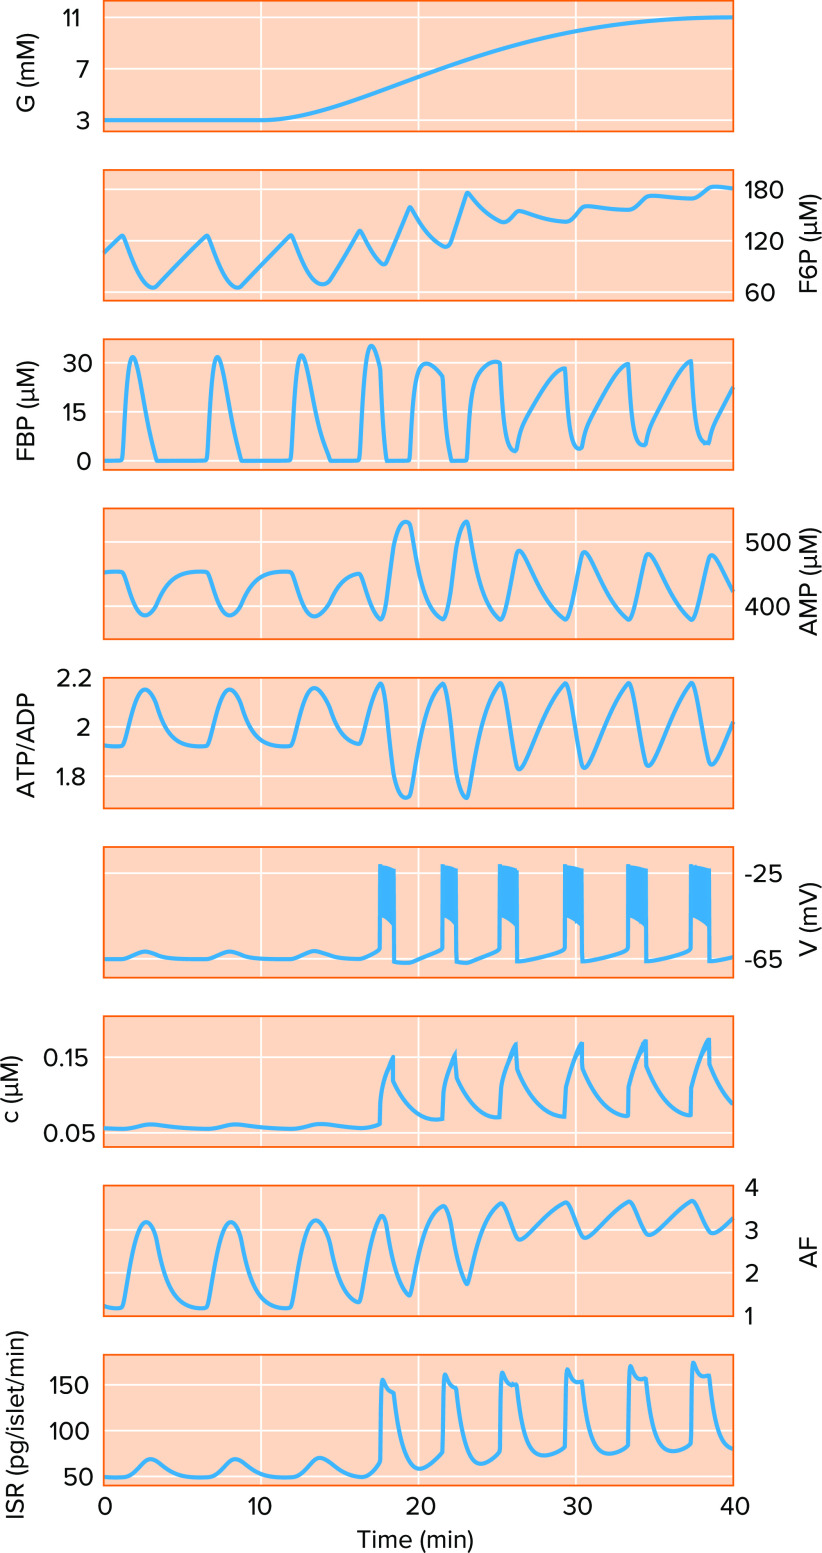
The integrated oscillator model with modification can account for basal insulin oscillations A model simulation of a ramped increase in glucose (G) from basal (3 mM) to postprandial to the high levels typically studied in vitro (11 mM). Key dynamic variables shown include the glycolytic metabolites fructose 6 phosphate (F6P) and fructose 1,6 bisphosphate (FBP), AMP, ATP/ADP ratio, membrane potential (V), cytosolic Ca2+ concentration (c), an amplifying factor (AF) that enhances exocytosis, and the insulin secretion rate (ISR).
References
-
- Ferdaoussi M, Dai X, Jensen MV, Wang R, Peterson BS, Huang C, Ilkayeva O, Smith N, Miller N, Hajmrle C, Spigelman AF, Wright RC, Plummer G, Suzuki K, Mackay JP, van de Bunt M, Gloyn AL, Ryan TE, Norquay LD, Brosnan MJ, Trimmer JK, Rolph TP, Kibbey RG, Manning Fox JE, Colmers WF, Shirihai OS, Neufer PD, Yeh ET, Newgard CB, MacDonald PE. Isocitrate-to-SENP1 signaling amplifies insulin secretion and rescues dysfunctional beta cells. J Clin Invest 125: 3847–3860, 2015. doi:10.1172/JCI82498. - DOI - PMC - PubMed
Publication types
MeSH terms
Substances
Grants and funding
LinkOut - more resources
Full Text Sources
Molecular Biology Databases