. 2022 Apr 5;14(1):38.
doi: 10.1186/s13073-022-01019-9.

Clinical implementation of RNA sequencing for Mendelian disease diagnostics

Affiliations

Clinical implementation of RNA sequencing for Mendelian disease diagnostics

Vicente A Yépez et al. Genome Med. .

Abstract

Background: Lack of functional evidence hampers variant interpretation, leaving a large proportion of individuals with a suspected Mendelian disorder without genetic diagnosis after whole genome or whole exome sequencing (WES). Research studies advocate to further sequence transcriptomes to directly and systematically probe gene expression defects. However, collection of additional biopsies and establishment of lab workflows, analytical pipelines, and defined concepts in clinical interpretation of aberrant gene expression are still needed for adopting RNA sequencing (RNA-seq) in routine diagnostics.

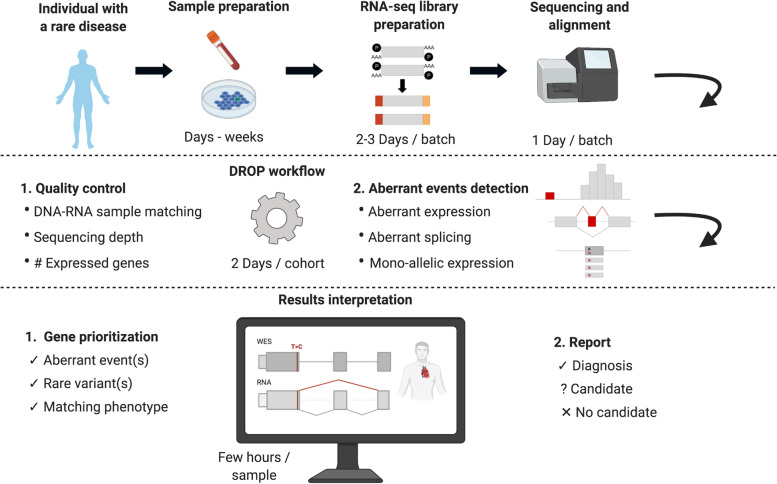
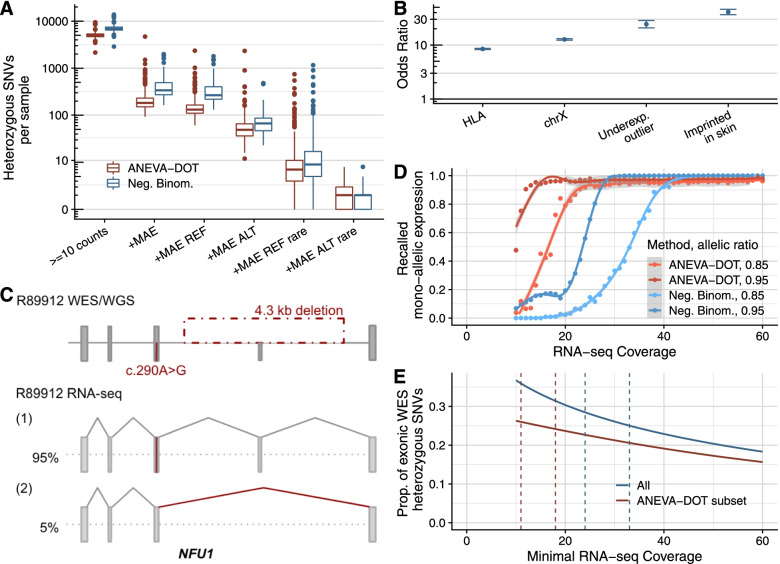
Methods: We implemented an automated RNA-seq protocol and a computational workflow with which we analyzed skin fibroblasts of 303 individuals with a suspected mitochondrial disease that previously underwent WES. We also assessed through simulations how aberrant expression and mono-allelic expression tests depend on RNA-seq coverage.

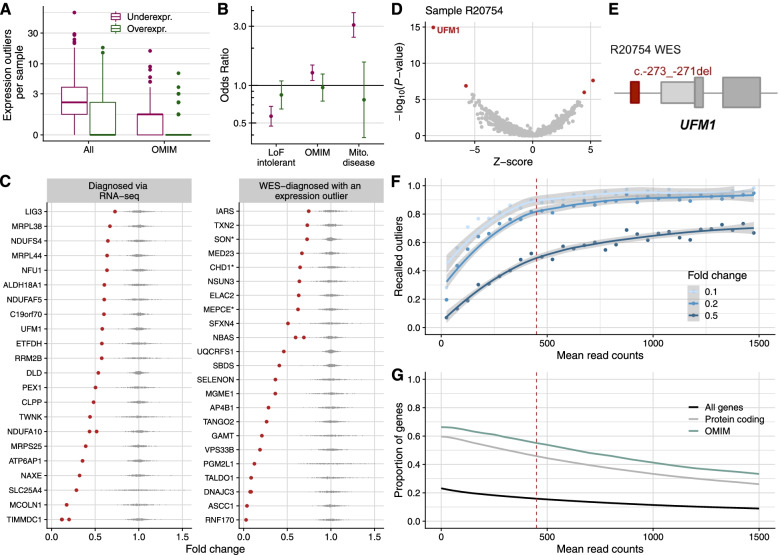
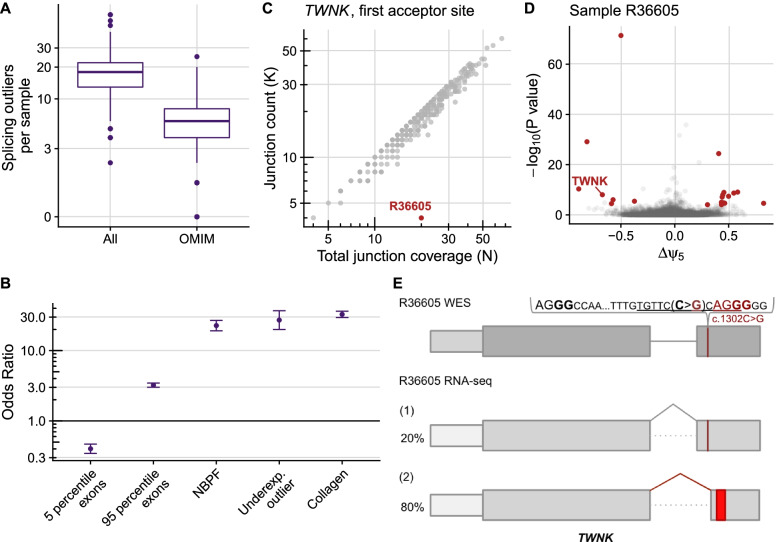
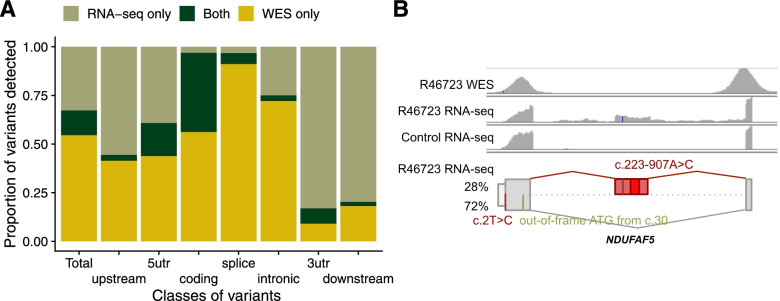
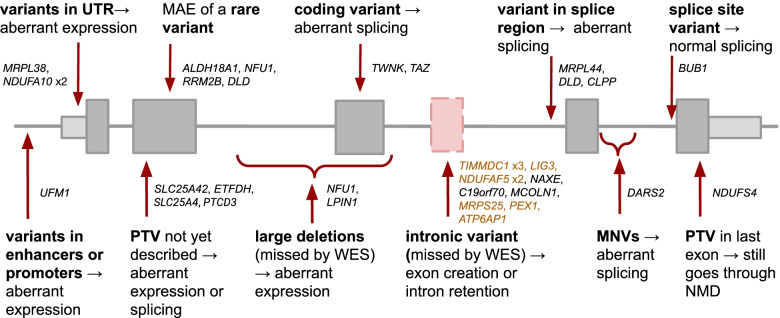
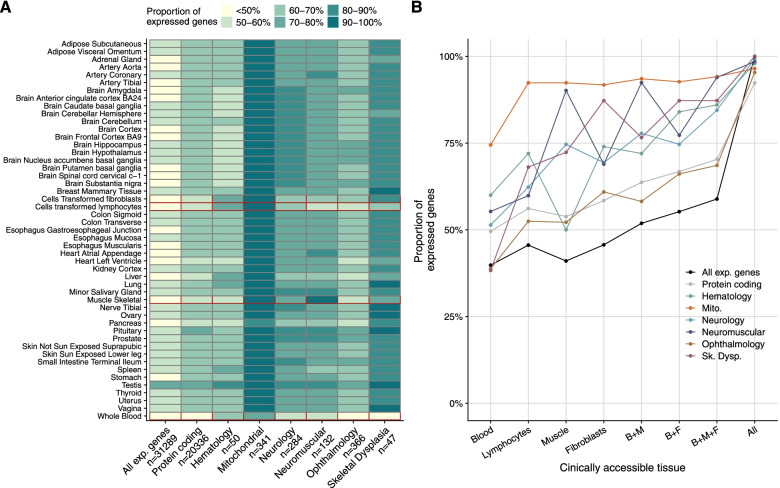
Results: We detected on average 12,500 genes per sample including around 60% of all disease genes-a coverage substantially higher than with whole blood, supporting the use of skin biopsies. We prioritized genes demonstrating aberrant expression, aberrant splicing, or mono-allelic expression. The pipeline required less than 1 week from sample preparation to result reporting and provided a median of eight disease-associated genes per patient for inspection. A genetic diagnosis was established for 16% of the 205 WES-inconclusive cases. Detection of aberrant expression was a major contributor to diagnosis including instances of 50% reduction, which, together with mono-allelic expression, allowed for the diagnosis of dominant disorders caused by haploinsufficiency. Moreover, calling aberrant splicing and variants from RNA-seq data enabled detecting and validating splice-disrupting variants, of which the majority fell outside WES-covered regions.

Conclusion: Together, these results show that streamlined experimental and computational processes can accelerate the implementation of RNA-seq in routine diagnostics.

Keywords: Genetic diagnostics; Mendelian diseases; RNA-seq.


Conflict of interest statement

The authors declare that they have no competing interests.

Figures

Fig. 1
Fig. 1
Experimental design of an RNA-seq based diagnostic study. First, individuals suspected of a Mendelian disorder are recruited for DNA sequencing. In addition, patient biopsy material is collected during the routine medical examination and prepared for RNA extraction. The sample preparation process can take from hours for biopsies to weeks for establishing a cell culture. RNA sequencing is then performed followed by alignment and quality control. The generated data go through DROP which consists of quality control steps and detection of aberrant RNA expression events. The results are then interpreted by sample, including the association of aberrant RNA expression events with rare variant(s) and the function of affected genes with the patient phenotype, which can lead to new diagnoses or candidates. Experience-based estimated durations are provided for each step
Fig. 2
Fig. 2
RNA-seq-based diagnostic flow chart. Flow diagram showing the diagnostic decision guideline after detecting a gene with an aberrant event in RNA-seq data. Identification of an aberrant event can lead to genetic diagnosis (diagnostic setting), lead to the discovery of a candidate new disease gene (research setting), or alternatively be of unlikely diagnostic significance, after which the next aberrant event is analyzed following the same path
Fig. 3
Fig. 3
Aberrant expression. A Distribution of genes per sample that were detected as expression outliers, for all genes and genes known to cause a disease (OMIM), stratified by outlier class. B Observed over expected number of overexpression and underexpression outliers (y-axis, log-scale) for loss-of-function intolerant genes, OMIM genes, and mitochondrial disease genes (x-axis). Error bars represent 95% confidence intervals of pairwise logistic regressions. C Gene expression fold change relative to the OUTRIDER-modeled expected value of all disease-causal genes that were aberrantly expressed in their corresponding affected sample. Each dot corresponds to a sample, with the affected ones in red. Data stratified by cases diagnosed via RNA-seq (n = 25) and diagnosed via WES (n = 22). Genes with a dominant mode of inheritance are marked with a * (n = 3). The two NDUFA10 cases are siblings, as well as the two DNAJC3 cases. The three TIMMDC1 cases are unrelated. D Gene-level significance (−log10(P), y-axis) versus Z-score, with UFM1 labeled among the expression outliers (red dots) of sample R20754. E Schematic depiction of the NM_016617.2:c.-273_-271del UFM1 deletion (red rectangle) detected by WES in sample R20754. Figure not shown at genomic scale. F Fraction of recalled underexpression outliers simulated with different fold changes (depicted in shades of blue) per mean gene expression (measured in raw read counts). Recall was computed in 50-wide intervals and dots are depicted in the center of the intervals. At a mean read count of 450 (vertical red dashed line), half of the simulated outliers with a fold change of 0.5 are recalled, allowing for investigating dominant genes and compound heterozygotes genes with a single downregulated allele. G Proportion of genes expressed at a given mean expression or higher, colored by different gene classes. Genes are taken from the GENCODE annotation, release 29 (Methods). A total of 9656 genes (16%), 9325 protein coding (46%), and 2098 OMIM genes (55%) have a mean read count higher than 450
Fig. 4
Fig. 4
Aberrant splicing. A Distribution of genes per sample that had at least one splicing outlier, for all genes and genes known to cause disease (OMIM). B Observed over expected number of splicing outliers on different gene categories. Neuroblastoma breakpoint family (NBPF) and collagen genes were chosen due to their high number of exons and due to collagen genes alternative splicing in a developmental-stage manner and NBPF genes having a repetitive structure, which exposes them to illegitimate recombination. Error bars represent 95% confidence intervals of pairwise logistic regressions. C Split-read counts (y-axis, gray junction on panel E) of the first annotated junction of TWNK against the total split-read coverage (x-axis, gray and red junctions on panel E) of the first donor site of TWNK. Many samples are not exclusively using the annotated junction (scattered below the diagonal), leading to a reference 𝜓5 for the annotated junction of 87%. The observed 𝜓5 for the first acceptor site of TWNK in the outlier sample is 20% (obtained by dividing the junction reads by the total junction coverage, 4/20). D Gene-level significance (−log10(P), y-axis) versus differential splicing effect (observed minus expected usage proportion of the tested donor site, Δ𝜓5, x-axis) for the alternative splice donor usage in sample R36605. Gene-level significance was obtained after multiple-testing correction across junctions. Outliers are marked in red and the gene TWNK is explicitly labeled. The Δ𝜓5 value for the first donor site of TWNK in this sample is − 0.67 = 0.2–0.87. E Schematic depiction of the synonymous NM_001163812.1:c.1302C>G (p.Ser434=) TWNK variant and its consequence on the RNA level, activating a new acceptor site (ACGG in red) and leading to the creation of a premature termination codon (red rectangle) in sample R36605. The percentage of each transcript isoform is shown next to it. Figure not shown at genomic scale
Fig. 5
Fig. 5
Mono-allelic expression. A Distribution of heterozygous SNVs per sample for successive filtering steps from left to right: Heterozygous SNVs detected by WES with an RNA-seq coverage of at least 10 reads, where MAE is detected, where MAE of the reference is detected, where MAE of the alternative is detected, and subsetted for rare variants. MAE expression detected using ANEVA-DOT and a negative binomial test (Methods). B Odds ratio of MAE in genes with common variants only and with at least one rare variant across different gene categories. Results shown for the negative binomial test only. Error bars represent 95% confidence intervals of pairwise logistic regressions. C Schematic depiction of the disease-causing 4.3 kb deletion and the c.290A>G SNV in NFU1, and their consequence on the RNA level in sample R89912. The percentage of each transcript isoform is shown next to it. Figure not shown at genomic scale. D Fraction of recalled MAE events (FDR < 0.05 on each method) with simulated allelic ratios of 0.85 and 0.95 as function of RNA-seq coverage. E Proportion of exonic heterozygous WES SNVs detected in all genes as a function of minimal RNA-seq coverage. ANEVA-DOT is able to detect only a subset of SNVs. Vertical lines correspond to RNA-seq coverage needed to recall 90% of simulated allelic ratios of 0.85 and 0.95 as inferred from panel D. REF: reference, ALT: alternative, rare: minor allele frequency < 0.1%
Fig. 6
Fig. 6
RNA-seq variant calling. A Median across samples of the proportion of variants called only by WES, only by RNA-seq, and by both technologies, in total and stratified by variant classes. Of note, over 50% of variants in coding regions are called only by WES, probably because of RNA-seq limitations including that not all the genes are expressed in fibroblasts, the uneven read coverage along the transcript, and because the expression level of variant-carrying alleles must be high enough to yield sufficient RNA-seq read coverage. B WES (row 1) and RNA-seq (row 2) coverage of the affected sample (R46723) and a representative control (row 3) using IGV. The created exon and a variant are seen in the affected RNA profile, but not covered in the corresponding WES and not present in the control. Bottom row: schematic depiction of the NM_024120.4 c.2T>C and c.223-907A>C variants and their consequence on the RNA level with an out-of-frame ATG (in green), and a cryptic exon with the PTC (bright red rectangle) on NDUFAF5. The percentage of detected transcript isoform is shown next to it. Figure not shown at genomic scale
Fig. 7
Fig. 7
RNA-seq captures a broad spectrum of mechanisms of action of pathogenic variants. Summary of variants and their effect on transcript across 33 cases from our cohort, where the capture of a transcript event by RNA-seq enabled establishing a genetic diagnosis in 32 and rejecting a candidate gene in one case, highlighting the value of transcriptomics as a tool in diagnostics. Each gene represents one case, except for NFU1, which belongs to two categories. Highlighted in orange are the nine cases where the intronic variant was missed by WES but called by RNA-seq. Both large deletions were missed by WES and RNA-seq, therefore requiring WGS to be identified. PTV: protein-truncating variant. MNV: multi-nucleotide variant
Fig. 8
Fig. 8
Tissue-specific gene expression. A Proportion of expressed genes from different categories across 49 GTEx tissues with the CATs delineated in red. B Proportion of expressed genes from different categories across CATs from GTEx, alone or in combination with another CAT. “All” refers to all the 49 tissues, not just the CATs. B: blood, M: muscle: F: fibroblasts, CAT: clinically accessible tissue

References

    1. Nguengang Wakap S, Lambert DM, Olry A, Rodwell C, Gueydan C, Lanneau V, et al. Estimating cumulative point prevalence of rare diseases: analysis of the Orphanet database. Eur J Hum Genet EJHG. 2020;28(2):165–173. - PMC - PubMed
    1. EURORDIS. Rare Diseases: Understanding this Public Health Priority. Rare Dis. 2005;1–14.
    1. Wright CF, FitzPatrick DR, Firth HV. Paediatric genomics: diagnosing rare disease in children. Nat Rev Genet. 2018;19(5):253–68. - PubMed
    1. Repp BM, Mastantuono E, Alston CL, Schiff M, Haack TB, Rötig A, et al. Clinical, biochemical and genetic spectrum of 70 patients with ACAD9 deficiency: is riboflavin supplementation effective? Orphanet J Rare Dis. 2018;13(1):120. - PMC - PubMed
    1. Koch J, Mayr JA, Alhaddad B, Rauscher C, Bierau J, Kovacs-Nagy R, et al. CAD mutations and uridine-responsive epileptic encephalopathy. Brain. 2017;140(2):279–286. - PubMed

Publication types